I. INTRODUCTION
The growing popularity of electronic products equipped with wireless communication devices has led to a sharp increase in the complexity of radio frequency (RF) – integrated circuits such as managing a large number of application functions, support of multiple frequency bands or the compliance with the standards of multiple wireless transmissions.
The decreasing of the size and weight of current handset applications as well as the increasing of the number of available functionalities deals with a reduction in circuit size and weight of the systems, i.e., a challenge to the miniaturization of passive components.
In that sense, the concept of three-dimensional (3D) IC integration packaging using through silicon vias (TSV) stacking is one of the most promising technologies. It can extend Moore's law by stacking and shortening the connection path between memory and logic [Reference Rector1]. Due to the increase in functional integration requirements, more and more assembly house and wafer foundries are looking into 3D TSV technology, which allows stacking of large-scale circuits (LSIs) thereby enabling products to be made smaller with more functionality. The 3D technology realizes miniaturization up to 300–400% compared to the conventional packaging [Reference Umemoto, Tanida, Nemoto, Hoshino, Kojima, Shirai and Takahashi2]. Furthermore, TSVs are also relevant to develop “more than Moore” applications [Reference Ho, Yoon, Zhou, Pasad, Kripesh and Lau3], where passive functions originally lying on the printed circuit board (PCB) can be designed with the help of TSVs using original component architectures such as embedded solenoids (see Fig. 1).
SEM image of the solenoid. (a) Top view. (b) Bottom view.

Several papers have been already reported in that sense showing bandpass filters realization either on glass or silicon substrate [Reference Sridharan, Min, Sundaram, Sukumaran, Hwang, Chan, Liu, Nopper and Rao4, Reference Chuan, Suaya and Banerjee5].
Together with the emergence of new type of interconnects such as TSVs, embedded solenoid implementation within silicon or glass substrate [Reference Yoon, Kim, Han, Yoon and Kim6] is now considered to easily build a coil-type structure. Several proposals have been done in that sense leading to very promising results [Reference Al-Sarawi, Abbott and Franzon7, Reference Tesson8]. In fact, integrated solenoids can be used to produce larger quality factor than in RF BiCMOS/CMOS planar technologies within a given footprint [Reference Soh, Yue, McCarthy, Ryu, Lee, Wong and Quate9–Reference Joseph, Qizhi, Hodge, Gray, Stein, Previti-Kelly, Lindgren, Gebreselasie, Voegeli, Candra, Hershberger, Malladi, Watson and Dunn13]. This increase in quality factor can be attributed to both metal thickness and the specific solenoid property of storing energy according to:
 $$Q = \omega \cdot {\hbox{energy stored} \over \hbox{average power dissipated}}.$$
So, in this paper, we propose to take advantage of TSVs implemented with thick patterned metals within an integrated passive devices (IPD) process to design-embedded solenoids within high resistive silicon (HRS) substrate (ρ = 1000 Ω cm). The paper will be organized as follow: integrated solenoid specific architecture will be introduced in the first part; a rigorous theoretical analysis based on Biot and Savart relations is presented in the second part. In order to support these theoretical investigations, analysis from wide-band two-ports S-parameters measurements are carried out in the third part. Solenoids performances will be presented from an electrical point of view together with their relative precision taking into account the process spread. In this part, the specific methodology considered for 2-port S-parameters used to support the measurements of double-sided wafers will be also described. The last part of this paper is dedicated to the modeling of solenoids. Two approaches (compact modeling and electromagnetic (EM) modeling) have been considered and both will be described. A discussion of the accuracy of these two approaches is also proposed based on the possible applications of this kind of devices within a complex hybrid system.
II. SILICON INTERCONNECTIONS
The 3D integration techniques appear as an innovative solution for many system-in-package (SiP) applications. If the bond wires interconnects remain the most used in the manufacture of micro-electronic technologies, emerging 3D interconnections have emerged as bumps and through vias in the substrate for the development of applications such as dual flip-chip on both sides of the substrate. The 3D through vias of interconnect technology allows us to connect the circuits on both sides of a carrier substrate and stack up carrier substrates themselves through metal balls. Such a configuration of integrated circuit opens the way for integration of passive components in the substrates carriers around which the active circuits can be connected and appears to be a great interest since they can reduce interconnects lengths and therefore interference between the active circuits and passive components. These 3D integration techniques allow to benefit from increased space in the circuit through the interconnections of small size but also to minimize the impedance reduced by these interconnections, i.e., the parasitic elements. On these two points, through vias appear to be an effective solution. Therefore, characterization of electrical through vias was performed in order to quantify the values of parasitic elements. A cross-section of stacking technology is given below (Fig. 2).
Cross-section of stacking technology to fabricate through vias and 3D solenoids.

III. PHYSICAL IMPLEMENTATION OF 3D INTEGRATED INDUCTANCE
The stacking technology used to manufacture 3D solenoid is very simple and is the same as the technology used to manufacture the 3D interconnect technology through vias [Reference Duplesssis, Tesson, Neuilly, Tenailleau and Descamps14]. Through-vias technology allows building wired-wound spirals around the silicon to achieve a 3D solenoid. Therefore, once the manufacturing process of through vias acquired, the implementation of the 3D solenoid through silicon requires no additional mask. This is an important aspect compared to surface-mounted devices (SMD) components that are costly in material and especially in assembly [Reference Goldfarb and Pucel15]. The EM RF measurement and simulation techniques used for the characterization of the through vias are applicable to 3D solenoids.
In this paper, we focus on the development of an original type of solenoid using 3D interconnect technology emerging vertical through vias. This new type of solenoid uses the thickness of silicon as the third dimension. In fact, each turn of the solenoid consists of two through vias used as vertical pillars.
The geometric parameters and the different configurations are then described. The solenoid developed as part of this work consists of non-joining turns and wound around the silicon to form a square section (Fig. 3). Two parallel rows of through vias, arranged in a staggered or aligned, form the sides of the solenoid on the whole-height of the silicon substrate. Transmission lines are realized in the levels of metallization on the front and the back of the silicon (IN1 and IN2, respectively) to form the turns around the square in silicon.
Schematic representation of 3D solenoid.

A turn is composed of elementary metal tracks connected by two through vias (Fig. 4). Copper is deposited on the front and rear on high-resistivity 300 µm thick silicon. The solenoid is built by successive addition of elementary coils according to a spiral coil distance equal to SP′ (see Fig. 5). The line-to-line spacing on the same level noted SP can be reduced by increasing the width W of the lines. The other geometrical parameters are diameter and height of vias also set by the manufacturing process through vias. The minimum distance from via-to-via noted SP was set at 125 µm to avoid mechanical stress. The 3D solenoid is thus defined by a number of turns N, D y width, overall length D x without pads, and a width of metal tracks W. D y and W parameters can be modified to adjust the value of self-inductance of solenoid (Fig. 5).
Illustration of a one turn solenoid. (a) Top view. (b) 3D view.

Illustration of a 2-turn solenoid made by connecting two elementary coils (standard configuration), the access lines and the measurements added pads. (a) Top view. (b) 3D view.

Therefore, a solenoid with N turns is composed of N elementary turns placed side by side and connected while respecting the minimum distance SP between two consecutive vias as shown in Fig. 5. The principle of the 3D solenoid can thus be configured in several ways: input/output signal on either side of the solenoid as shown in Figs 5(a) and 5(b) (the standard configuration) or input/output side as shown in Fig. 6 (the U-shaped configuration).
Illustration of a 7-turn and U-shaped solenoid. (a) Top view. (b) 3D view.

A 3D solenoid in two rows (U-shaped) to increase its number of turns without increasing its length D X [Reference Frye16] has also been made. Fig. 6 shows a 7-turn solenoid with the same length as a conventional 3-turn solenoid (565 µm for 7-turn U-shaped solenoid cons 535 µm for the 3-turn classic solenoid).
A) Radiofrequencies characterization
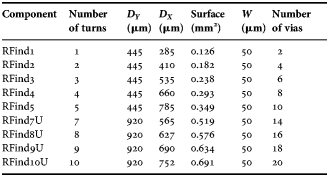
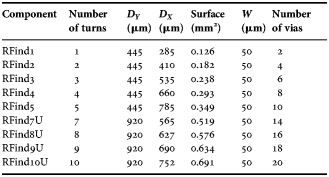
To prove the feasibility and the great interest of such 3D architectures, nine solenoids were designed and evaluated by on-wafer probing measurements. Five classical structures of solenoids (1–5 turns) and four U-shape structures (7–10 turns) have been implemented on HRS substrate (ρ = 1 kΩ cm) to be tested. The RF test structures are one (solenoids U) or two ports (for conventional solenoids), respectively, surrounded by a ring to electrically connect the grounds of the coplanar ports (ground/signal/ground). The geometrical characteristics of each test structure are given in Table 1. The variable D X is the length of each solenoid. Some examples of 3D views as well as the names assigned to the test structures are shown in Fig 7.
Examples of test structures for RF characterization of classical solenoid with 1, 3, and 5 turns, and U-type solenoid with 7 and 9 turns.

Geometric variations for five conventional solenoids and four U-type solenoids.
1) ESTIMATE VALUE OF 3D SOLENOIDS SELF-INDUCTANCE
The self-inductance of a solenoid depends on the number of squared contiguous turns [Reference Bouvier, Savin and Guiraud17]. Wheeler [Reference Wheeler18] provides a simple formulation for square solenoids consisting of N contiguous turns, radius 2a and length b.
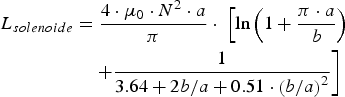 $$\eqalign{L_{solenoide} &= {4 \cdot {\rm \mu}_0 \cdot N^2 \cdot a \over \pi} \cdot \; \left[\ln \left(1 + {\pi \cdot a \over b} \right)\right. \cr &\quad \left. + {1 \over 3.64 + 2b / a+0.51 \cdot \left(b / a \right)^2} \right]}$$
This equation is well suited for long solenoids with adjacent turns in order to magnetically couple the turns together. In the case of 3D architecture of solenoid, whether conventional or U-type, the estimation of self-inductance of 3D solenoids by the formulation of Wheeler is inappropriate because in our case, we have spaced turns with a significant distance from each other. The SP spacing from via to via is set by the manufacturing process through vias. Therefore a second method was applied to estimate the self-inductance. It consists in the model of partial inductances [Reference Rhueli19].
The principle of partial inductance applied to traditional 3D and U solenoids, consists to decompose the overall self-inductance L into a sum of elementary self-inductance. The decomposition of the solenoid for the calculation of elementary self-inductances is shown in Fig. 8. The items listed by the same letter A, B, or C, are geometrically identical and therefore have the same partial self-inductance. Because the through vias are being widely spaced from each other (the spacing between two consecutive vias is about 125 µm), the inductive coupling between adjacent turns is very low and consequently all couplings are neglected.
Cutting a 2-turn 3D conventional solenoid for the calculation of basic self-inductance.

It is the same for the metallization lines in front (IN2) and bottom (IN1). The width W (50 µm) being smaller than the diameter of the vias (75 µm), inductive coupling will be very low between two adjacent lines. The estimated self-inductance values of 3D conventional solenoids obtained from the partial inductance method are shown in Table 2.
Estimated analytical value of the self-inductance (nH) of 3D solenoids based on the principle of partial inductances compared to N 2 variation law given in equation (2).

2) METHODOLOGY OF RF MEASUREMENTS
The RF characterization of 3D solenoids architectures is based on the same principle of RF characterization of through vias alone. Full 2-port S-parameter measurements were performed for each device in the wide-frequency range 100 MHz to 50 GHz. For conventional solenoids, transmission measurements (S 12 parameter) were carried out while it was return loss measurement (S 11 parameter) for the U-typed solenoids. In the latter case, the output port is left in open circuit. The wafer is stacked to a grounded chuck to ensure a global reference ground to the wafer, the network analyzer and the micro-probes. A sheet of glass fiber (~100 µm thick, ɛr = 4.5) has been placed between the grounded chuck and the bottom metal tracks of the wafer. The calibration method used is LRRM. The reference planes for measurements are at the RF micro-tip.
The Fig. 9 shows an X-ray view of 3D conventional and U solenoids where the through vias have a good electrical quality. On this X-ray image, a metallization pattern appears on the front in slight gray. Black areas indicate a good conductivity in the through via.
X-ray photographs of structure of solenoids.

3) RESULTS OF MEASUREMENTS
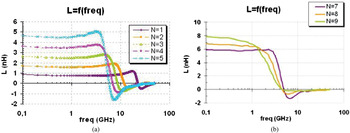
Five classical 3D solenoids having 1–5 turns and four 3D solenoids 3D U having 7–10 rounds were characterized on 17 different chips from the silicon wafer. [S] Parameter measurements have been performed for each test structure on wide frequencies range from 100 MHz to 50 GHz. To provide the best electrical performance of inductances, it must be able to recreate the conditions in RF measurements using these inductances in various circuits. The following two items present the technique for extracting electrical performance in terms of resistance, self-inductance and quality factor. The results obtained after extraction are shown in the two following paragraphs.
The electrical parameters of each solenoid 3D (classic and U) as resistance R, self-inductance L, and quality factor Q were extracted from RF measurements using the simple mode of expression, repeated below.
 $$R = real \left({1 \over Y_{11}} \right)\comma \; L = {imag \left(1/Y_{11} \right)\over 2\pi f}\comma \; Q=- {imag \left(Y_{11} \right)\over real \left(Y_{11} \right)},$$
where f represents the frequency.
4) CLASSICAL 3D SOLENOIDS
Figs 10(a), 10(b), 11(a), 11(b), 12(a) and 12(b) show resistance, self-inductance, and quality factor of 3D conventional solenoids having from N = 1 to 5 turns and U-type 3D solenoids with 7–9 turns from the same wafer.
On-wafer measurements of R for 3D conventional solenoids with 1–5 turns (a) and U-type 3D solenoids with 7–10 turns from the same crystal (b).

On-wafer measurements of L for 3D conventional solenoids with 1–5 turns (a) and U-type 3D solenoids with 7–9 turns (b).
On-wafer measurements of Q for 3D conventional solenoids with 1–5 turns (a) and U-type 3D solenoids with 7–9 turns (b).

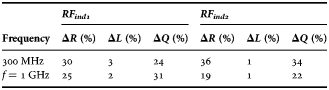
Since the manufacturing process is not mature, it was not possible to measure more than a dozen components of 1 and 2 turns solenoids on a single wafer, measurements of resistance, self-inductance, and quality factor were performed on different chips. Then the percentage of relative difference, i.e., peak to peak fluctuation was calculated for two frequencies (300 MHz and 1 GHz).
As shown in Table 3, the relative difference on the value of self-inductance is very low (about 2% at 1 GHz). At first level, the 3D solenoid architecture gives a quite comparable reproducibility to a spiral inductance in a standard CMOS process where manufacturing steps are well controlled and substantially higher than SMD inductances below 10 nH.
Variations on the measurements of R, L, and Q of 1-turn (RF ind1) and 2-turn 3D solenoids (RF ind2).
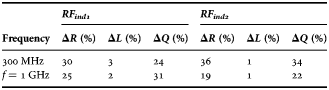
The relative deviation of the resistance and hence on the quality factor is much higher. This can be explained by the process used to achieve the interconnections, which has not yet been mature. As shown in Fig. 13, filling copper in the upper part of the through vias varies from one to another via.
Scanning electron microscope view illustrating the filling of copper in the high through vias.

5) COMPARISON BETWEEN 3D SOLENOID AND MONOLITHIC PLANAR INDUCTANCES
In the context of the system in package, the short distance between passive and active circuits reduces the lengths of interconnections between the two circuits, which involve less parasitic elements. The main interest of through vias is to coexist interconnects and inductances (solenoids 3D) in a single process while providing isolation between them due to very weak coupling between two consecutive through vias.
A 1-turn 3D solenoid was compared with a 1-turn octagonal-shaped inductance made either in 0.25 µm BiCMOS or 45 nm CMOS processes (Fig. 14) [Reference Tiemeijer, Havens, Bouttement and Pranger20]. In both cases, the self-inductance value is 0.88 nH. For similar footprint and self-inductance, the solenoid performances in terms of Q-factor are better up to 3 GHz (Figs 15(a) and 15(b)).
Photograph of 1-turn octagonal-shaped inductance.

Comparison of self-inductance L (a) and Q-factor (b) measurements between a 3D solenoid and an octagonal CMOS and BiCMOS inductance.

6) COMPARISON BETWEEN 3D SOLENOID AND SMD
The graph shown in Fig. 17 compares the values of classical 3D solenoids self-inductance to ones proposed by different types of SMD inductances (Fig. 16) versus the surface occupied.
Picture of SMD inductance.

Inductance L versus the surface for SMD inductances and conventional 3D solenoids.

Below a self-inductance of 4 nH, the 3D conventional solenoid technology on silicon takes a smaller area than SMD inductors, which the surface of contact pads is not taken into account. The width of the lines of solenoids can be reduced in order to increase the self-inductance of each line. For a classical N-turns 3D solenoid, the width of the lines has been reduced from 50 µm to 10 µm. Thus, the self-inductance increases of 16%.
V. ANALYTIC CALCULATION OF A 3D INDUCTANCE
A) Calculation of the magnetic induction
The concept of inductance is defined over a closed circuit driven by an electric current. According to Faraday's law, the change in magnetic flux through a closed circuit is proportional to the electric current generated by this circuit. The inductance is defined as:
 $$L = {\Psi \over I} = {\int\!\!\!\int_{S} \vec{B} \cdot d\vec{S} \over I} = {{\rm \mu}_0 \over 4 \pi} \oint_{l} \oint_{m} {d\vec{l} \cdot d\vec{m} \over r}\comma \;$$
where  $\vec{B}$, is the vector magnetic induction generated by the current; S, the surface of 1-turn inductance (see Fig. 5);
 $d\vec{m}/d\vec{S}$, the length element relative to the surface of the loop;
 $d\vec{l}$, the element of length of the circuit in which flows the current; r, the distance between a point on the circuit and a point of the loop; and Ψ, the magnetic flux generated by the current flowing through the circuit.
Knowledge of the magnetic induction determined by the law of Biot–Savart and the current that generates this induction is sufficient to determine the inductance value:
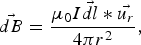 $$\vec{dB} = {{\rm \mu}_0 I \vec{dl} \ast \vec{u_r} \over 4\pi r^2}\comma \;$$
when the current is time dependent, especially at higher frequencies, the propagation phenomena must be taken into account by using the Maxwell equations. These phenomena are well represented by the hypothesis of potential delayed noted  $\vec{A}$ by replacing I by I(t/v):
 $$\vec{A} = {{\rm \mu}_0 \over 4\pi} \int\limits_0^L {I\lpar t - r/c\rpar \over r}. \vec{dl} = {{\rm \mu}_0 \over 4\pi} \int\!\!\!\int\!\!\!\int {\vec{J}. \lpar t - r/c\rpar dv \over r}.$$
In order to calculate the magnetic induction radiated by a 3D inductance at any point of the space, we have separated the calculations into two stages. First, we present the calculation of the induction created by an elementary surface like a rectangular patch (Fig. 18) and then the analytic calculation of the induction created by a cylindrical wire (Fig. 19).
Induction created by a rectangular surface at the point P.

Induction created by a cylindrical wire with radius r.

B) Induction from a rectangular path
We assume that the magnetic induction is created by a flat rectangular surface at the point P of which each side is included between z − z 0 and z − z 0 + dz with z ranging between z 0 + λ/2 and z 0 − λ/2. The current density is assumed to be uniform. The current in each elementary wire is:
 $$dI = {I \over \lambda} dz\comma \;$$
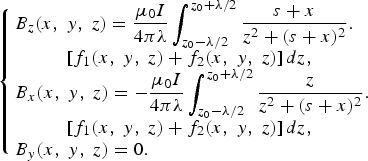 $$\left\{\matrix{B_z \lpar x\comma \; y\comma \; z\rpar = \displaystyle{{\rm \mu}_0 I \over 4\pi \lambda} \int_{z_0 - \lambda /2}^{z_0 + \lambda /2} {s + x \over z^2 + \lpar s + x\rpar ^2}. \hfill \cr \left[f_1 \lpar x\comma \; y\comma \; z\rpar + f_2 \lpar x\comma \; y\comma \; z\rpar \right]dz\comma \; \cr B_x \lpar x\comma \; y\comma \; z\rpar = - \displaystyle{{\rm \mu}_0 I \over 4\pi \lambda} \int_{z_0 - \lambda /2}^{z_0 + \lambda /2} {z \over z^2 + \lpar s + x\rpar ^2}. \hfill \cr \left[f_1 \lpar x\comma \; y\comma \; z\rpar + f_2 \lpar x\comma \; y\comma \; z\rpar \right]dz\comma \; \cr B_y \lpar x\comma \; y\comma \; z\rpar = 0. \hfill} \right.$$
By setting:
 $$f_1 \lpar x\comma \; \, y\comma \; \, z\rpar = {{L_1 - y} \over \sqrt{\left(L_1 - y \right)^2 +\, z^2 + \left(s + x \right)^2}}\comma \;$$
 $$f_2 \lpar x\comma \; \, y\comma \; \, z\rpar = {L_1 + y \over \sqrt{\left(L_1 + y \right)^2 +\, z^2 + \left(s + x \right)^2}}.$$
C) Induction from a cylindrical wire with radius r
The calculation of the magnetic induction  $\vec{B}$ is obtained from the vector potential created by a coil with radius λ0 and centered at O. The observation point P has coordinates x, y, and z 0. The vector potential is in the plane O xy as shown in Fig. 18.
The current element I.dl has the components on O x. The current density is assumed to be uniform. The current in each elementary wire [r, r + dr] [a, a + da] is:
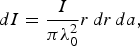 $$dI = {I \over \pi \lambda_0^2 }r\, dr\, da,$$
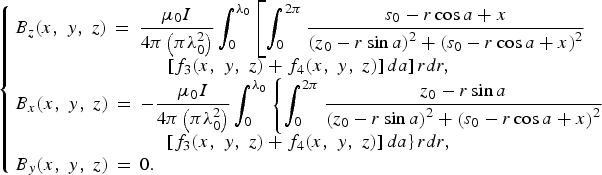 $$\left\{\matrix{B_z \lpar x\comma \; y\comma \; z\rpar \,=\, \displaystyle{{\rm \mu}_0 I \over 4\pi \left(\pi \lambda_0^2 \right)} \int_{0}^{\lambda_0} \left[\int_0^{2\pi} {s_0 - r\cos a + x \over \left(z_0 - r\sin a \right)^2 + \left(s_0 - r\cos a + x \right)^2} \right.\hfill \cr \left. \left[f_3 \lpar x\comma \; y\comma \; z\rpar + f_4 \lpar x\comma \; y\comma \; z\rpar \right]da \right]rdr\comma \; \cr B_x \lpar x\comma \; y\comma \; z\rpar \,=\, - \displaystyle{\mu _0 I \over 4\pi \left(\pi \lambda_0^2 \right)} \int_0^{\lambda_0} \left\{\int_0^{2\pi} {z_0 - r\sin a \over \left(z_0 - r\sin a \right)^2 + \left(s_0 - r\cos a + x \right)^2} \right.\hfill \cr \left. \left[f_3 \lpar x\comma \; y\comma \; z\rpar + f_4 \lpar x\comma \; y\comma \; z\rpar \right]da \right\}rdr\comma \; \cr B_y \lpar x\comma \; y\comma \; z\rpar \,=\, 0. \hfill} \right.$$
By setting:
 $$\eqalign{ & f_3 \lpar x\comma \; \, y\comma \; \, z\rpar \cr & \quad = {L_1 - y \over \sqrt{\left(L_1 - y \right)^2 +\, \left(z_0 - r\sin a \right)^2 + \,\left(s_0 - r\cos \; a + x \right)^2}}\comma \;}$$
 $$\eqalign{&f_4 \lpar x\comma \; \, y\comma \; \, z\rpar \cr &\quad = {L_1 + y \over \sqrt {\left(L_1 + y \right)^2 + \,\left(z_0 - r\sin a \right)^2 +\, \left(s_0 - r\cos \; a + x \right)^2}}.}$$
D) Theoretical calculation of the inductance value created by a 3D self-inductance
Fig. 20 shows that the self-inductance is composed of rectangular paths and cylindrical elements. Therefore, we can apply the above calculations to calculate the total inductance of an elementary loop. The loop is supposed to be closed by AD.
1-turn 3D-embedded solenoid.

The flux value defined on the surface of the solenoid ABCD has the following expression:
 $${ \phi} = {{\rm \mu} _0 \over 4\pi} \int_{-s_2}^{s_2} \int_{-s_1}^{s_1} B_z \lpar x\comma \; y\comma \; z\rpar \, dx\, dy\comma \;$$
where the equation of B Z has the expression given in [Reference Yu, Kim, Herrault, Ji, Kim and Allen12].
We deduce the inductance L 1 given by the lengths AD and BC:
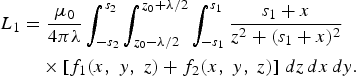 $$\eqalign{L_1 &= {{\rm \mu}_0 \over 4\pi \lambda} \int_{-s_2}^{s_2} \int_{z_0 - \lambda /2}^{z_0 + \lambda /2} \int_{-s_1}^{s_1} {s_1 + x \over z^2 + \lpar s_1 + x\rpar ^2} \cr &\quad \times \left[f_1 \lpar x\comma \; y\comma \; z\rpar + f_2 \lpar x\comma \; y\comma \; z\rpar \right]\, dz\, dx\, dy .}$$
The flux value on the cylindrical elements with length of AB+CD is defined through the surface 1-turn 3D-embedded solenoid of the expressed as:
 $$\phi = {{\rm \mu}_0 \over 4\pi} \int_{-s_2}^{s_2} \int_{s_1}^{s_1} B_z \lpar x\comma \; y\comma \; z\rpar \, dx\, dy\comma$$
where B z is given in equation (10). We deduce the inductance given by the lengths AB and DC.
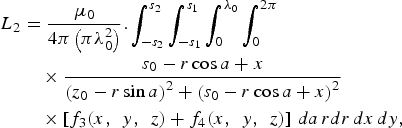 $$\eqalign{L_2 &= {{\rm \mu}_0 \over 4\pi \left(\pi \lambda_0^2 \right)}. \int_{-s_2}^{s_2} \int_{-s_1}^{s_1} \int_0^{\lambda_0} \int_0^{2\pi} \cr &\quad \times {s_0 - r\cos a + x \over \left(z_0 - r \sin a \right)^2 + \left(s_0 - r\cos a + x \right)^2} \cr &\quad \times \left[f_3 \lpar x\comma \; \, y\comma \; \, z\rpar + f_4 \lpar x\comma \; \, y\comma \; \, z\rpar \right]\, da\, rdr\, dx\, dy\comma \; }$$
where f 1 and f 2 are given in 9, 10 and f 3 and f 4 are given in equation (13) and (14), respectively.
The following example sets the value of inductance for a given size of the coil:
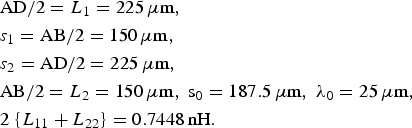 $$\eqalign{&\hbox{AD}/2 = L_{1}=225\, \rm\mu \hbox{m}\comma \; \cr &s_{1} = \hbox{AB}/2 = 150\, \rm\mu \hbox{m}\comma \; \cr &s_{2} = \hbox{AD}/2 = 225\, \rm\mu \hbox{m}\comma \; \cr &\hbox{AB}/2 = L_{2}=150\, \rm\mu \hbox{m}\comma \; s_{0} = 187.5\, \rm\mu \hbox{m}\comma \; \lambda_0 = 25\, \rm\mu \hbox{m}\comma \; \cr &2 \;\lcub L_{11} + L_{22} \rcub = 0. 7448\, \hbox{nH}.}$$
VI. BROADBAND ELECTRICAL MODELING
The behavior of the inductances which are the elements that occupy the largest surface for radio frequency integrated circuits (RF ICs) must be described accurately. Usually classical planar inductors are modeled with the help of the nine-elements scheme [Reference Melendy, Francis, Pichler, Hwang, Srinivasan and Weisshaar21]. This technique is not suited in the case of 3D solenoids because of the backside metallization and parasitic 3D effects introduced by vias. The modeling of inductances realized on silicon is difficult to achieve because of the multiplicity of physical phenomena related to the conductivity of the substrate. They are both of electrical (conduction) and magnetic (eddy current) nature.
Two broadband modeling techniques were developed and tested on embedded 3D solenoids: an EM model using the commercial simulation software EMPRO from Agilent and an electrical model obtained from discrete elements. EM as well as electrical models have been validated on the frequency band 100 MHz–50 GHz and were tested with 1–5 laps conventional 3D architectures of solenoids.
A) EM model
The EM approach enables better understanding of the parasitic phenomena existing in the silicon due to through vias and detects variations in the manufacturing process of through vias (metallization thickness on the surface, conductivity of copper resistivity silicon). Physical parameters of the process of through vias have been used for the EM simulation: the resistivity of the silicon is equal to 103 Ω cm, the conductivity of the copper is 5.8 × 10⁷ S/m and the thickness of the copper is equal to 8 µm.
An EM model whose input parameters are the values of the process was extracted as well as a file of [S] broadband parameters that will be inserted into a circuit simulator.
The model was tested both on a 1-turn and on N-turns conventional 3D solenoids to ensure that the process variations observed on a 1-turn 3D solenoid, especially the decrease of the resistivity of silicon, can be also applied to other 3D solenoids. The EM model has been applied correctly to a 1- to 10-turn 3D solenoid using the description of the solenoid and the process parameters. The N-turns solenoids were performed by setting series of elementary turns. An example of results for a 2-turn 3D solenoid is shown in Figs 21(a)–21(e). Resistance (R), self-inductance (L), quality factor (Q), return loss S 11, and insertion losses parameters S 21 obtained from the EM model are compared with RF measurements.
Extracted parameters for the EM model compared to RF measurements with a 2-turn 3D solenoid. (a) Resistance. (b) Self-inductance. (c) Quality factor. (d) Return loss. (e) Insertion loss.

The resonant frequency is especially well modeled, whether on the physical parameters (S 21) or the extracted parameters (L).
This initial RF-modeling approach based on EM simulations is flexible. This model of through vias 3D solenoid was calibrated on RF measurements to be applied with different geometries. In case of change in the geometry of the 3D solenoid, it is easy to restart a simulation for EM [S] parameters model. However, EM simulation time increases with the complexity of the structure to model. Moreover, such a model needs to be implemented in a well-known environment to the user (e.g., directly into the circuit design tool) and must be didactic.
B) Physical modeling and electrical equivalent circuit
The purpose of the analog approach is to obtain an equivalent broadband electrical model that does not require the use of an EM simulator and certainly avoiding the problems inherent in this technique (choice of robust EM simulator; calibration of the EM tool, simulation time). The second model is based on a physical approach where the solenoid is modeled by 3D localized components, while respecting the geometry. This independent of frequency model uses electrical lumped components to be integrated into a commercial circuit simulator and usable over a wide-frequency band.
In the physical approach, our choice has been to monitor the physical configuration of embedded 3D solenoids in order to obtain an electric RLC equivalent broadband model. An equivalent circuit model of the solenoid is obtained using an equivalent circuit of a through via previously established. Then, each solenoid is built from an elementary coil repeated N times, with N ranging from 1 to 5. We will start by establishing an equivalent circuit model for a 1-turn solenoid. This model is then used for solenoids with several turns. The proposed model is presented Fig. 22. Both through vias are modeled by the elements in series R VIA, L VIA reflecting the resistance and self-inductance. Resistance R and inductance L of microstrip lines connected from the top and bottom of vias to form a coil are represented by R top, R bot, L TOP, and L bot. The influence of contact pads for RF measurements is taken into account with R topL TOP. Microstrip lines and contact pads have already their own model implemented in the equivalent electrical circuit simulator ADS from Agilent. Among the contributions to be considered in the equivalent model, we identified the capacitance C VIA caused by the presence of an insulating layer between the substrate and the through via, the capacitance C ox introduced by the oxide layer placed between the substrate and the microstrip lines (front and back), the capacitance C Insulation representing the interconnection with the component due to the presence of the sheet of fiberglass under the substrate for RF measurements. The capacitor C c simulates the coupling effects between two consecutive front or rear metal lines. R sub and C sub account for losses of the substrate parasitic across through vias.
Equivalent electrical circuit of a 1-turn 3D solenoid.

Three distinct phenomena are responsible for the degradation of performances. One of these is the skin effect, which the characteristic is a non-uniformity of current density on the section of the conductor. It causes a significant increase in resistance and a decrease of quality factor. This contribution is taken into account in the model of via as well as for microstrip lines and contact pads. The second phenomenon occurs when two conductors are close to each other. Their respective fields add up creating a non-uniform current in each of the two conductors (proximity effect). In our case, the distance between the vias is too far to have proximity effects. The development of the EM model with 3D EM simulation was used to check there were no effects. The third phenomenon concerns the inductive losses associated with eddy currents in the substrate. The use of a silicon substrate with high-resistivity limits the inductive losses in the substrate.
C) Calculation of lumped elements of the physical model
Through-vias, tracks and contact pads have their own equivalent electric model. The model of a through via is valid for a single geometry (300 µm of height and 75 µm of diameter). Considering the changes in deposition of copper in the through vias (roughness, covering), the values of model parameters equivalent resistance of a through via previously exposed were extracted after optimization of the physical model of via on RF measurements. So, they do not take into account the input parameters like the geometry of the through via. Physical models of conductive lines and contact pads as the length L, the width W, the thickness t and the nature of the substrate are considered as input parameters. For the equivalent circuit model proposed in Fig. 22, the values of parasitic elements (C VIA, R sub, C sub, C ox, and C ground) were calculated using the equations described in the next paragraphs.
1) CAPACITANCE OF THE INSULATION LAYER OF A THROUGH VIA: C VIA
An insulating layer of thickness 0.5 µm and relative permittivity ɛr = 4 is deposited at the interface between silicon and the through via (Fig. 23). The capacity resulting C VIA between via and the silicon [Reference Melendy, Francis, Pichler, Hwang, Srinivasan and Weisshaar21] is expressed by:
Illustration of the capacitance between copper and silicon in a through via.

 $$C_{via} = {2\pi \cdot \varepsilon_0 \varepsilon_r \cdot h_{via} \over \ln \left({R_2 / R_1} \right)}.$$
As the through via has a diameter of 75 µm and a height of 300 µm, we obtain a capacitance between silicon and through via: C VIA = 9.9 pF.
2) RESISTANCE AND CAPACITANCE OF THE SUBSTRATE R SUB AND C SUB
The influence of the substrate resistivity ρsub on the value of quality factor Q of the 3D solenoid is modeled through resistance R sub. Resistance R sub and capacitance C sub of the substrate [Reference Mandal and De22] can be calculated in terms of the length D X of the coil as the following expression (20). ρsub is the resistivity of the substrate is and ɛr is the relative permittivity of the silicon substrate. D x is defined in Fig. 24.
Illustration of the resistance and capacitance of the substrate.

 $$R_S = {3 \over \pi \cdot D_X} \rho_{sub}\comma \; C_S = {\pi \cdot D_X \over 3} \varepsilon_r \varepsilon_0.$$
The solenoid having the same height as the silicon substrate (h sub = 300 µm, ρsub = 1 k Ω.cm), we obtain R sub = 31 kΩ and C sub = 33 fF.
3) CAPACITY OXIDE: C OX
The presence of a thin oxide layer (1 µm thickness) deposited between the front and back silicon microstrip lines generate parasitic capacitances that can degrade the series resonant frequency of the solenoid. The resultant parasitic capacitance is modeled by the capacitance C ox and calculated by adding three capacitive contributions [Reference Yue, Ryu, Lau, Lee and Wong23]: the capacitance under the line C bot, the lateral capacitance C ei for an insulated conductor (i.e., for infinite spacing) and the surface capacitance C top only useful for large lines, which is the case of the 3D solenoid (Fig. 25).
Parasitic capacitances existing between a copper line and silicon substrate.

The two capacitances C bot and C ei (surface capacitance C top directly impacts the capacitance C ei side) are then calculated using the following equations:
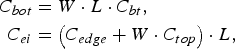 $$\eqalign{C_{bot} &= W \cdot L \cdot C_{bt}\comma \; \cr C_{ei} &= \left(C_{edge} + W \cdot C_{top} \right)\cdot L\comma \; }$$
where C bt is the capacitance density under the line, C top is the capacitance of the surface and C edge is the lateral surface capacitance.
The resultant parasitic capacitance C ox is obtained by summing these two capacitive contributions.
 $$C_{ox} = C_{bot} + C_{ei}.$$
For a 1-turn solenoid, the front metallization has a total length of 500 µm while the backside metallization is 350 µm long. The lines have the same width of 50 µm. The resulting capacitance is then equal to C ox_top = 885 fF and C ox_bot = 619 fF.
4) CAPACITANCE OF THE GROUND PLANE CGROUND
To isolate the backside metal lines of the solenoids and the ground plane for RF measurements (chuck), a sheet of fiberglass insulation has been inserted (Fig. 26). Existing parasitic capacitances between the backside line and the ground plane are also extracted using the same equations than C ox.
Parasitic capacitances between a copper line and a ground plane.

For a 1-turn 3D solenoid, the backside transition line has a total length L = 350 µm and a width W = 50 µm. The resulting capacitance is C ground = 13.8 fF.
5) VALIDATION WITH A 1-TURN SOLENOID RF MEASUREMENTS
The values of parasitic elements previously calculated were incorporated into the physical model of a 1-turn solenoid. Optimization performed with circuit simulation software has been used to adjust [S] parameters of the equivalent model with [S] parameters measurements. The optimization condition was performed by changing the values of parasitic elements (Figs 27(a) and 27(b)). Figs 28(a)–28(c) compare the extracted parameters (resistance, self-inductance, and quality factor) obtained from RF measurements with physical model before and after optimization for the return loss parameters S11 and insertion losses S 21.
RF measuments compared with the physical model before and after optimization for return loss S 11 (a) and insertion lossses S 21. (b) of a 1-turn solenoid.

Comparison of R (a), L (b), and Q (c) between RF measurements and physical model with and without optimization for a 1-turn solenoid.

Without optimization of S parameters (green trace), we can notice that the resistance of the solenoid is largely underestimated at higher frequencies. Thus, the quality factor value is much higher than the measured one (trace in purple and orange). After optimization, the insertion loss parameter S 21 is close to RF measurements and return loss coefficient S 11 is decreased. A very good agreement between the measurements of R, L, and Q and the optimized model has been reached (Table 4).
Values of parasitic elements of the equivalent model before and after optimization.

L via and C via have been previously defined in the modeling and optimization of through vias [Reference Duplesssis, Tesson, Neuilly, Tenailleau and Descamps14, Reference Goldfarb and Pucel15]. The value of L via is about 56 pH in the frequency range from 0.1 to 50 GHz. The resistance R via varies from 0.01 Ω at 0.1 GHz to 100 at 50 GHz.
Referring to the values of parasitic elements after optimization (Table 4), we noticed a change in resistance of the substrate. By developing the EM model, the change of resistivity of the substrate appeared. Both models (EM and physical) reflect resistive losses due to the substrate, thus confirming a change of resistivity of the substrate near the through vias.
6) CHARTS GENERATION WITH THE PHYSICAL MODEL
On the one hand, a physical model of solenoid predicts the behavior frequencies when designing a circuit. On the other hand, as a function of the geometry of the solenoid, such a physical model reduces the number of iterations in the design of a 3D solenoid to achieve accurate performances. Keeping the same geometry of the through vias and the minimum distance from via to via, it is possible to vary the dimensions of the lines through this physical model and visualize the self-inductance and quality factor in function of frequency. Equations developed for calculating the parasitic elements are implemented in the physical model in order to automatically recalculate the value of these components according to geometric variations of the lines. In the physical model, the width W of the lines has been changed to observe the impact on the overall performance of a 1-turn solenoid. Figs 29(a)–29(c) illustrate the impact of the change in lines width (initial value 50 µm, 10 to 90 µm variation in steps of 20 µm) on the extraction of the resistance, the self-inductance and the quality factor. A maximum quality factor Q = 25 has been obtained with a line width W = 90 µm at 2 GHz for a 0.8 nH device.
Variations of the width W of lines and impact on extracted parameters obtained from the physical model.

The line width limit was set at 90 µm to avoid modifying the original arrangement of the through vias of the solenoid. Thus, by varying the width of the tracks of 10–90 µm solenoid, we obtain a maximum variation on the self-inductance of 34 and 65% on the quality factor at a frequency of 1 GHz. Just as for the monolithic spiral inductances and even if a better high-frequency resistance model is needed to capture the Q up to 50 GHz, such charts are very useful to get an idea of the performance achievable according to the dimensions of the solenoid.
VII. CONCLUSION
This paper has presented a new architecture of inductance, the 3D solenoid, measured and modeled frequencies for a structure with one and several turns. We have highlighted three methodologies to obtain an equivalent broadband model of N-turn 3D solenoids. The first is based on electromagnetic simulation taking into account the parameters of the manufacturing process of through vias. The advantage of this EM model is its flexibility. This EM model can be applied to any geometry of solenoids, provided that it does not change the process parameters. The second modeling technique of solenoids was to create an equivalent physical broadband model with lumped elements (R, L, and C). This model instantaneously takes into account changes of geometric lines of the solenoid (length, width, and thickness). Both modeling approaches show similar performance, either to translate the frequency behavior of physical parameters (transmission S 21) or extracted parameters (resistance, self-inductance, and quality factor). The EM model allows designing components and/or circuit blocks with EM simulations by testing performances and thus to avoid the systematic use of RF measurements and fabrication of test structures. Using the physical model approach, it is possible to generate abacus showing versus frequency the self-inductance and quality factor depending on the size of the lines. When designing a solenoid, the number of iterations needed to obtain accurate performance reduces considerably. An EM model has high flexibility for the S-parameters of any 3D geometry of solenoids. Any change of the geometry requires a new EM simulation, depending on the size and complexity of the structure under test.
In an effort to integrate passive components into a single substrate and near the active chips, a new architecture of inductance using the advantages of this emerging technology of interconnections has been investigated. The vias are connected together through the substrate by metallization on the front and rear to achieve a square section embedded solenoid through the substrate. Characterization in the field of RF points up interesting performances in terms of quality factor below 2 GHz, which outperform those obtained by planar inductors in a standard BiCMOS or CMOS process with self-inductance and equivalent surface. The minimum spacing observed between two consecutive vias greatly reduces the inductive coupling between two adjacent turns in the solenoid. Therefore, the values of self-inductance are proportional to the number of turns, which represents an advantage with respect to insulation between two adjacent solenoids. Modeling allows translating the electrical frequency behavior of the inductance and takes into account its influence on performance when designing the circuit thanks to commercial CAD tools. The model should be valid over a wide-frequency band and take into account the effects of parasites that cause performance degradation of an inductance (skin effect and proximity, eddy currents, etc.). The modeling of a planar inductor is well known and controlled, which is not the case of a 3D inductance through the substrate using the through vias. Two approaches were considered by the broadband modeling of the solenoid. The first is based on EM simulation that takes the parameters of the manufacturing process as input through vias. Once the EM simulator calibrated on measurements of a solenoid in round 1, this model is applicable to different geometries of coils, resulting in great flexibility. The second approach is an electrical modeling based on discrete elements (R, L, and C) using the equivalent circuit model of a through via. This equivalent electrical model of the solenoid although it is as good as the EM model, is only valid for a single geometry through via (height of 300 µm, 75 µm diameter) which it makes less attractive and flexible.
ACKNOWLEDGEMENTS
The presented structures with TSV technology were fabricated by IPDiA (formally NXP Semiconductors). RF characterizations of the devices were made by Dominique Lesenechal.
 Philippe Descamps received his Ph.D. degree from his University of Lille, France, in 1992. From 1989 to 1999, He joined the research group Integrated Systems at the Institut d'Electronique, de Microélectronique et de Nanotechnologies (IEMN), Villeneuve d'Ascq, France, where he was involved in microwave research activities mainly guided by the Characterization, Simulation and Design, and by the realization of field-effect devices in centimeter and millimeter waves ranges for automotive applications and telecommunication systems. In 1999, he became a full Professor at the Ecole Nationale Supérieure d'Ingénieurs de Caen (ENSICAEN), France where he currently heads the mixed research Laboratory of Microelectronics and Physics of Semiconductors (LaMIPS). He is mainly involved in high frequencies Characterization, Modelization of Microwave Components and of the design of Integrated Circuits for telecommunication applications.
 Olivier Tesson was born in France in 1973. He received his Master of Science and his Ph.D. from the University of Nantes, France, in 1996 and 2000, respectively. He joined NXP Semiconductors (formally Philips Semiconductors) in 2001, in Caen, France, as CAD engineer where he developed Multi Technology Design Environment suitable for Multi-Chip Module design. From 2005 to 2009, he was device modeling engineer within the Corporate Innovation and Technology Department. From 2009 to now, he is involved – within the Innovation Center for RF department @ NXP – in several research programs on high performances 3D IC applications and packaging for millimeter wave applications. He is the winner of one “best paper award” in recent international conference and hold five US patents in the area of passive integration. He is currently the Principal Engineer, expert in passive integration and RF modeling/characterizations of passive devices.
 Daniel Pasquet gained his French diplôme d'ingénieur in 1970 at ENREA, Clichy, France and his Ph.D. at Lille 1 University in 1975. He had been an Assistant Professor at IUT Calais, France, from 1971 to 1981. He joined ENSEA, Cergy, France, in 1981, where he has been a Professor since 1987. He headed ENSEA Microwave laboratory from 1983 to 1992 and from 2002 to 2005. He had been ENSEA vice-director in charge of research from 1998 to 2007. He is currently a researcher at LaMIPS, Caen, France. Daniel Pasquet's research fields are microwave measurements and passive components modeling. He is the author or co-author of 180 papers and communications. He is currently IEEE France Section chair and Microwave Theory and Technique Society (MTT-S) Region 8 chapter coordinator. He is a member of the MTT-11 Measurements Technical Committee.
 Hugues Murray was born in Evreux, France, in 1941. He received his Master degree in 1967 at the Caen University, France and his Ph.D. degree in Physics in November 1974 at the Rouen University, France. From 1970 to 1981, he worked at the same university as an associate professor in Thin Films laboratory. In 1983, he joined the microelectronic group in the Material Science laboratory of Caen University and in 1987 he was the manager of the Thin Film Group in the Superconductor Center of the same university. From 2000 to 2002, he was the Head of the jointed laboratory University-Philips semiconductors CAEN (France). He is now a Professor Emeritus at the University of Caen, France. His research areas include semiconductors, II–VI compounds, High Tc superconductors, Ferroelectrics Thin films and Low temperature electronic devices. He has authored and co-authored 90 papers. He was the President of the French Vacuum Society (UISTAV) during 1995–1997.