The rod bipolar cell pathway in the mammalian retina
Psychophysical experiments in human subjects (Stiles, Reference Stiles1959; Alpern, Reference Alpern1965) and electrophysiological recordings from mammalian ganglion cells (Barlow et al., Reference Barlow, Fitzhugh and Kuffler1957; Gouras & Link, Reference Gouras and Link1966) demonstrated that threshold responses during rod- and cone-mediated vision are independent. This independence suggested that the outputs of the two photoreceptor types are conveyed to ganglion cells by distinct neural pathways. Such an arrangement was confirmed by the identification of rod- and cone-specific bipolar cells (Dowling & Boycott, Reference Dowling and Boycott1966; Boycott & Dowling, Reference Boycott and Dowling1969; Kolb, Reference Kolb1970; Boycott & Kolb, Reference Boycott and Kolb1973). Though it was assumed initially that both rod bipolar (RB) and cone bipolar cells contacted ganglion cells directly (Boycott & Dowling, Reference Boycott and Dowling1969), subsequent electron microscopic (EM) analysis revealed that RB cells do not make synapses with ganglion cells; rather, RBs provide synaptic input to a narrow-field bistratified amacrine called the AII amacrine cell, which is the most common amacrine cell in the retina (Kolb & Famiglietti, Reference Kolb and Famiglietti1974; Famiglietti & Kolb, Reference Famiglietti and Kolb1975; Strettoi & Masland, Reference Strettoi and Masland1996).
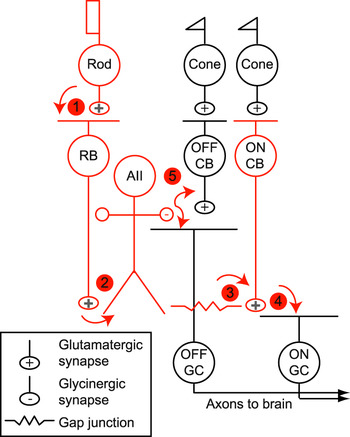
Today, the so-called RB cell pathway of the mammalian retina is well described (Fig. 1) (Bloomfield & Dacheux, Reference Bloomfield and Dacheux2001): rods make synapses onto RB cells, which depolarize in response to light. RB cells make excitatory dyad synapses with two postsynaptic elements from separate neurons: AII and A17 amacrine cells (Famiglietti & Kolb, Reference Famiglietti and Kolb1975; Dacheux & Raviola, Reference Dacheux and Raviola1986; Raviola & Dacheux, Reference Raviola and Dacheux1987). The A17 returns a GABAergic feedback synapse onto the RB terminal (Kolb & Nelson, Reference Kolb and Nelson1983; Dacheux & Raviola, Reference Dacheux and Raviola1986; Raviola & Dacheux, Reference Raviola and Dacheux1987; Protti & Llano, Reference Protti and Llano1998; Hartveit, Reference Hartveit1999; Zhang et al., Reference Zhang, Li, Trexler and Massey2002; Singer & Diamond, Reference Singer and Diamond2003; Chavez et al., Reference Chavez, Singer and Diamond2006). The AII, which is depolarized by input from the RB cell, is coupled by gap junctions to other AIIs and to the axon terminals of ON cone bipolar cells (Famiglietti & Kolb, Reference Famiglietti and Kolb1975; Strettoi et al., Reference Strettoi, Raviola and Dacheux1992, Reference Strettoi, Dacheux and Raviola1994; Mills & Massey, Reference Mills and Massey1995; Veruki & Hartveit, Reference Veruki and Hartveit2002a,Reference Veruki and Hartveitb; Petrides & Trexler, Reference Petrides and Trexler2008). The AII also makes inhibitory synapses onto the terminals of some OFF cone bipolar cells and onto the dendrites of some OFF ganglion cells (Pourcho & Goebel, Reference Pourcho and Goebel1985; Sterling et al., Reference Sterling, Freed and Smith1988; Strettoi et al., Reference Strettoi, Raviola and Dacheux1992; Tsukamoto et al., Reference Tsukamoto, Morigiwa, Ueda and Sterling2001; Manookin et al., Reference Manookin, Beaudoin, Ernst, Flagel and Demb2008; Murphy & Rieke, Reference Murphy and Rieke2008; Münch et al., Reference Münch, da Silveira, Siegert, Viney, Awatramani and Roska2009). Thus, the AII distributes the rod signal to multiple parallel cone bipolar pathways. In effect, then, the RB pathway “piggybacks” on the cone pathways (Strettoi et al., Reference Strettoi, Raviola and Dacheux1992). This arrangement likely arose to integrate rods, which are evolutionarily newer than cones, into existing retinal circuitry (Lamb, Reference Lamb2009).
The RB pathway of the mammalian retina. Principal neurons are colored red and synapses are numbered. Cones make synapses with two classes of cone bipolar cell (CB): ON and OFF CBs. ON and OFF CBs make excitatory synapses with ganglion cells (GCs), the output cells of the retina. (1) Rods make synapses with an ON bipolar cell, the RB, and with a subset of OFF CBs (not shown). Gap junctions between rods and cones are not illustrated (Raviola & Gilula, Reference Raviola and Gilula1973; DeVries & Baylor, Reference DeVries and Baylor1995). (2) RBs contact AII amacrine cells. (3) AIIs are coupled by gap junctions to some types of ON CBs and to other AIIs. (4) ON CBs make synapses with ON GCs. (5) AIIs make inhibitory glycinergic synapses with some OFF CBs and OFF GCs.

Anatomy underlies the sensitivity of the RB pathway
Signaling in the RB cell pathway is remarkably sensitive and reliable. The circuit is capable of encoding a rod’s response to a single absorbed photon: the firing of a ganglion cell can be modulated by the absorption of a single photon within its receptive field, and the absorption of ∼10 photons within the retina as a whole can generate a visual percept (Hecht et al., Reference Hecht, Shlaer and Pirenne1942; Barlow et al., Reference Barlow, Levick and Yoon1971; Sakitt, Reference Sakitt1972; Mastronarde, Reference Mastronarde1983; Field et al., Reference Field, Sampath and Rieke2005). The sensitivity of ganglion cells to light arises from the convergence of thousands of rod outputs onto single ganglion cells: each RB cell pools the output of 20–100 rods; each AII receives input from 10–20 RBs and makes electrical synapses with approximately five ON cone bipolar terminals (numbers vary with species and retinal location) (Dacheux & Raviola, Reference Dacheux and Raviola1986; Sterling et al., Reference Sterling, Freed and Smith1988; Vaney et al., Reference Vaney, Gynther and Young1991; Young & Vaney, Reference Young and Vaney1991; Strettoi et al., Reference Strettoi, Raviola and Dacheux1992; Tsukamoto et al., Reference Tsukamoto, Morigiwa, Ueda and Sterling2001). Additionally, the divergence of a rod’s output to multiple neurons (one rod→two RBs→five AIIs→eight ON cone bipolars) may increase the reliability with which the rod signal is transferred through the retina (Sterling et al., Reference Sterling, Freed and Smith1988; Vaney et al., Reference Vaney, Gynther and Young1991; Young & Vaney, Reference Young and Vaney1991; Tsukamoto et al., Reference Tsukamoto, Morigiwa, Ueda and Sterling2001). As noted by Sterling et al. (Reference Sterling, Freed and Smith1988), divergence generates multiple copies of a rod’s signal that are transferred to a single ganglion cell by hundreds of ON cone bipolar cell synapses.
AIIs themselves are remarkably sensitive to light: in the dark-adapted retina, AIIs respond reliably to dim flashes of light sufficient to isomerize single rhodopsin molecules in fewer than 1 in 3 to 1 in 100 rods (varying by species) (Pang et al., Reference Pang, Gao and Wu2004; Trexler et al., Reference Trexler, Li and Massey2005; Dunn et al., Reference Dunn, Doan, Sampath and Rieke2006). This sensitivity arises in part from the convergence of hundreds of rod outputs onto a single AII. Furthermore, electrical coupling between AIIs enhances the effective convergence of rods onto AIIs by permitting AIIs to be depolarized by RBs that are not directly presynaptic (Sterling et al., Reference Sterling, Freed and Smith1988; Bloomfield et al., Reference Bloomfield, Xin and Osborne1997; Pang et al., Reference Pang, Gao and Wu2004).
Gap junction-mediated coupling between AIIs can be demonstrated with the diffusion of tracer molecules. For example, Neurobiotin injected into a single AII spreads to neighboring AIIs, demonstrating cytoplasmic coupling (Vaney, Reference Vaney1991; Mills & Massey, Reference Mills and Massey1995); this coupling, studied by light microscopy, confirms EM evidence for gap junctions between AII dendrites and somata (Kolb & Famiglietti, Reference Kolb and Famiglietti1974; Famiglietti & Kolb, Reference Famiglietti and Kolb1975; Strettoi et al., Reference Strettoi, Raviola and Dacheux1992, Reference Strettoi, Dacheux and Raviola1994; Vardi & Smith, Reference Vardi and Smith1996). These gap junctions are homomeric protein complexes composed of connexin (Cx) 36 (Feigenspan et al., Reference Feigenspan, Teubner, Willecke and Weiler2001; Mills et al., Reference Mills, O’Brien, Li, O’Brien and Massey2001; Deans et al., Reference Deans, Völgyi, Goodenough, Bloomfield and Paul2002). The first evidence for functional electrical coupling between AIIs came from the work of Bloomfield et al. (Reference Bloomfield, Xin and Osborne1997), who demonstrated that light-mediated modulation of receptive field size varied directly with light-mediated modulation of tracer coupling. Later, Veruki and Hartveit (Reference Veruki and Hartveit2002a) recorded direct electrical coupling between pairs of AIIs in a retinal slice preparation (see also Tian et al., Reference Tian, Jarsky, Murphy, Rieke and Singer2010).
Gap junctions and signal processing
Though the convergence within the RB pathway in part underlies its sensitivity, convergence also increases the noise of neural responses by the square root of the number of inputs (Baylor et al., Reference Baylor, Nunn and Schnapf1984; Sterling et al., Reference Sterling, Freed and Smith1988; Smith & Vardi, Reference Smith and Vardi1995). Gap junctions, by acting as low-pass filters, can average uncorrelated noise and improve the signal-to-noise ratio (S/N) in instances in which coupled cells receive correlated input (Lamb & Simon, Reference Lamb and Simon1976; Tessier-Lavigne & Attwell, Reference Tessier-Lavigne and Attwell1988). Thus, it is thought that the AII network serves a noise-reducing role in rod-mediated vision.
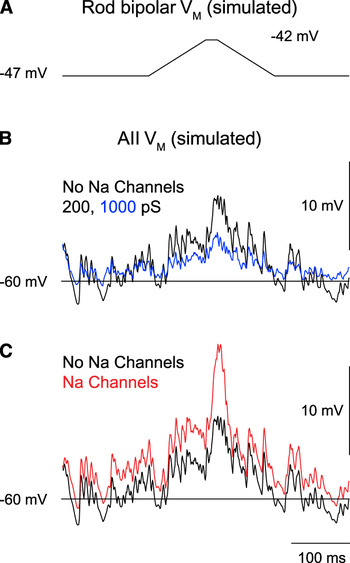
A computational model of the AII network suggested that the network reduces noise in the RB pathway by filtering noise arising from spontaneous release at RB cell synapses and amplifying selectively light-evoked RB cell outputs that diverge to multiple coupled AIIs (Smith & Vardi, Reference Smith and Vardi1995). When the AIIs in the model lacked voltage-gated conductances (i.e., when they were passive neurons), their simulated responses to single photons could be differentiated from noise throughout a range of junctional coupling strength. Inclusion of voltage-gated conductances within the AIIs (noted first by Boos et al., Reference Boos, Schneider and Wässle1993; also see Tian et al., Reference Tian, Jarsky, Murphy, Rieke and Singer2010) improved considerably the S/N of their simulated responses. Thus, the model indicated that a coupled network of AII amacrine cells with voltage-gated conductances might provide a mechanism for nonlinear amplification of small correlated signals during rod vision (Fig. 2) (Smith & Vardi, Reference Smith and Vardi1995).
A computational model of the AII network predicts effects of coupling strength and Na channel expression on postsynaptic responses to divergent RB output. (A) The voltage change in a single RB cell elicited by a “single-photon” response. The cell’s synaptic output diverges to five coupled AII amacrines. (B) The postsynaptic responses elicited when coupling strength (black = junctional conductance of 200 pS; blue = junctional conductance of 1000 pS) is altered. (C) The postsynaptic responses elicited when Na channel expression (black = no Na channels; red = Na channels present; junctional conductance = 200 pS) is varied. It is evident that the postsynaptic response is larger when the coupling conductance is low and Na channels are present. Figure modified from Smith and Vardi (Reference Smith and Vardi1995).

Experimental evidence has supported the first point made by the aforementioned study, that coupling within the AII network improves the sensitivity of AIIs: measured light-independent (i.e., background) noise was higher, and the S/N of light responses lower, in AIIs from mice that lack AII–AII gap junctions (Cx36−/− mice) relative to wild-type mice (Dunn et al., Reference Dunn, Doan, Sampath and Rieke2006). Further, it is worth noting that direct measurements from AIIs indicated that the coupling conductances used in the modeling study were within the physiological range (albeit on the low end) (Veruki & Hartveit, Reference Veruki and Hartveit2002a; Veruki et al., Reference Veruki, Oltedal and Hartveit2008).
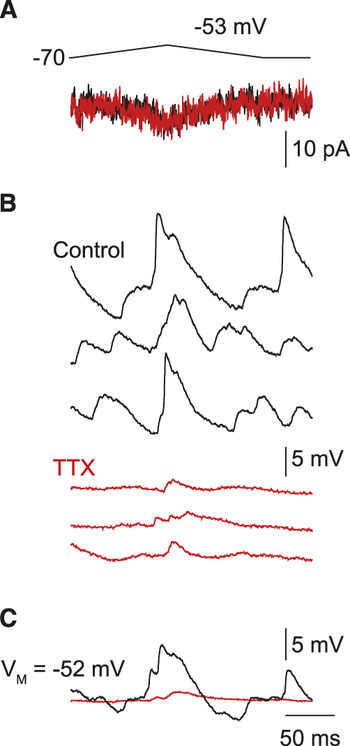
Experiments, however, have not provided evidence for active amplification of correlated light-evoked signals by AIIs. In a light-adapted retinal slice preparation, Tian et al. (Reference Tian, Jarsky, Murphy, Rieke and Singer2010) found that voltage-gated Na channels can accelerate and, under some circumstances, boost the amplitudes of excitatory postsynaptic potentials (EPSPs) recorded in AIIs and evoked by depolarizing single RB cells (Fig. 3). But, in the same study, blocking voltage-gated Na channels with tetrodotoxin (TTX) did not reduce the amplitudes of light-evoked currents recorded in ganglion cells (though the light-evoked currents were slowed considerably). Thus, Na channels may shape the time course of signal transfer through the AII network but apparently do not influence the S/N of such signals. Indeed, Dunn et al. (Reference Dunn, Doan, Sampath and Rieke2006) demonstrated that the gain of dim light-evoked AII voltage and current responses (current- and voltage-clamp recordings, respectively) scaled identically with background, indicating that postsynaptic amplification of RB output, at least at the level of individual AIIs, does not play a role in increasing S/N.
Representative AII responses to RB output. Minimal presynaptic depolarization (to −53 mV at left) elicits presynaptic Ca currents (A) and EPSPs (B: individual responses; C: averaged responses). EPSPs evoked by minimal stimulation are reduced substantially by TTX. TTX has no effect on the presynaptic Ca current. TTX also eliminates fluctuations in V M. Figure modified from Tian et al. (Reference Tian, Jarsky, Murphy, Rieke and Singer2010).

Modulation of coupling
AII–AII coupling is modulated by background light. In the dark-adapted condition, the AII’s receptive field is small (∼50 μm, two to three times the diameter of its dendritic tree) (Bloomfield et al., Reference Bloomfield, Xin and Osborne1997; Xin & Bloomfield, Reference Xin and Bloomfield1999; Bloomfield & Xin, Reference Bloomfield and Xin2000). The receptive field size increases (up to several 100 μm) with background illumination through the scotopic regime before the size diminishes again at photopic intensities (Bloomfield et al., Reference Bloomfield, Xin and Osborne1997). Parallel changes in tracer coupling between AIIs are observed with changes in background illumination. Hence, the dependence of receptive field size on background apparently reflects a background-dependent change in electrical coupling between AIIs, which has been postulated to gate signal transfer between the rod and cone pathways (Bloomfield et al., Reference Bloomfield, Xin and Osborne1997). The reduced coupling between AIIs at photopic intensities is thought to limit the lateral spread of neural signals in the inner retina, thereby improving the spatial acuity of bipolar, amacrine, and ganglion cell receptive fields.
Light is thought to affect AII–AII coupling by modulating the release of the neuromodulator dopamine (DA) from dopaminergic amacrine cells (Witkovsky, Reference Witkovsky2004). Although it was observed that DA, acting through D1 receptors (D1Rs), reduces tracer coupling between AIIs (Hampson et al., Reference Hampson, Vaney and Weiler1992), the mechanism by which this occurs is uncertain. It is well-known that activation of D1Rs induces cAMP production by activating PKA (Schorderet & Nowak, Reference Schorderet and Nowak1990; Neve et al., Reference Neve, Seamans and Trantham-Davidson2004), and predictably, direct activation of PKA and application of membrane-permeant cAMP analogs mimic the DA effect (Mills & Massey, Reference Mills and Massey1995; Xia & Mills, Reference Xia and Mills2004; Urschel et al., Reference Urschel, Hoher, Schubert, Alev, Sohl, Worsdorfer, Asahara, Dermietzel, Weiler and Willecke2006; Kothmann et al., Reference Kothmann, Massey and O’Brien2009). Additionally, the DA- and cAMP-regulated phosphoprotein 32 kDa (DARPP-32) is expressed by AIIs (Partida et al., Reference Partida, Lee, Haft-Candell, Nichols and Ishida2004; Witkovsky et al., Reference Witkovsky, Svenningsson, Yan, Bateup and Silver2007). DARPP-32 is phosphorylated at multiple sites by a number of signaling pathways that are activated by D1R activation, and DARPP-32 phosphorylation can either promote or inhibit phosphorylation of other proteins by modulating the activity of protein phosphatase 1 (PP1) and PKA (Svenningsson et al., Reference Svenningsson, Nishi, Fisone, Girault, Nairn and Greengard2004).
Initial studies suggested that DA does not modulate AII–ON cone bipolar tracer coupling (Mills & Massey, Reference Mills and Massey1995), which appears to be mediated by heteromeric Cx36/Cx45 gap junctions (Han & Massey, Reference Han and Massey2005; Maxeiner et al., Reference Maxeiner, Dedek, Janssen-Bienhold, AmmerMüller, Brune, Kirsch, Pieper, Degen, Kruger, Willecke and Weiler2005; Dedek et al., Reference Dedek, Schultz, Pieper, Dirks, Maxeiner, Willecke, Weiler and Janssen-Bienhold2006). Further quantitative analysis indicated that tracer coupling between these two cell types indeed is suppressed by DA, and that the strength of AII–ON cone bipolar coupling should therefore be reduced in daylight (Xia & Mills, Reference Xia and Mills2004). Physiological evidence, however, suggests that the AII–ON cone bipolar gap junction continues to function as an electrical synapse in the light-adapted retina (Xin and Bloomfield, Reference Xin and Bloomfield1999; Manookin et al., Reference Manookin, Beaudoin, Ernst, Flagel and Demb2008; Münch et al., Reference Münch, da Silveira, Siegert, Viney, Awatramani and Roska2009). Therefore, it will be necessary to measure directly whether the conductance of the AII–ON cone bipolar gap junction in the intact retina is modulated by light.
Two competing and conflicting hypotheses have been advanced to link D1R activation to the modulation of gap junctions: 1) PKA-induced phosphorylation of Cx36, likely at serines 110 and 293, decreases gap junction conductance (Urschel et al., Reference Urschel, Hoher, Schubert, Alev, Sohl, Worsdorfer, Asahara, Dermietzel, Weiler and Willecke2006) and 2) DA-stimulated dephosphorylation of Cx36 at serine-293 decreases gap junction conductance (Kothmann et al., Reference Kothmann, Massey and O’Brien2009). This dephosphorylation is mediated by the activation of PP2A activation by PKA; this signaling pathway is likely complex, as PP2A also dephosphorylates DARPP-32 at Thr75, thereby promoting inhibition of PKA (Svenningsson et al., Reference Svenningsson, Nishi, Fisone, Girault, Nairn and Greengard2004).
Adding to the uncertainty surrounding the relationship between D1R activation and the modulation of AII–AII coupling is the lack of evidence for D1R expression by AIIs: antibody labeling finds no D1R in AIIs (Veruki & Wässle, Reference Veruki and Wässle1996) (but see Nguyen-Legros et al., Reference Nguyen-Legros, Simon, Caille and Bloch1997), and AIIs do not express green fluorescent protein (GFP) in bacterial artificial chromosome transgenic mice, in which the D1R promoter drives GFP expression (J. Singer, unpublished observations). Further, direct application of either DA or D1R agonists and antagonists does not affect junctional conductances recorded in pairs of AIIs in an in vitro retinal slice preparation (J. Singer, unpublished observations). Thus, additional work is required to elucidate the localization and function of D1Rs as they relate to modulation of AII–AII coupling.
Selective network connections: ON cone bipolar cells
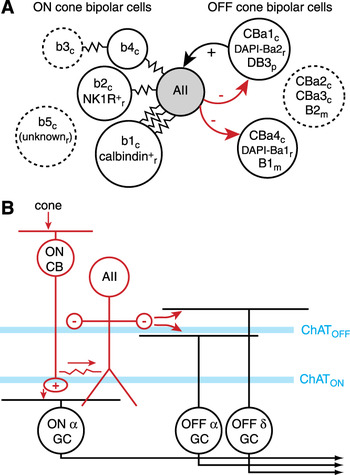
The AII’s dendrites span the entire depth of the inner plexiform layer enabling potential contact with numerous types of bipolar, amacrine, and ganglion cell. Only a subset of each cell class, however, actually connects with the AII. High-resolution analysis of the cat retina by serial EM revealed that the AII avoids making gap junctions with two types of ON cone bipolar cell (b3 and b5) and forms unequal numbers of gap junctions with the remaining types (McGuire et al., Reference McGuire, Stevens and Sterling1984; Cohen & Sterling, Reference Cohen and Sterling1990). The AII made a large number of gap junctions with the b1 type and seven- to eightfold fewer contacts (based on surface area) with b2 and b4 types. Furthermore, the b3 type, which lacked a direct connection, was connected effectively to the AII through b3–b4 gap junctions (Cohen & Sterling, Reference Cohen and Sterling1990) (Fig. 4A).
Selective connections of the AII amacrine cell. (A) Schematic diagram indicates the gap junction coupling (resistor symbols) for different bipolar cell types. In most cases, connections were identified by EM and cell type names are from the original studies (see text). Species are indicated by subscript letter (c = cat; r = rabbit; m = mouse; p = primate). Cell types that were not directly connected to the AII are outlined with a dashed line. (B) Photopic circuit for AII signaling. When the RB cell (not shown) saturates in bright light, cones stimulate ON cone bipolar cells, which excite the AII through the gap junction. The AII can then inhibit, via a glycine synapse, two OFF ganglion cell types, Alpha and Delta, which stratify on different sides of the cholinergic band (immunopositive for choline acetyltransferase; ChAT) in the outer half of the inner plexiform layer (i.e., the OFF ChAT layer). The AII could also inhibit certain types of OFF cone bipolar cell (not shown).

Complementary light microscopic studies have been performed in the rabbit retina using tracer coupling and antiglycine immunohistochemistry. Glycine labeling implies coupling because glycine only enters ON cone bipolar cells through their gap junctions with AIIs (i.e., the bipolar cells do not express glycine transporters; Vaney et al., Reference Vaney, Nelson and Pow1998). These experiments suggested that one (unknown) bipolar type lacked any connection to the AII, while one of the remaining bipolar types (calbindin-immunoreactive; calbindin+) showed a dominant connection (Massey & Mills, Reference Massey and Mills1999; Petrides & Trexler, Reference Petrides and Trexler2008). EM analysis confirmed that the calbindin+ type makes numerous gap junctions with AIIs, whereas another type (neurokinin 1 receptor immunopositive) makes fewer junctions (Massey & Mills, Reference Massey and Mills1999; Kim et al., Reference Kim, Park, Kang, Kim, Lee, Ahn and Chun2005, Reference Kim, Jung, Kang, Jeon, Cha, Kim and Chun2010). An electrophysiological assessment of AII–ON cone bipolar coupling in rat retina found that four types of ON cone bipolar cell were coupled to AIIs, but it was not possible to rank order the connection strengths by cell type (Veruki & Hartveit, Reference Veruki and Hartveit2002b).
The ON cone bipolar cell with the strongest connection to the AII is that type presynaptic to the ON Alpha ganglion cell: the b1 type in cat (Freed & Sterling, Reference Freed and Sterling1988; Cohen & Sterling, Reference Cohen and Sterling1990) and the calbindin+ type in rabbit (Massey & Mills, Reference Massey and Mills1996, Reference Massey and Mills1999; Strettoi et al., Reference Strettoi, Dacheux and Raviola1994; Zhang et al., Reference Zhang, Li, Hoshi, Mills and Massey2005) (Fig. 4A). ON Alpha ganglion cells are highly sensitive under scotopic conditions; presumably, this can be attributed to the strong coupling between their presynaptic bipolar cells and the AII network (Müller et al., Reference Müller, Wässle and Voigt1988; Dunn et al., Reference Dunn, Doan, Sampath and Rieke2006; Murphy & Rieke, Reference Murphy and Rieke2006).
In the cat retina, the ON cone bipolar cell with the weakest connection to the AII was the b5 cell presumed to be a specialized “S-cone bipolar cell,” with selective input from S cones: the 5% of cones with peak sensitivity to short-wavelength (S) light. Thus, highly sensitive scotopic signals would apparently not reach those ganglion cells postsynaptic to S-cone bipolar cells. Primate small bistratified ganglion cells, however, receive input from S-cone bipolar cells and display responses mediated by the RB/AII amacrine pathway (Crook et al., Reference Crook, Davenport, Peterson, Packer, Detwiler and Dacey2009; Field et al., Reference Field, Greschner, Gauthier, Rangel, Shlens, Sher, Marshak, Litke and Chichilnisky2009). Furthermore, primate S-cone bipolar cells showed apparent contacts with AII cells, as determined by immunohistochemistry and confocal microscopic analysis (Field et al., Reference Field, Greschner, Gauthier, Rangel, Shlens, Sher, Marshak, Litke and Chichilnisky2009). Thus, the AII cell connections to the ON cone bipolar cells apparently are weighted differently by cell type with the specific pattern of connections differing between species.
Selective network connections: OFF cone bipolar cells
As with their connections to the ON pathway, AIIs make synapses with only a subset of OFF bipolar cells. In the mouse retina, for example, EM analysis showed that AII lobular appendages, the sites of glycine release, are presynaptic to a B1 OFF bipolar cell type but not a B2 type (Tsukamoto et al., Reference Tsukamoto, Morigiwa, Ueda and Sterling2001). Interestingly, the B1 type received input at its dendrites only from cone photoreceptors, whereas the B2 type, despite its label as a “cone bipolar cell,” received input from both cones and rods (Fig. 4A). This combined connectivity with both cones and rods was identified as a “tertiary rod pathway” through certain bipolar cell types (Soucy et al., Reference Soucy, Wang, Nirenberg, Nathans and Meister1998; Hack et al., Reference Hack, Peichl and Brandstatter1999; Tsukamoto et al., Reference Tsukamoto, Morigiwa, Ueda and Sterling2001, Reference Tsukamoto, Morigiwa, Ishii, Takao, Iwatsuki, Nakanishi and Fukuda2007; Li et al., Reference Li, Keung and Massey2004). The differences between B1 and B2 types suggest that some OFF bipolars may be connected to either the “primary rod pathway” (i.e., the AII circuit) or the tertiary rod pathway (i.e., direct rod input) but not both. All bipolar types presumably would receive signals through the “secondary rod pathway,” whereby rods signal through gap junctions with cones and then through chemical synaptic input to cone bipolar cells (Nelson, Reference Nelson1977; Smith et al., Reference Smith, Freed and Sterling1986; Schneeweis & Schnapf, Reference Schneeweis and Schnapf1995).
In cat, AIIs avoid contacting certain OFF cone bipolar cell types (CBa2, CBa3) but do contact others (CBa1, CBa4; McGuire et al., Reference McGuire, Stevens and Sterling1984). The CBa1 cell seemed to be specialized among the OFF bipolars, similar to the cat’s ON b1 bipolar, to receive dominant input from the AII. Not only does the CBa1 cell receive input from the AII, it also makes reciprocal ribbon synapses onto the AII; these reciprocal synapses provide a mechanism for OFF bipolar cells to excite the AII at light offset (McGuire et al., Reference McGuire, Stevens and Sterling1984). Indeed, similar reciprocal synapses were observed in rabbit (DAPI-Ba2 cell type; Strettoi et al., Reference Strettoi, Raviola and Dacheux1992; Merighi et al., Reference Merighi, Raviola and Dacheux1996), rat (Chun et al., Reference Chun, Han, Chung and Wässle1993), and primate (DB3 cell type; Wässle et al., Reference Wässle, Grünert, Chun and Boycott1995; Jacoby & Marshak, Reference Jacoby and Marshak2000) (Fig. 4A).
The function of reciprocal AII–OFF bipolar cell synapses, however, requires further study: although the AII’s light response shows an OFF response component at an early stage of light adaptation (rabbit; Xin & Bloomfield, Reference Xin and Bloomfield1999), its ON response component dominates under most conditions (Nelson, Reference Nelson1982; Dacheux & Raviola, Reference Dacheux and Raviola1986; Pang et al., Reference Pang, Abd-El-Barr, Gao, Bramblett, Paul and Wu2007; Murphy & Rieke, Reference Murphy and Rieke2008). Thus, although synaptic transmission between OFF cone bipolars and AIIs has been demonstrated electrophysiologically (Veruki et al., Reference Veruki, Mørkve and Hartveit2003), the relevance of such transmission during physiological responses to light is uncertain.
Selective network connections: OFF ganglion cells
The AII could, in theory, signal to the ON and OFF pathways exclusively via its contacts with bipolar cell terminals. The AII, however, also makes direct chemical synapses onto the dendrites of a few OFF ganglion cell types (Manookin et al., Reference Manookin, Beaudoin, Ernst, Flagel and Demb2008; Murphy & Rieke, Reference Murphy and Rieke2008; Münch et al., Reference Münch, da Silveira, Siegert, Viney, Awatramani and Roska2009; Anderson et al., Reference Anderson, Jones, Watt, Shaw, Yang, Demill, Lauritzen, Lin, Rapp, Mastronarde, Koshevoy, Grimm, Tasdizen, Whitaker and Marc2011). For example, OFF Alpha/Transient and OFF Delta/Sustained cells in both mouse and guinea pig appear to receive direct inputs from the AII because firing in scotopic conditions is driven primarily by the modulation of inhibitory glycinergic synapses (Murphy & Rieke, Reference Murphy and Rieke2006; Beaudoin et al., Reference Beaudoin, Manookin and Demb2008; Manookin et al., Reference Manookin, Beaudoin, Ernst, Flagel and Demb2008; van Wyk et al., Reference van Wyk, Wässle and Taylor2009).
Paired-cell recordings demonstrated directly a synapse between AIIs and OFF Alpha cells in the mouse (Murphy & Rieke, Reference Murphy and Rieke2008; Münch et al., Reference Münch, da Silveira, Siegert, Viney, Awatramani and Roska2009). In the guinea pig, pharmacological manipulations confirmed the role for the AII in modulating Alpha and Delta cell responses (Manookin et al., Reference Manookin, Beaudoin, Ernst, Flagel and Demb2008; Beaudoin & Demb, unpublished observations). In cat, EM analysis showed that both OFF Alpha and Beta cells receive direct AII input, and for Alpha cells, the number of AII contacts about equaled the number of OFF cone bipolar contacts (Kolb & Nelson, Reference Kolb and Nelson1993; Owczarzak & Pourcho, Reference Owczarzak and Pourcho1999). Similar contacts with a select number of ganglion cells were also observed in rabbit (Strettoi et al., Reference Strettoi, Raviola and Dacheux1992; Anderson et al., Reference Anderson, Jones, Watt, Shaw, Yang, Demill, Lauritzen, Lin, Rapp, Mastronarde, Koshevoy, Grimm, Tasdizen, Whitaker and Marc2011) and rat (Chun et al., Reference Chun, Han, Chung and Wässle1993).
The AII contributes to network function under photopic conditions
Under photopic conditions, when RB signaling is saturated, light stimulation of cones depolarizes ON cone bipolar cells, which then can depolarize coupled AIIs. The direction of signaling (ON cone bipolar→AII; Fig. 4B) is reversed relative to that under scotopic conditions (AII→ON cone bipolar; Fig. 1). Thus, depolarization of the AII under photopic conditions should not require a conventional ionotropic glutamate receptor (iGluR; i.e., AMPA, kainate, or NMDA channel), in contrast to all other known circuits in the retina. Indeed, photopic AII light responses persist in the presence of iGluR antagonists that block the conventional retinal pathways (Xin & Bloomfield, Reference Xin and Bloomfield1999; Trexler et al., Reference Trexler, Li and Massey2005; Pang et al., Reference Pang, Abd-El-Barr, Gao, Bramblett, Paul and Wu2007). Furthermore, AII inhibition of OFF ganglion cells (Alpha, Beta, and Delta types) persists in bright light in the absence of iGluR function through the following circuit: cone→ON cone bipolar→AII amacrine→OFF ganglion cell (Fig. 4B) (Cohen, Reference Cohen1998; Cohen & Miller, Reference Cohen and Miller1999; Beaudoin et al., Reference Beaudoin, Manookin and Demb2008; Manookin et al., Reference Manookin, Beaudoin, Ernst, Flagel and Demb2008; Münch et al., Reference Münch, da Silveira, Siegert, Viney, Awatramani and Roska2009). These results show that the ON cone bipolar–AII gap junction functions in bright light allowing AII cells to contribute to vision under photopic conditions.
Computational role in photopic vision
In the ON pathway, the functioning gap junction between ON cone bipolar cells and AIIs should degrade spatial acuity in bright light (Mills & Massey, Reference Mills and Massey1995). Since certain bipolar pathways show little or even no contact with the AII network (Fig. 4A), the impact of electrical coupling on spatial acuity should vary between parallel cone bipolar cell pathways.
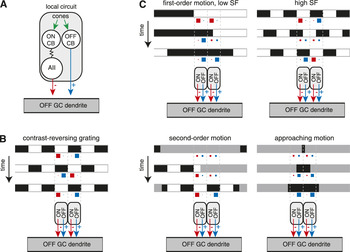
In the OFF pathway, the AII plays several roles in vision under photopic conditions. Tonic release of glycine by the AII helps to set the resting potential of both OFF bipolar and ganglion cells as well as the basal release rate of glutamate from OFF bipolar terminals (Zaghloul et al., Reference Zaghloul, Boahen and Demb2003; Margolis & Detwiler, Reference Margolis and Detwiler2007; Liang & Freed, Reference Liang and Freed2010). Glycinergic modulation of OFF bipolar terminals increases the operating range of glutamate release (Liang & Freed, Reference Liang and Freed2010). Additionally, certain OFF ganglion cell types integrate AII-mediated inhibition and OFF bipolar cell-mediated excitation (Fig. 5). Thus, the AII generates crossover inhibition from the ON pathway to the OFF pathway that competes with OFF pathway excitation. At light onset, the AII compensates for the rectifying OFF bipolar cell synapses by generating hyperpolarizing responses in the ganglion cell (Demb et al., Reference Demb, Zaghloul, Haarsma and Sterling2001a; Zaghloul et al., Reference Zaghloul, Boahen and Demb2003; Molnar et al., Reference Molnar, Hsueh, Roska and Werblin2009; Werblin, Reference Werblin2010). At light offset, tonic release of glycine from the AII is suppressed, and the resulting “disinhibition” of the ganglion cell combines with conventional excitation from OFF bipolar cells to extend the operating range for encoding negative contrasts (Manookin et al., Reference Manookin, Beaudoin, Ernst, Flagel and Demb2008). Thus, the AII signals to OFF bipolar terminals and OFF ganglion cells through both increases and decreases from a tonic level of glycine release.
Function of the AII in motion detection. (A) A local circuit is formed by an OFF cone bipolar cell paired with an ON cone bipolar cell that signals through the AII. Both the OFF bipolar and AII converge on the ganglion cell dendrite. This local circuit is summarized in parts (B) and (C) as an OFF pathway excitatory input (black arrow) paired with an ON pathway inhibitory input (red arrow). (B) Contrast-reversing grating: a high spatial frequency grating reverses contrast over time. Image frames are shown at three time points. The level of inhibition (red) and excitation (blue) in each of two local circuits is illustrated by the size of squares: larger squares represent higher release rates. On each frame, excitation in one region combines with inhibition in the neighboring region. The summed activity typically results in a burst of firing at each grating reversal showing that excitation dominates (see text). (C) First-order motion: a drifting grating is shown for both low and high spatial frequency (SF) stimuli. Bars move rightward and stimulate both OFF bipolar and AII amacrine cell release. At the low spatial frequency, excitation and inhibition alternate, whereas at the high spatial frequency, excitation and inhibition cooccur. In separate experiments (see text), the high spatial frequency stimulus generates either a net excitation or a cancellation at the ganglion cell level. Second-order motion: a stationary grating’s contrast is modulated by a moving contrast boundary. The OFF bipolar and AII cell are stimulated as the low contrast boundary moves rightward, revealing the underlying stationary grating. The combination of these inputs generates a modulation of membrane potential around rest and drives firing (see text). Approaching motion: a small dark stimulus expands over time. The stimulus drives increased release from OFF cone bipolars, while suppressing release from AIIs leading to high firing rates in the ganglion cell (see text).

There are two possible computational advantages to combining inhibition and excitation at the ganglion cell. First, the AII’s inhibition can compete with the OFF bipolar cell’s excitation at the scale of the ganglion cell’s wide dendritic tree (hundreds of microns). By contrast, AII inhibition of OFF bipolar cell terminals will have little effect if the adjacent OFF bipolars are not active (i.e., because the OFF bipolar cell release rate is commonly rectified and cannot be decreased below zero); therefore, AII inhibition at OFF bipolar terminals is limited to local interactions where simultaneous excitation and inhibition compete over a narrow spatial scale (i.e., tens of microns). Second, postsynaptic inhibition acts in the presence of high release rates from bipolar and amacrine cell terminals. The high release rates convey signals with high S/N to the ganglion cell (assuming release rates are governed by Poisson statistics). This contrasts with the presynaptic locus of inhibition (AII→OFF cone bipolar terminal), where the release onto the ganglion cell is only excitatory and is suppressed in the presence of inhibition, resulting in signals with low S/N.
The competition between OFF pathway bipolar cell-mediated excitation and ON pathway AII-mediated inhibition tunes the OFF ganglion cell response to different forms of motion. A drifting grating represents first-order motion, defined by spatiotemporal changes in luminance. A low spatial frequency grating will alternately stimulate OFF pathway excitation when dark bars pass over OFF bipolar cells and ON pathway inhibition when light bars pass over ON bipolar cells and their coupled AII amacrine cells (Fig. 5C). A high spatial frequency grating will simultaneously excite both OFF excitatory and ON inhibitory inputs. This simultaneous stimulation of the two pathways leads, in some cases, to a tonic elevation in firing when the excitatory inputs are relatively stronger (Cleland et al., Reference Cleland, Dubin and Levick1971; Manookin & Demb, Reference Manookin and Demb2006). Likewise, a contrast-reversing grating activates both pathways simultaneously, but the excitation dominates, resulting in a burst of firing at each contrast reversal (Fig. 5B) (Hochstein and Shapley, Reference Hochstein and Shapley1976; Demb et al., Reference Demb, Zaghloul, Haarsma and Sterling2001a). Thus, in these cases, the AII-mediated inhibition attenuates the effect of excitation, preventing excessive depolarization, but does not cancel it. The recordings mentioned above were made in cat or guinea pig cells. In the mouse retina, however, the response to a drifting high spatial frequency grating showed that the AII and OFF bipolar inputs canceled one another and the ganglion cell did not fire (Münch et al., Reference Münch, da Silveira, Siegert, Viney, Awatramani and Roska2009). Thus, the combined OFF bipolar/AII circuit has the potential to cancel responses selectively at high spatial frequencies. The degree of cancellation may depend on certain stimulus conditions (i.e., level of light adaptation) or may differ between species.
A second-order motion stimulus is defined by spatiotemporal changes in contrast (Fig. 5C). As a low contrast window moves and reveals a stationary high contrast grating pattern, the combined OFF excitatory and ON inhibitory inputs modulate the membrane potential around rest, driving bursts of firing (Demb et al., Reference Demb, Zaghloul and Sterling2001b; Rosenberg et al., Reference Rosenberg, Husson and Issa2010) (the source of inhibition in the earlier study was not identified as the AII, but we now understand this to be the case; Manookin et al., Reference Manookin, Beaudoin, Ernst, Flagel and Demb2008). Finally, an expanding dark stimulus yields a strong response in OFF Alpha ganglion cells because local OFF bipolar cells are excited as AII cells are simultaneously suppressed (Münch et al., Reference Münch, da Silveira, Siegert, Viney, Awatramani and Roska2009) (Fig. 5C). It has been proposed that this response to approaching motion might be important for certain behaviors (e.g., avoiding an approaching back-lit object or predator).
Concluding remarks
The existence of gap junction-mediated coupling between AIIs is well established, as is the modulation of this coupling by ambient light and DA. However, it is not immediately apparent why coupling between AIIs is necessary for ganglion cell processing of rod signals. Because AIIs are coupled to ON cone bipolar terminals, rod signals arising in the AIIs’ dendrites will be integrated by the ganglion cells postsynaptic to the ON cone bipolar terminals even if AIIs are not coupled to each other. The AII–ON cone bipolar cell gap junctions would serve to filter noise, and the voltage-gated Ca channels in the bipolar cell terminals would amplify rod signals nonlinearly. Similarly, OFF ganglion and bipolar cells postsynaptic to AIIs will receive glycinergic input even in the absence of AII–AII coupling, and chemical synaptic transmission is an inherently nonlinear process owing to the dependence of exocytosis on two nonlinear processes: voltage-dependent Ca channel gating and Ca2+ activation of the vesicular release machinery. To fully appreciate the roles of these processes, we need to better understand the dynamics of transmission at the AII’s glycinergic synapses. Furthermore, it is possible that there are undiscovered advantages to having two sites of coupling that could be modulated independently.
Additionally, the primary site of noise reduction in the RB pathway occurs upstream of the AII, at the rod→RB synapse (Dunn et al., Reference Dunn, Doan, Sampath and Rieke2006). A postsynaptic thresholding mechanism arising from saturation in the second messenger cascade linking glutamate receptor activation with membrane conductance serves to eliminate the majority of rod noise from RB cell signals (van Rossum & Smith, Reference van Rossum and Smith1998; Field & Rieke, Reference Field and Rieke2002; Sampath & Rieke, Reference Sampath and Rieke2004). Indeed, noise measured in AIIs is actually much greater than that in RB cells (Dunn et al., Reference Dunn, Doan, Sampath and Rieke2006). This noise arises at the RB→AII synapse, which operates at high gain (Dunn et al., Reference Dunn, Doan, Sampath and Rieke2006), likely owing to the high release probability of vesicles (Singer et al., Reference Singer, Lassova, Vardi and Diamond2004; Jarsky et al., Reference Jarsky, Tian and Singer2010). Thus, noise is a consequence of this high gain. Both the gain and noise in ganglion cell responses match that of the AIIs and are four to six times that which would arise from noiseless summation of rod output in the RB pathway. Hence, the noise in ganglion cell responses is apparently inherited from noise in AIIs (Dunn et al., Reference Dunn, Doan, Sampath and Rieke2006). This noise in the ganglion cells might be even higher if AIIs were uncoupled.
It will be informative to determine whether the pattern of AII synapses, investigated by EM, can predict the function of parallel pathways during night vision. We might then understand why certain ganglion cell types are more sensitive than others under scotopic conditions (Purpura et al., 1988; Lee et al., Reference Lee, Smith, Pokorny and Kremers1997; Deans et al., Reference Deans, Völgyi, Goodenough, Bloomfield and Paul2002; Völgyi et al., Reference Völgyi, Deans, Paul and Bloomfield2004). Understanding the role of AII cells in specific perceptions and behaviors will ultimately require methods for reversibly inactivating these cells. For example, one could test whether avoidance of approaching dark stimuli is lost following inactivation of AII cells (Münch et al., Reference Münch, da Silveira, Siegert, Viney, Awatramani and Roska2009). There are several types of narrow-field glycinergic amacrine cell other than the AII (Wässle et al., Reference Wässle, Heinze, Ivanova, Majumdar, Weiss, Harvey and Haverkamp2009), and so it will be interesting to learn whether there is enough redundancy in retinal circuitry such that certain behaviors survive inactivation of single amacrine cell types.
Acknowledgments
We thank Drs. F. Rieke and R. Smith for discussions and Drs. A.P. Sampath and R. Smith for providing data illustrated in Figure 2. Work in our laboratories is supported by NIH grants EY-014454 (JBD), EY-017836 (JHS) and EY-021372 (JBD and JHS) and by an unrestricted grant from Research to Prevent Blindness to the Department of Ophthalmology at Northwestern University (JHS).