Introduction
In vitro maturation (IVM) of oocytes refers to the removal of immature oocytes from the antral follicles and completing the final phase of meiosis in vitro. Generally, the quality and developmental potential of oocytes matured in vitro are inferior to those of oocytes matured in vivo; this phenomenon is presumably attributed to the intricate oocyte maturation process and suboptimal IVM environment (Lonergan and Fair, Reference Lonergan and Fair2008). Previous studies have indicated that the IVM of oocytes and the in vitro culture (IVC) of embryos generated excessive amounts of reactive oxygen species (ROS) when performed under atmospheric O2 (approximately 20%) (Kasterstein et al., Reference Kasterstein, Strassburger, Komarovsky, Bern, Komsky, Raziel, Friedler and Ron-El2013; Alvarez et al., Reference Alvarez, Morado, Soto, Dalvit and Cetica2015; Khazaei and Aghaz, Reference Khazaei and Aghaz2017). High levels of ROS might induce a cascade of chain reactions by reacting with nucleic acids, proteins, lipids, and carbohydrates, ultimately compromising the viability of embryos (Park et al., Reference Park, Cho and Yu2014; Lu et al., Reference Lu, Wang, Cao, Chen and Dong2018). As the physiological oxygen concentrations of the follicle and genital tract vary between 2% and 8%, some in vitro studies proposed to adopt a 5% or even lower O2 levels (Morin, Reference Morin2017; De Munck et al., Reference De Munck, Janssens, Segers, Tournaye, Van de Velde and Verheyen2019).
Investigations into the impacts of oxygen concentrations on IVM and IVC have been carried out on humans (Kirkegaard et al., Reference Kirkegaard, Hindkjaer and Ingerslev2013), bovines (Gaspar et al., Reference Gaspar, Arnold, Correa, da Rocha, Penteado, Del Collado, Vantini, Garcia and Lopes2015), sheep (Bernardi et al., Reference Bernardi, Flechon and Delouis1996), pigs (Kang et al., Reference Kang, Atikuzzaman, Kwon, Park, Kim, Moon, Koo, Jang and Lee2012), and mice (Kelley and Gardner, Reference Kelley and Gardner2016), for example. Some results have suggested that reducing the oxygen concentration was beneficial, whereas other results have indicated that lower oxygen levels had no obvious benefits (Agung et al., Reference Agung, Piao, Fuchimoto, Senbon, Onishi, Otoi and Nagai2010; Peng et al., Reference Peng, Shi, Jin, Yao, Wang, Yang, Song and Sun2015; Khurana and Niemann, Reference Khurana and Niemann2000). This inconsistency might be attributed to the different culture procedures utilized by different laboratories.
The yak (Bos grunniens) is one of a few domestic animals that can adapt well to life at high altitudes, and have been providing basic resources for Tibetans and other high-altitude nomadic pastoralists throughout history (Qiu et al., Reference Qiu, Zhang, Ma, Qian, Wang, Ye, Cao, Hu, Kim, Larkin, Auvil, Capitanu, Ma, Lewin, Qian, Lang, Zhou, Wang, Wang, Xia, Liao, Pan, Lu, Hou, Wang, Zang, Yin, Ma, Zhang, Wang, Zhang, Zhang, Yonezawa, Hasegawa, Zhong, Liu, Zhang, Huang, Zhang, Long, Yang, Wang, Lenstra, Cooper, Wu, Wang, Shi, Wang and Liu2012; Wiener et al., Reference Wiener, Han and Long2003). However, yaks are often prone to embryo mortality during early pregnancy that may be attributed to their reproductive physiologies (such as smaller ovary and fewer follicles, delayed puberty, seasonal oestrus) and/or malnutrition (Wiener et al., Reference Wiener, Han and Long2003). Research regarding yak follicular development, yak oocyte maturation and the IVC of yak embryos remain scarce, and underlying mechanisms for the low reproduction performance of yak remain unclear (Xiong et al., Reference Xiong, Li, Wang, Zhong, Zi and Wang2014).
Oxygen plays an important role in oocyte maturation process, but it remains unclear whether oxygen concentrations affect the quality of yak oocytes. In the present study, yak oocytes were matured under different oxygen concentrations (5% versus 20%) and the developmental competence, ROS levels, glutathione (GSH) content and transcriptomic profile of these two groups of oocytes were determined to investigate the effects of different oxygen concentrations on the quality of yak oocytes and the underlying mechanisms.
Materials and methods
Chemicals
All chemicals used in this study were purchased from Sigma-Aldrich (St. Louis, MO, USA) unless otherwise indicated.
Oocyte recovery and IVM
Yak ovaries were collected from a local abattoir and transported to the laboratory in physical saline solution (0.9% NaCl) within 2 h of collection. Cumulus–oocyte complexes (COCs) were aspirated from follicles of 2–8 mm in diameter using a 10-ml syringe with an 18-gauge needle, and only those with at least three layers of compact cumulus cells and a homogeneous ooplasm were selected for IVM.
After washing three times in TL-HEPES buffer containing 3 mg/ml albumin from bovine serum (BSA), COCs were randomly allocated into two groups and cultured in TCM-199 medium (Gibco) supplemented with 10% (v/v) fetal bovine serum (FBS) (Gibco), 1 μg/ml 17β-estradiol, and 0.5 μg/ml follicle-stimulating hormone for 22 h at 38.5°C under either low (5%) or high (20%) oxygen concentrations. Two Tri-gas CO2 incubators were used in this experiment and subsequent IVC, one incubator was set as 5% O2, 5% CO2 and 90% N2, humidified and another as 20% O2, 5% CO2, and 75% N2, humidified.
Examination of oocyte maturation
Denuded oocytes were obtained by pipetting COCs in Dulbecco’s phosphate-buffered saline (DPBS) supplemented with 0.1% hyaluronidase, and only oocytes with a first polar body extrusion were regarded as mature (metaphase II oocytes) and used for subsequent experiments. First polar body extrusion was validated by staining with 4′,6-diamidino-2-phenylindole (DAPI) in DPBS supplemented with 0.1% (w/v) polyvinyl alcohol (PVA) under ultraviolet light. The nuclear maturation rate was defined as the ratio of mature oocytes to the total oocytes used for IVM.
In vitro fertilization (IVF) and IVC of embryos
After IVM, COCs were partially denuded, washed twice in Brackett and Oliphant medium (BO) and a group of 20 COCs were transferred to a 50-µl droplet of BO supplemented with 20 mg/ml BSA, 20 μg/ml heparin and 100 μg/ml gentamicin. Subsequently, one straw of yak frozen semen was thawed in 37°C water bath. The sperm was collected by density gradient centrifugation at 700 g for 15 min, washed twice in BO at 200 g for 5 min and adjusted to a concentration of 5 × 10⁶/ml. A 50-µl aliquot of sperm suspension was added to above-mentioned BO droplet to reach a final sperm density of 2.5 × 10⁶/ml for insemination. After 18 h, putative zygotes were divided into two groups for in vitro culture.
For in vitro embryo culture, each group of putative zygotes was further divided into two groups in 5% O2 or 20% O2, resulting in four subgroups in total (M5C5: 5% O2 matured and 5% O2 cultured; M5C20: 5% O2 matured and 20% O2 cultured; M20C5: 20% O2 matured and 5% O2 cultured; M20C20: 20% O2 matured and 20% O2 cultured.). Putative zygotes were cultured in Charles Rosenkrans medium with amino acids (CR1aa) supplemented with 0.3% (w/v) BSA for 48 h, and cleaved embryos were transferred to CR1aa medium supplemented with 10% FBS for 5 days at 38.5°C. Cleavage rate and blastocyst formation rate were examined at 48 and 168 h of IVC, respectively.
Apoptosis assay and cell number count of embryos
Apoptosis assays were performed using a terminal deoxynucleotidyl transferase (TUNEL) assay kit (Beyotime, Shanghai, China) according to the manufacturer’s instructions. Briefly, fixed embryos were washed in DPBS three times and incubated with TUNEL assay buffer for 60 min at 37°C. Subsequently, embryos were rinsed in DPBS twice and stained with DAPI for 5 min. After rinsing in DPBS three times, the embryos were mounted onto a glass slide under a coverslip and examined under a fluorescence microscope. The number of apoptotic cells and the total cells were calculated using ImageJ software (Version 1.52; National Institutes of Health, Bethesda, MD, USA).
Analysis of ROS and GSH in oocytes
Intracellular ROS levels were examined using a ROS Assay Kit (Beyotime, Shanghai, China). Briefly, 10 oocytes were washed twice in serum-free TCM-199 medium, transferred to a working solution and incubated for 20 min at 37℃. After incubation, the oocytes were washed three times with DPBS containing 0.1% (w/v) PVA and then examined under a fluorescence microscope (Olympus, Tokyo, Japan). The system parameters of image acquisition were kept the same for all replicates, and the fluorescence intensities were analyzed using ImageJ software.
The GSH content in metaphase II (MII) oocytes was measured using an enzyme-linked immunosorbent assay kit (Jining, Shanghai, China). Briefly, 10 μl of oocyte extract (from a pool of 30 oocytes) was mixed with 40 μl of diluent buffer. The mixture was added to one reaction well and incubated for 30 min at 37°C. After washing five times, 50 µl of Conjugate Buffer was added to each well and incubated for 30 min at 37°C. Subsequently, 50 µl of Substrate A and 50 µl of Substrate B were added to each well after washing five times and incubated for 15 min at 37℃. Finally, 50 µl of Stop Solution was added to each well, and the optical density at 450 nm was immediately measured using a microplate reader. The GSH content was calculated by comparing the values with the standard curve values.
RNA sequencing and transcriptomic analysis
Sample preparation, RT-PCR and preamplification
A group of five fresh collected MII oocytes was treated in acidic Tyrode’s solution for 5 min to remove zona pellucida, washed three times in DPBS and no more than 1 μl DPBS was transferred to 2 μl lysis buffer. Three groups of oocytes matured under 20% oxygen concentration (H1, H2 and H3) and three groups of oocytes matured under 5% oxygen concentration (L1, L1 and L3) were lysed and submitted for RT-PCR and amplification using Smart-seq2 method (Picelli et al., Reference Picelli, Björklund, Faridani, Sagasser, Winberg and Sandberg2013). Briefly, oocyte lysates were mixed with 1 μl oligo-dT primer and 1 μl dNTP mix, denatured at 72°C for 3 min and immediately placed on ice. To each sample was added 5 μl first-strand reaction mix. Reaction program was 42°C for 90 min, 10 cycles of (50°C for 2 min and 42°C for 2 min), and 70°C for 15 min. After first-strand cDNA synthesis, each sample was mixed with 40 μl PCR master mix and the PCR preamplification program was 98°C for 3 min, 18 cycles of (98°C 15 s, 67°C 20 s, 72°C 6 min), and 72°C for 5 min. PCR product was purified using AMPure XP beads (Beckman Coulter, USA), eluted with EB solution (Qiagen, Germany) and then checked for the size distribution with Fragment Analyzer (Agilent, USA).
Library construction and sequencing
Library construction was performed using a KAPA KK8504 Hyper Prep Kit (Roche, Swiss) according to the manufacturer’s instructions. The resulting DNA library was purified AMPure XP beads and quantified using a Qubit (Thermo Fisher, USA). High-throughput sequencing was performed using the Illumina HiSeq 2000 platform to generate 150-bp paired-end reads.
Data analysis
After base calling from original image data, raw reads were cleaned by discarding adaptors and low-quality reads using fastp 0.20.0 (Chen et al., Reference Chen, Zhou, Chen and Gu2018). Clean reads were mapped onto the yak reference genome BosGru_v2.0 using HISAT 2.1.0 (Kim et al., Reference Kim, Langmead and Salzberg2015). Gene expression levels were calculated using RSEM v1.3.1 (Li and Dewey, Reference Li and Dewey2011) and EBSeq 1.24.0 (Leng et al., Reference Leng, Dawson, Thomson, Ruotti, Rissman, Smits, Haag, Gould, Stewart and Kendziorski2013). Differentially expressed genes (DEGs) were identified with the cutoff of fold change > 1.5 and false discovery rate (FDR) < 0.05. Gene enrichment analysis was performed by annotating DEGs with Gene Ontology (GO) and Kyoto Encyclopaedia of Genes and Genomes (KEGG) terms with the Database for Annotation, Visualization and Integrated Discovery (DAVID) v.6.8 (Huang et al., Reference Huang, Sherman and Lempicki2009a, Reference Huang, Sherman and Lempicki2009b), and all the visualization of transcriptomic analysis results was performed with the R package ggplot2 (v3.2.0, https://ggplot2.tidyverse.org).
Validation of DEGs
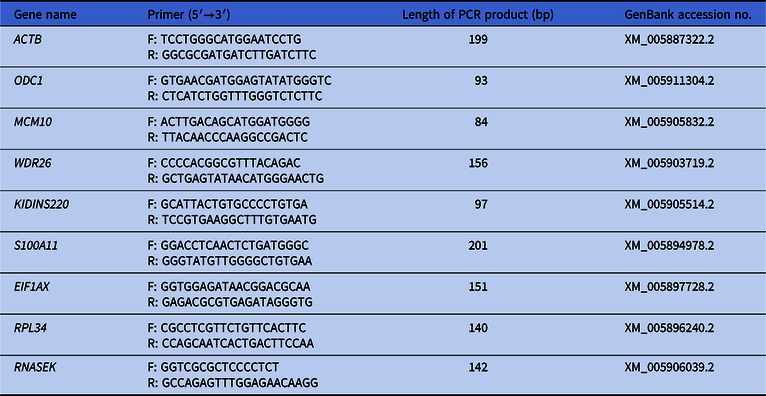
DEGs were validated using RT-qPCR. Total RNA was extracted from a pool of 30 fresh oocytes using the RNeasy Micro Kit (QIAGEN, Germany) according to the manufacturer’s instructions. First-strand cDNA was reverse transcribed from 1 μg of total RNA using the PrimeScript RT Reagent Kit with gDNA Eraser (TaKaRa, Japan) with a program of 37°C 15 min and 85°C 5 s. Quantitative PCR was performed on a Rotor-Gene Q system (QIAGEN, Germany) with a program of 95°C 30 s, 40 cycles of (95°C 5 s and 60°C 30 s), followed by a melting curve plotting phase. The housekeeping gene actin beta (ACTB) was dedicated as a reference gene, and the comparative Ct (2-ΔΔCt) method was used for data analysis. The primers used for each gene are listed in Table 1.
List of primers used for RT-qPCR

ACTB, actin beta; ODC1, ornithine decarboxylase 1; MCM10, minichromosome maintenance 10 replication initiation factor; WDR26, WD repeat domain 26; KIDINS220, kinase D interacting substrate 220; S100A11, S100 calcium binding protein A11; EIF1AX, eukaryotic translation initiation factor 1A X-linked; RPL34, ribosomal protein L34; RNASEK, ribonuclease K.
Statistical analysis
Each experiment was replicated at least three times, and the results were presented as the mean ± standard deviation. Data were analyzed using the R software (v3.6.1, https://www.R-project.org/). The maturation rate, cleavage rate and blastocyst formation rate were analyzed using chi test, the ROS levels and GSH content were analyzed using t-test and the other data were analyzed using one-way analysis of variance followed by Duncan’s test. Differences among the treatments were considered statistically significant when the P-values were < 0.05.
Results
Effects of oxygen concentrations on the maturation of yak oocytes
In total, 1953 oocytes were used to examine the effects of different oxygen concentrations (5% vs 20%) on oocyte maturation during IVM. The first polar body extrusion rate of the 5% oxygen concentration was significantly higher than that of the 20% oxygen concentration (81.2 ± 2.2% vs 75.9 ± 1. 3%, P < 0.05; Table 2).
Effects of oxygen concentrations on the maturation and development of yak embryos

IVM: in vitro maturation. IVC: in vitro culture.
In the IVM and IVC column, 5% and 20% indicate the oxygen concentrations for each group.
The cell number of blastocysts was calculated by counting the number of nuclei using DAPI.
The number of apoptotic cells was examined using a TUNEL assay.
Experiments were replicated five times and the data are shown as the mean ± standard deviation.
a,b Values with different superscripts are significantly different between groups (P < 0.05).
Effects of oxygen concentrations on the development of yak IVF embryos
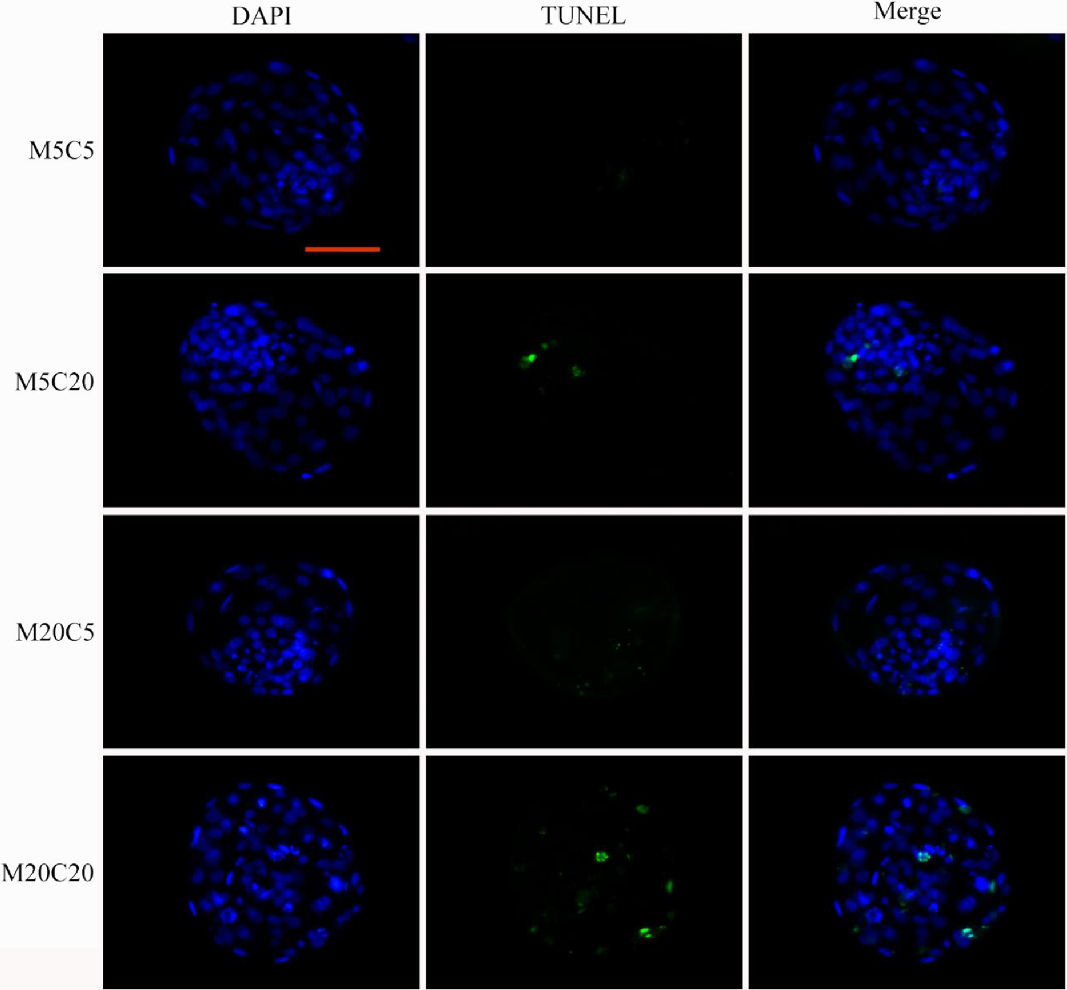
Each group of putative zygotes was subdivided into two groups for further culture under 5% or 20% oxygen concentration. Therefore, there were four types of embryos in total. Table 2 summarizes the cleavage, blastocyst formation, blastocyst cell number and apoptotic cell number per blastocyst of each group. Figure 1 shows the nuclear and TUNEL staining of blastocysts.
Representative images of the nuclear and TUNEL staining of yak blastocysts. Cell nuclei were stained blue (DAPI), and apoptotic cells were stained green (TUNEL). Scale bar, 100 μm. Experiments were performed five times. For each experiment, 8–12 blastocysts were stained per group.

The cleavage rate was higher in groups matured at 5% oxygen concentration (71.9 ± 3.7% for M5C5 and 70.2 ± 2.6% for M5C20 vs 62.1 ± 1.4% for M20C5 and 61.1 ± 2.8% for M20C20, P < 0.05, Table 2). The blastocyst formation rate was higher in groups cultured at 5% oxygen concentration, but the difference was not statistically significant (35.1 ± 3.8% for M5C5 and 34.1 ± 3.4% for M20C5 vs 31.7 ± 2.4% for M5C20 and 30.6 ± 3.9% for M20C20, P > 0.05, Table 2). The total cell number per blastocyst was significantly higher in the groups cultured under 5% oxygen concentration than in the groups cultured under 20% oxygen concentration (96.4 ± 6.6 for M5C5 and 95.8 ± 7.4 for M20C5 vs 90.7 ± 7.2 for M5C20 and 88.8 ± 7.3 for M20C0, P < 0.05, Table 2). Moreover, the embryos cultured under 5% oxygen concentration yielded lesser number of apoptotic cells per blastocyst (7.1 ± 1.3 for M5C5 and 7.4 ± 1.7 for M20C5 vs 8.6 ± 2.1 for M5C20 and 8.5 ± 2.4 for M20C20, P < 0.05, Table 2).
Effects of oxygen concentrations on ROS levels and GSH content in yak oocytes
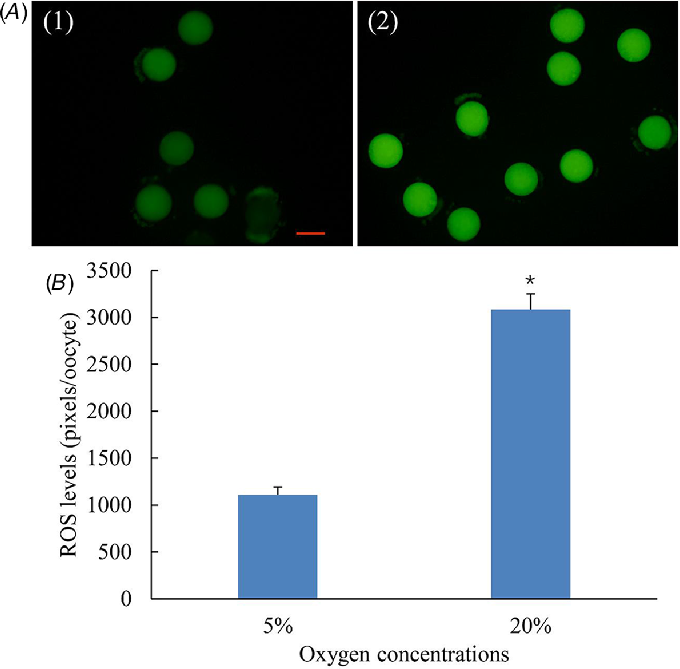
As shown in Fig. 2, the ROS levels were much higher in oocytes matured at 20% oxygen concentration than in oocytes matured at 5% oxygen concentration (P < 0.05), indicating that more ROS were generated at a higher oxygen concentration.
Effects of different oxygen concentrations on the ROS levels of oocytes. (A) Representative images of the reactive oxygen species (ROS) staining of oocytes matured at 5% oxygen (A1) and 20% oxygen (A2). Scale bar, 100 μm. (B) ROS levels of oocytes matured at 5% and 20% oxygen. Experiments were performed three times. For each experiment, 10–12 oocytes were used per group. Values with an asterisk (*) indicate significant difference between the two groups (P < 0.05).
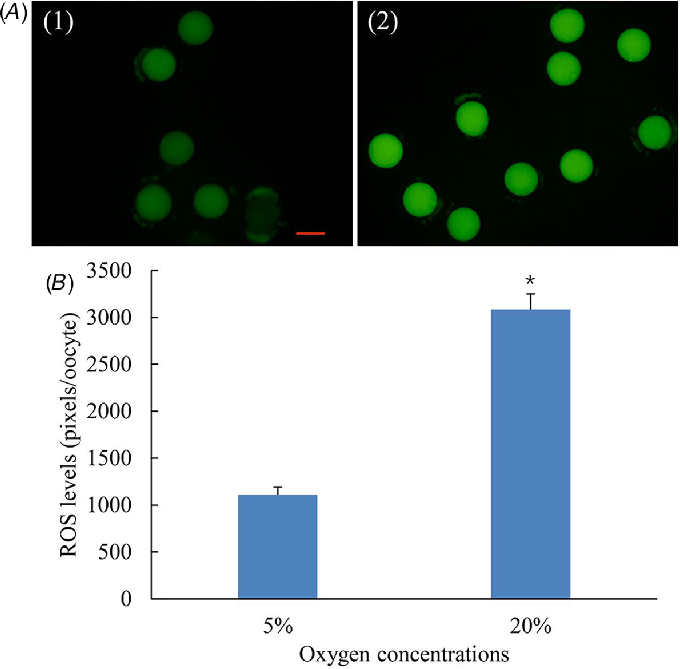
GSH plays an important role in preventing damage to cellular components caused by ROS. We measured the GSH content of yak oocytes and the results showed the GSH content of oocytes matured at 5% oxygen concentration was significantly higher than oocytes matured at 20% oxygen concentration (75.05 ± 7.1 ng/oocyte vs 50.63 ± 5.6 ng/oocyte, P < 0.05).
RNA sequencing results
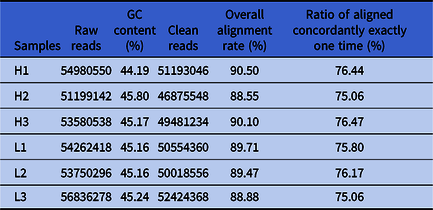
Six cDNA library of yak oocytes were constructed. The sequencing and mapping results were summarized in Table 3. For each library, 51,199,142–56,836,278 raw reads were generated. After removing adapter sequence and low-quality reads, 46,875,548–52,424,368 clean reads were obtained for each sample. Clean reads were mapped onto the yak reference genome BosGru_v2.0. Overall alignment rate ranged from 88.55% to 90.50% and the ratio of reads aligned concordantly exactly one time ranged from 75.06% to 76.47%. The sequencing data were deposited in NCBI with accession number PRJNA561051 and all the genes expressed were listed in supplementary file.
Sequencing and mapping results
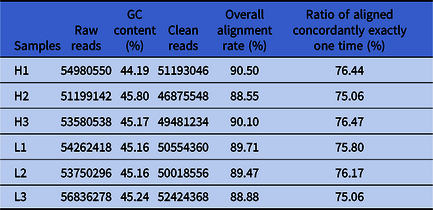
H1, H2 and H3 were oocytes matured at 20% oxygen concentration. L1, L2 and L3 were oocytes matured at 5% oxygen concentration.
Differentially expressed genes analysis
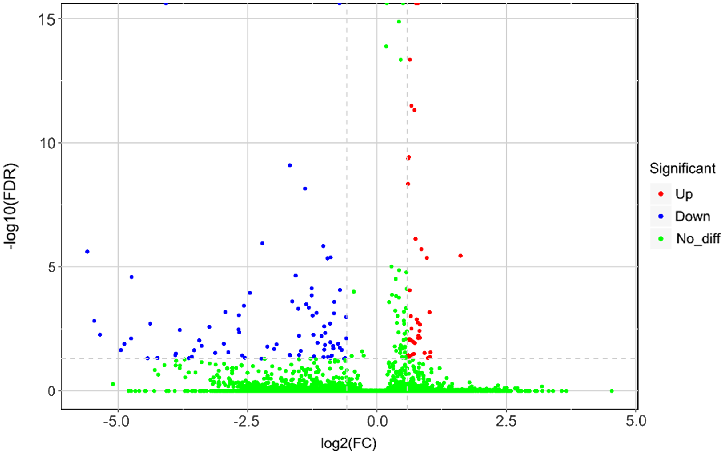
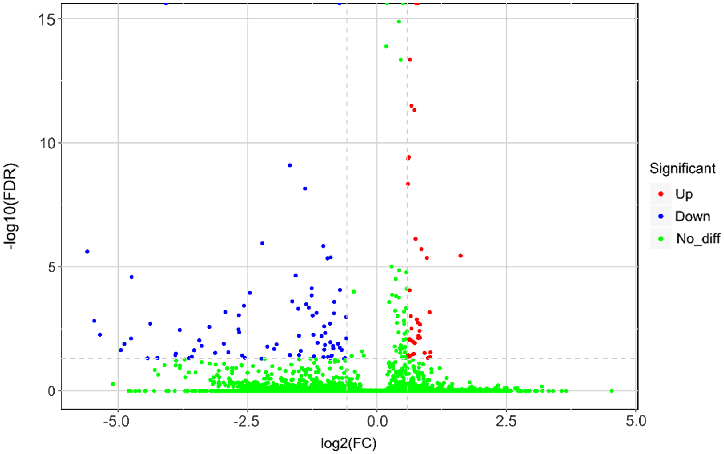
In total, 120 DEGs were identified, among which 37 genes were upregulated and 83 genes downregulated in the 5% oxygen concentration group compared with the 20% oxygen concentration group. A volcano plot illustrated the fold change and false discovery rate of all expressed genes (Fig. 3).
Volcano plot of all the expressed genes. Red dots represent the upregulated genes and the blue dots represent the downregulated genes in 5% oxygen concentration. Green dots represent the genes not significantly different between the two groups.
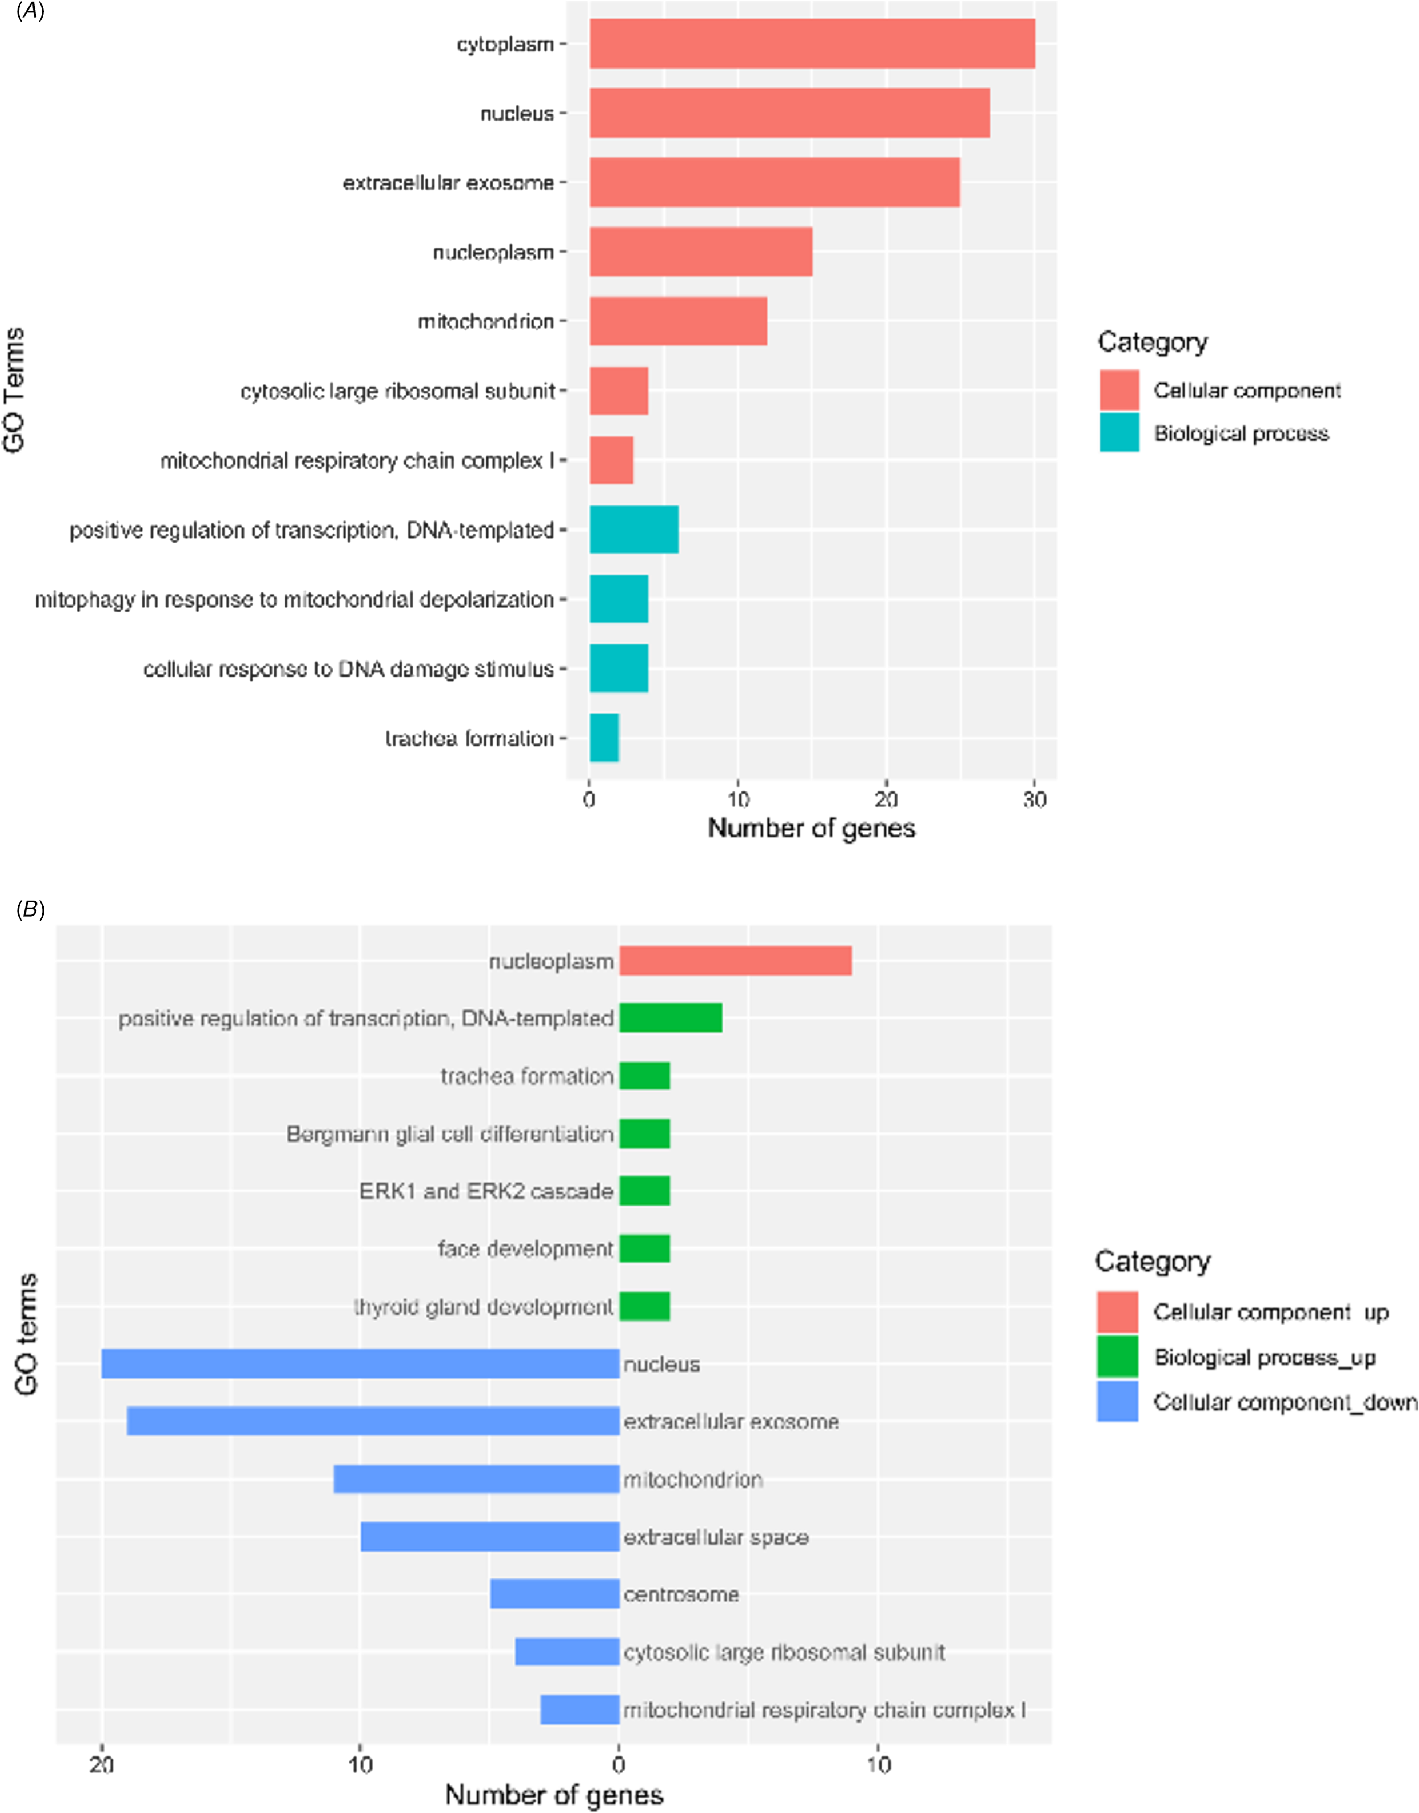
The DEGs were submitted to DAVID 6.8 for gene enrichment analysis. The upregulated and downregulated genes were also separately submitted to explore the differences of gene enrichment between the two sets of genes. GO analysis indicated there were seven terms enriched in the cellular component category (cytoplasm, nucleus, extracellular exosome, nucleoplasm, cytosolic large ribosomal subunit and mitochondrial respiratory chain complex I) and four terms enriched in the biological process category (positive regulation of transcription DNA-templated, mitophagy in response to mitochondrial depolarization, cellular response to DNA damage stimulus and trachea formation) (Fig. 4A). The upregulated genes were enriched in cellular component category of nucleoplasm and six biological processes (positive regulation of transcription DNA-templated, trachea formation, Bergmann glial cell differentiation, ERK1 and ERK2 cascade, face development and thyroid gland development), and the downregulated genes were enriched in seven cellular component categories (nucleus, extracellular exosome, mitochondrion, extracellular space, centrosome, cytosolic large ribosomal subunit and mitochondrial respiratory chain complex I) (Fig. 4B).
Gene ontology enrichment of all the differentially expressed genes (DEGs) (A) and up and downregulated DEGs (B).

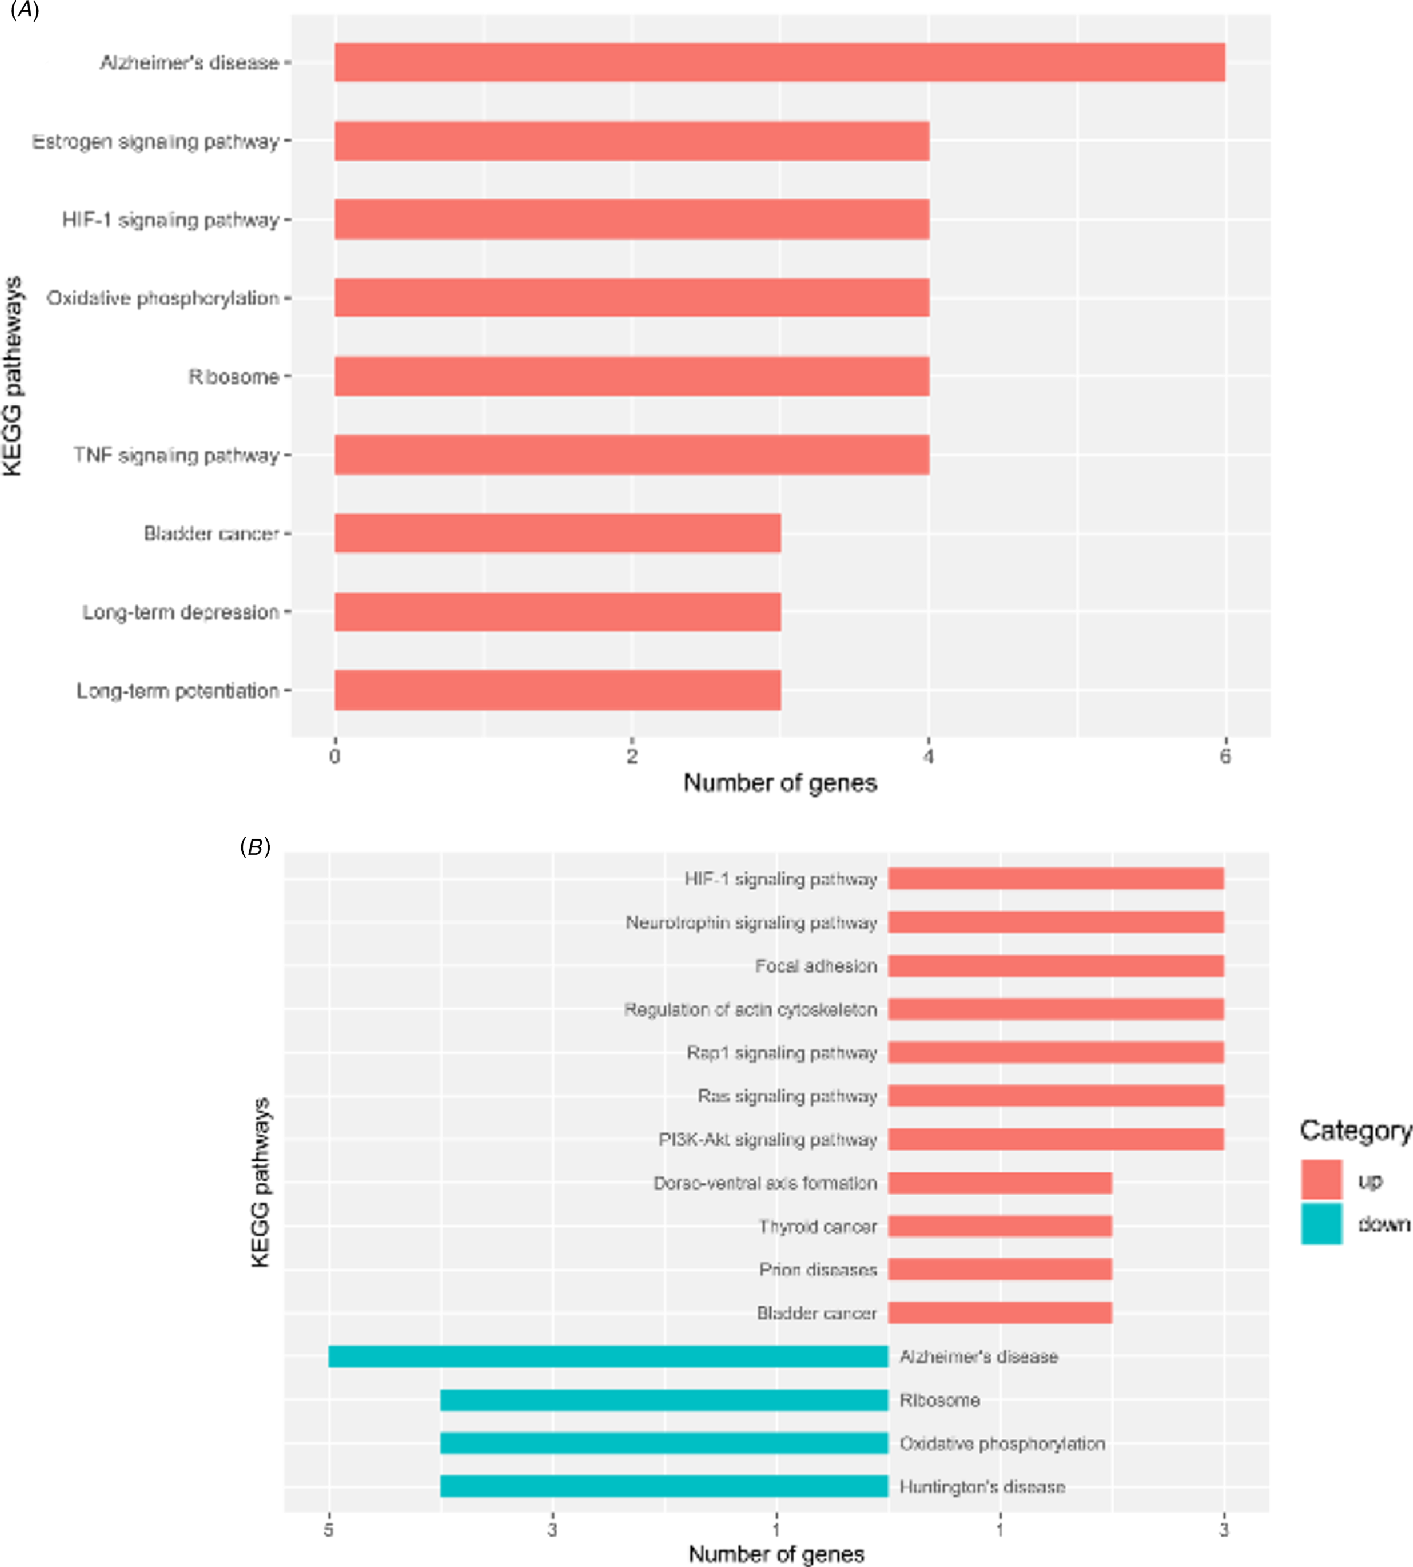
KEGG analysis of all the DEGs indicated that the DEGs were enriched in nine pathways (top five pathways: Alzheimer’s disease, oestrogen signalling, HIF-1 signalling, oxidative phosphorylation and ribosome) (Fig. 5A). The upregulated genes were enriched in 11 pathways (top seven pathways: HIF-1 signalling, neurotrophin signalling, focal adhesion, regulation of actin cytoskeleton, Rap1 signalling, Ras signalling and PI3K-Akt signalling), and the downregulated genes were enriched in four pathways (Alzheimer’s disease, ribosome, oxidative phosphorylation and Huntington’s disease) (Fig. 5B).
KEGG pathway analysis of all the differentially expressed genes (DEGs) (A) and up and downregulated DEGs (B).

RT-qPCR validation of DEGs
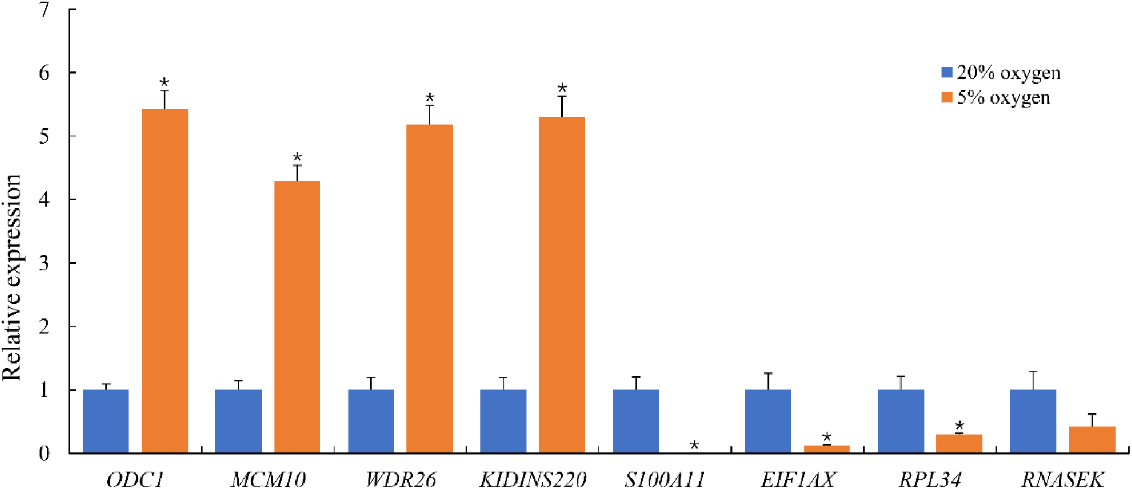
Eight DEGs (four upregulated and four downregulated) were selected to validate the results of transcriptome sequencing. The RT-qPCR results were in accordance with the transcriptome sequencing results (Fig. 6), and therefore validated the accuracy of the sequencing results.
Validation of differentially expressed genes (DEGs) by RT-qPCR. Transcript levels in oocytes matured under 20% oxygen concentration were calibrated as a reference (relative expression level = 1.0). Experiments were performed three times. For each gene, an asterisk (*) indicates significant difference between the two groups (P < 0.05).

Discussion
Through the maturation process, oocytes grow dramatically in size, reorganize subcellular organelles, and stockpile mRNAs, proteins and metabolic molecules required for subsequent fertilization and embryo development (Sirard et al., Reference Sirard, Richard, Blondin and Robert2006; Brevini et al., Reference Brevini, Cillo, Antonini, Tosetti and Gandolfi2007). Owing to the complexity of the oocyte maturation process and suboptimal culture systems, oocytes matured in vitro usually have a disrupted metabolism and stress pathways compared with those in their in vivo counterparts (Del Collado et al., Reference Del Collado, da Silveira, Oliveira, Alves, Simas, Godoy, Coelho, Marques, Carriero, Nogueira, Eberlin, Silva, Meirelles and Perecin2017). Oxygen concentration is an important factor affecting oocyte quality and embryo development. Although much effort has been made to elucidate the effects of different oxygen concentrations on oocyte quality and developmental competence, experimental results conflict among laboratories (Agung et al., Reference Agung, Piao, Fuchimoto, Senbon, Onishi, Otoi and Nagai2010; Kang et al., Reference Kang, Atikuzzaman, Kwon, Park, Kim, Moon, Koo, Jang and Lee2012; Kasterstein et al., Reference Kasterstein, Strassburger, Komarovsky, Bern, Komsky, Raziel, Friedler and Ron-El2013). The yak, the only species of the genus Poephagusis of the subfamily Bovidae, possesses special reproductive attributes such as seasonal oestrus, shorter uterus body, smaller ovary, fewer follicles per ovary and a few morphology differences of oocytes compared with cattle (Wiener et al., Reference Wiener, Han and Long2003; Yu et al., Reference Yu, Yong and Cui2010). To the author’s knowledge, there has been no report on whether oxygen concentrations affects the quality of yak oocytes to date. Therefore, in this study, we investigated the effects of different oxygen concentrations on the developmental competence, ROS levels, GSH content and transcriptome profiles of yak oocytes. The results showed that a low oxygen concentration significantly enhanced the maturation rate and increased the quality of yak IVF embryos, indicating that a low oxygen concentration is beneficial for the IVM of yak oocytes and in vitro culture of yak embryos.
To assess the effects of different oxygen concentrations on the developmental competence of yak oocytes, we calculated the maturation rate of yak oocytes and the cleavage rate, blastocyst formation rate, total cell number and apoptotic cell number in blastocysts of yak IVF embryos. Previous studies have shown that low oxygen promoted cell cycle completion (Yuan et al., Reference Yuan, Van Soom, Coopman, Mintiens, Boerjan, Van Zeveren, de Kruif and Peelman2003; Kubisch and Johnson, Reference Kubisch and Johnson2007). Consistently, in the present study, the results showed that 5% oxygen concentration increased the nuclear maturation rate of yak oocytes, indicating low oxygen may facilitate the meiosis of yak oocytes. Early embryo development is driven by maternal mRNA and proteins stockpiled during the oocyte maturation process (Tadros and Lipshitz, Reference Tadros and Lipshitz2009). As embryo development proceeds, the maternal substances gradually degrade and embryonic genome activation (EGA) occurs (Misirlioglu et al., Reference Misirlioglu, Page, Sagirkaya, Kaya, Parrish, First and Memili2006). Previous studies have indicated low oxygen tension improved cleavage rate, blastocyst formation rate, blastocyst cell number and implantation ability (Bagheri et al., Reference Bagheri, Kazemi, Sarmadi, Shamsara, Hashemi, Daliri Joupari and Dashtizad2018; García-Martínez et al., Reference García-Martínez, Sánchez Hurtado, Gutiérrez, Sánchez Margallo, Romar, Latorre, Coy and López Albors2018; Kaser et al., Reference Kaser, Bogale, Sarda, Farland, Williams and Racowsky2018). Consistently, our results showed that the cleavage rate was higher in groups cultured at low oxygen concentration, suggesting that a low oxygen concentration might have beneficial effects on meiosis and/or IVF. Blastocyst formation rate, total cell number and apoptotic cell number are important criteria in assessing embryo quality. In the present study, lower oxygen concentration increased the cell number per blastocyst and decreased blastocyst cell apoptosis, suggesting that low oxygen concentration was beneficial for yak embryo development. However, the blastocyst formation rate did not show statistical difference among the groups, which may be due to the complex nature of IVC, which is an orchestration of embryo developmental potential, in vitro culture medium, in vitro culture methods and embryo-embryo interactions (Sunde et al., Reference Sunde, Brison, Dumoulin, Harper, Lundin, Magli, Van den Abbeel and Veiga2016; Reader et al., Reference Reader, Stanton and Juengel2017; Wang et al., Reference Wang, Yu, Liu, Li, Liu, Wang, Liu, Miao, Du and Yang2018b; Lee et al., Reference Lee, Oh, Kim, Kim, Choi, Jo, Setyawan and Lee2018).
Under normal physiological conditions, ROS and antioxidants remain in equilibrium to ensure cellular homeostasis. ROS are beneficial for oocyte maturation and embryogenesis when at physiological levels (Prasad et al., Reference Prasad, Tiwari, Pandey, Shrivastav and Chaube2016). However, an excessive amount of ROS generated in the process of in vitro embryo production might result in oxidative stress, cell cycle arrest, apoptosis, maturation promoting factor destabilization and decreased embryo development (Guerin et al., Reference Guerin, El Mouatassim and Menezo2001; Pandey et al., Reference Pandey, Tripathi, Premkumar, Shrivastav and Chaube2010; Tiwari et al., Reference Tiwari, Prasad, Tripathi, Pandey, Singh, Shrivastav and Chaube2016). Specifically, ROS can interact with GSH and convert it into an oxidized state, therefore depleting the oocyte’s GSH pool (Eichenlaub-Ritter et al., Reference Eichenlaub-Ritter, Wieczorek, Luke and Seidel2011). In the present study, we examined the effects of different oxygen concentrations on ROS levels and GSH content, and the results demonstrated that oocytes matured at low oxygen concentration had decreased levels of ROS and retained more GSH, therefore providing a more suitable re-dox homeostasis for oocyte maturation.
To further investigate the mechanisms of different oxygen concentrations on yak oocyte quality, we also analyzed the transcriptome profiles of oocytes matured at different oxygen concentrations. We identified 120 DEGs between the two groups, among which 37 genes were upregulated and 83 genes downregulated in the 5% oxygen concentration group compared with the 20% oxygen group. The upregulated genes were enriched in GO terms of nucleoplasm, positive regulation of transcription, DNA-templated, and ERK1 and ERK2 cascade, and were enriched in the KEGG pathways of HIF-1 signalling, regulation of actin cytoskeleton, Rap1 signalling, Ras signalling, and PI3K-Akt signalling. The downregulated genes were enriched in GO terms of nucleus, extracellular exosome, mitochondrion, extracellular space, centrosome, cytosolic large ribosomal subunit and mitochondrial respiratory chain complex Ⅰ, and were enriched in KEGG pathways of ribosome and oxidative phosphorylation. Hypoxia-inducible factor 1 (HIF-1) is induced in response to low oxygen concentration and regulates oxygen homeostasis (Ziello et al., Reference Ziello, Jovin and Huang2007). Extracellular signal-regulated kinases 1/2 (ERK1/2) promotes the secretion of EGF-like factors and regulates cell cycle progression, meiotic resumption and cumulus cell expansion (Shimada et al., Reference Shimada, Umehara and Hoshino2016). Ras and Ras-related protein 1 (Rap1) belong to the Ras superfamily and regulate oocyte maturation (Chung et al., Reference Chung, Brandt-Rauf, Weinstein, Nishimura, Yamaizumi, Murphy and Pincus1992; Wang et al., Reference Wang, Geng, Han, Luo and Zhang2018a). Phosphatidylinositol kinase-3 (PI3K) and Akt (also known as protein kinase B, PKB) regulate cell growth and cell cycle progression through transmitting upstream signals from follicle-stimulating hormone receptors (Jiang et al., Reference Jiang, Dias and He2014), KIT (also known as proto-oncogene c-Kit or CD117) (Clarke, Reference Clarke2017) and epidermal growth factor receptor (EGF) (Shimada et al., Reference Shimada, Umehara and Hoshino2016). Actin cytoskeleton is involved in chromosome segregation, polar body extrusion, spindle migration, and actin-dependent long-range vesicle transport (Uraji et al., Reference Uraji, Scheffler and Schuh2018). In summary, it can be inferred that low oxygen concentration improved the quality of yak oocytes through promoting cell cycle related signalling and decreasing oxidative phosphorylation. Moreover, it is generally believed that as the oocytes resume meiosis, their transcription activities are gradually ceased and not fully activated until the EGA stage (Memili et al., Reference Memili, Dominko and First1998; De La Fuente et al., Reference De La Fuente, Viveiros, Burns, Adashi, Matzuk and Eppig2004). Our results indicated, however, even though at the absence of active transcription, the transcript levels of the oocytes were dynamically regulated in response to environmental alterations.
In addition, oxygen concentrations might have an effect on the epigenetic reprogramming of oocytes and preimplantation embryos. For example, a recent study reported a significant difference of 5-methylcytosine between maternal pronuclei of bovine oocytes matured at 5% and 20% oxygen (Bennemann et al., Reference Bennemann, Grothmann and Wrenzycki2018). However, literature on the relationship between oxygen tension and epigenetic status are scarce and their long-term sequences still needs to be further investigated. What is more, it must be mentioned that the actual dissolved oxygen concentration during IVM and IVC is generally lower than that in the incubator as the solubility of oxygen is poor in the culture medium (Bennemann et al., Reference Bennemann, Grothmann and Wrenzycki2018; Talevi et al., Reference Talevi, Sudhakaran, Barbato, Merolla, Braun, Di Nardo, Costanzo, Ferraro, Iannantuoni, Catapano and Gualtieri2018). The dissolved oxygen concentration is also affected by multiple factors such as the volume of the drop of culture medium, the amount of mineral oil applied, and the culture procedures (Sciorio and Smith, Reference Sciorio and Smith2019). Therefore, all these factors must be considered in interpreting future experimental results.
In conclusion, our study indicated a low oxygen concentration improved the developmental competence of yak oocytes by reducing the ROS levels, increasing the GSH content, and modulating the gene expressions.
Supplementary material
To view supplementary material for this article, please visit https://doi.org/10.1017/S0967199420000337
Financial support
This study was supported by the Basic Scientific Independent Research Project of Qinghai Academy of Animal Science and Veterinary Medicine (#MKY-2019–07), the International Scientific and Technological Cooperation Project of Ministry of Science and Technology of the People’s Republic of China (#2013DFA31420) and the Basic Research Project of Qinghai Provincial Science & Technology Department (#2015-ZJ-712).
Conflicts of interest
The authors declare no conflicts of interest.
Ethics statements
The authors declare that all experiments performed in this study were approved by the Animal Care and Use Committee of Gansu Agricultural University.