I. INTRODUCTION
TiO2 films attract attention because of their interesting chemical, electrical, and optical properties, which find applications, particularly in photocatalysis and dye-sensitized solar cells.Reference Chen and Mao1 Thin films made by sol–gel methods, combined with supramolecular templating, usually show some degree of mesoporosity, cracks, reduced optical transparency, and low density. The dye-sensitized solar cells, also called Graetzel cells, utilize nanostructured TiO2 film on electrically conductive substrates.Reference O’Regan and Grätzel2–Reference Hagfeldt, Boschloo, Sun, Kloo and Pettersson4 In these cells, a dye is adsorbed on the photoanode, which is usually a combination of thin dense TiO2 underlayer contacting the current collector, and a mesoporous TiO2 network on the top of it.Reference O’Regan and Grätzel2−Reference Hagfeldt, Boschloo, Sun, Kloo and Pettersson4 The blocking underlayers, made either by electrodepositionReference Kavan, O’Regan, Kay and Grätzel5 or spray pyrolysis,Reference Kavan and Grätzel6, Reference Cameron, Peter and Hore7 enhance the cell performance by impeding the back electron transfer from photoexcited dye. This issue is particularly important for solid-state solar cells.Reference Grätzel3, Reference Bach, Lupo, Comte, Moser, Weissortel, Salbeck, Spreitzer and Grätzel8–Reference Burke, Ito, Snaith, Bach, Kwiatkowski and Grätzel10
Dense TiO2 layers are often considered as an antireflection coating, with abrasion and wear protection function in respect of various materials.Reference Chen and Mao1 Major obstruction in preparation of dense thin TiO2 films is the poor adhesion of TiO2 nanoparticles to the substrate. Physical and chemical vapor deposition and aerosol pyrolysis are common methods to deposit dense TiO2 layers on various substrates without the need of binders.Reference Chen and Mao1, Reference Kavan and Grätzel6 Even when binders are used, sol–gel methods provide almost exclusively mesoporous structures instead of dense layers. Each organic additive introduced into the sol–gel precursor has a specific effect on the structure of the gel and the final solid TiO2 film. In certain cases, highly organized mesoporous layers are fabricated by supramolecular templating, e.g., by Pluronic block copolymersReference Prochazka, Kavan, Zukalova, Frank, Kalbac, Zukal, Klementova, Carbonne and Grätzel11, Reference Prochazka, Kavan, Shklover, Zukalova, Frank, Kalbac, Zukal, Pelouchova, Janda, Mocek, Klementova and Carbonne12 and similar species.Reference Crossland, Nedelcu, Ducati, Ludwigs, Hillmyer, Steiner and Snaith13, Reference Crossland, Kamperman, Nedelcu, Ducati, Wiesner, Smilgies, Toombbes, Hillmyer, Ludwigs, Steiner and Snaith14 In this article, we show that poly(hexafluorobutyl methacrylate), used as an organic additive in the precursor sol for dip coating, produces very dense TiO2 layers at the conditions that are normally used for making mesoporous layers. Our strategy represents simple method to grow dense TiO2 coatings with good homogeneity at low cost.
II. EXPERIMENTAL SECTION
A. Materials
The TiO2 dense films were grown from a liquid precursor made as follows: Solution 1 was prepared by addition of 10.2 mL HCl (37%, Aldrich, St. Louis, MO) to 14.4 g of titanium ethoxide (Aldrich). In some cases the precursor was modified by addition of 0.48 mL of 85% phosphoric acid (H3PO4) (0.3% P on TiO2 basis) to the concentrated HCl. Separately, solution 2 was prepared from 5.0 g of poly(hexafluorobutyl methacrylate) (A-1-02 fluoropolymer; Advanced Materials-JTJ, Kamenné Žehrovice, Czech Republic) dissolved in 56 mL of 1-butanol (Aldrich). Solutions 1 and 2 were mixed under vigorous stirring, 1 mL of acetone was added to this mixture, and it was heated to 40 °C at stirring for 2 h. The films were deposited on different substrates at room temperature via dip coating at withdrawal rate of 0.8 mm/s. As-deposited films were calcined at 350 °C in air leaving TiO2 coating on the substrate. Thicker multilayer films were manufactured by repeating the deposition procedure. Finally, the as-grown films were fired at 400–550 °C for 1–8 h. In some cases, the Si-supported films were optionally fired at 900 °C for 2 h. The used supports were: ordinary glass microscope slides, F-doped SnO2 (FTO) slides from Libbey–Owens–Fords (Toledo, OH), 15 Ohm/sq, and p-type crystalline silicon wafers (Solartec, Rožnov pod Radhoštěm, Czech Republic) with either polished (111) surface or textured (111) surface. Silicon wafers with polished surface were grown by Czochralski method. They were first oxidized (dry SiO2 conditions, temperature 900 °C), and then the SiO2 layer was etched away in hydrofluoric acid (HF) solution. In some cases, titania films were deposited on nonetched SiO2/Si wafers, too. Silicon wafers with textured surface were fabricated via alkaline texturing of (100) oriented wafers grown by a floating zone method. The etching was carried out by NaOH in isopropanol/H2O at 75 °C, which produces pyramidal morphology of the surface with (111) oriented pyramidal faces.
As alternative to poly(hexafluorobutyl methacrylate) in solution 2, the following organic additives were tested as well: methyl methacrylate (Fluka, Buchs, Switzerland), 1:1 vol. mixture of poly(hexafluorobutyl methacrylate) with poly(allyl 2-methyl acrylate) (Advanced Materials-JTJ, CZ), 1-methyl-3-octylimidazolium chloride (Fluka), Pluronic P123 (Aldrich),Reference Prochazka, Kavan, Zukalova, Frank, Kalbac, Zukal, Klementova, Carbonne and Grätzel11, Reference Prochazka, Kavan, Shklover, Zukalova, Frank, Kalbac, Zukal, Pelouchova, Janda, Mocek, Klementova and Carbonne12 and a series of ionic liquids: 1-butyl-3-methyl imidazolium chloride; butyl-methyl imidazolium acetate; butyl-methyl imidazolium trifluoroacetate, 1H,1H,2H,2H-perfluoro-decyl-1-methyl imidazolium iodide; and 1H,1H,2H,2H-perfluoro-decyl-1-methyl imidazolium bis(trifluoromethane) sulfonamide. The former three ionic liquids were provided by Solvionic (Toulouse, France), and latter two ionic liquids were synthesized according to procedures described in Ref. Reference Singh, Manandhar and Shreeve15.
B. Characterization methods
Scanning electron microscopy (SEM) images were acquired on Hitachi FE SEM S-4800 microscope (Hitachi, Tokyo, Japan). Atomic force microscopic (AFM) images were measured using multimode Nanoscope IIIa (Veeco, Plainview, NY). The film thickness was determined by profilometer (Dektak 150, Veeco) or by SEM. Adsorption isotherms of krypton (Kr) at 77 K were studied with a Micromeritics ASAP 2020 instrument (Micromeritics, Norcross, GA). Optical transmission and reflectance spectra were measured on glass-supported films using a Perkin Elmer Lambda 19 UV-VIS-NIR spectrophotometer (Waltham, MA) equipped with an integration sphere. Reflectance spectra of Si-supported films were measured on Perkin Elmer Lambda 45 spectrophotometer for an incidence angle of 6°. A spectroscopic phase modulated Jobin Yvon UVISEL ellipsometer (Chilly Mazarin, France) was used to measure the spectral dependences of the associated ellipsometric parameters for five incidence angles at intervals overall within 55–75°. The spectral dependences of the optical constants of the thin film, i.e., the refractive index n and extinction coefficient k, were determined using a combined method based on simultaneous treatment of the experimental data obtained by the variable angle of incidence spectroscopic ellipsometry (VASE) and near-normal incidence spectroscopic reflectometry (NNISR). Raman spectra were excited by He–Ne laser (633 nm) and recorded by a Labram HR spectrometer (Horiba Jobin Yvon) interfaced to an Olympus microscope (objective 50x). The spectrometer was calibrated by the F1g mode of Si at 520.2 cm−1. X-ray diffraction (XRD) was studied on a Bruker D8 Advance diffractometer (Bruker, Ettlingen, Germany) using Cu Kα radiation.
Grazing incidence small angle x-ray scattering (GISAXS) measurements were performed at the ID1 unit of the Grenoble ESRF facility using 10 keV beam. The GISAX analysis used procedures, which have been described in our previous papers.Reference Prochazka, Kavan, Zukalova, Frank, Kalbac, Zukal, Klementova, Carbonne and Grätzel11, Reference Prochazka, Kavan, Shklover, Zukalova, Frank, Kalbac, Zukal, Pelouchova, Janda, Mocek, Klementova and Carbonne12 Position-sensitive detector (PSD) was placed along the direction perpendicular to the sample surface, so that during GISAXS acquisition a Q x–Q z map could be acquired in one scan, or the intensity integrated on the whole detector (about 2°). The GISAXS scans are shown in Q space according to the relations:
 $$Q_{\rm{X}} \, = \,2{\rm{\pi }}\sin \Theta /{\rm{\lambda }}\,\,{\rm{and}}\,\,Q_{\rm{Z}} \, = \,2{\rm{\pi }}\sin \Theta _{{\rm{PSD}}} /{\rm{\lambda }}{\rm{.}}$$
λ is the radiation wave length (1.2397 Å), Θ is the diffraction angle, and ΘPSD is the angle along the PSD detector. In this way it is straightforward to calculate the average particle distance:
 $$D\,{\rm{ = }}\,{\rm{2\pi /}}Q_{{\rm{max}}} ,$$
where Q max is the position of the first ordering peak in Q x. Relative density of the film was determined from the critical angle values of the reflectivity scans. Exclusion method was used to associate the peaks on the GISAXS scans with the particle size values and different types of pore sizes.
Electrochemical lithium insertion was studied by cyclic voltammetry using the Autolab PGSTAT 30 (Ecochemie) potentiostat controlled by the Nova software. The reference and auxiliary electrodes were Li metal. The potentials are referred to the Li/Li+ (1 M) reference electrode. The electrolyte solution was 1 M lithium bis(trifluoromethanesulfonimide) [LiN(CF3SO2)2] + ethylene carbonate/dimethoxyethane (1/1 by volume). All operations were carried out under argon in a glove box.
III. RESULTS AND DISCUSSION
A. Structure and optical spectra of dense films on glass
Polymeric additivesReference Chen and Mao1, Reference Prochazka, Kavan, Zukalova, Frank, Kalbac, Zukal, Klementova, Carbonne and Grätzel11–Reference Crossland, Kamperman, Nedelcu, Ducati, Wiesner, Smilgies, Toombbes, Hillmyer, Ludwigs, Steiner and Snaith14, Reference Zukalova, Zukal, Kavan, Nazeeruddin, Liska and Grätzel16, Reference Zukalova, Prochazka, Zukal, Yum, Kavan and Grätzel17 or ionic liquidsReference Wessel, Zhao, Urban, Ostermann, Djerdj, Smarsly, Chen, Hu and Sallard18 introduced into the Ti-precursor sol for dip coating have specific structure-directing action on the subsequently formed gel and the final TiO2 products, influencing their porosity, morphology, and crystal phase. Complete densification of the final titanium dioxide film was not expected, but our screening of various templates (see Sec. II) pointed at poly(hexafluorobutyl methacrylate) as an exceptional case. This polymeric additive produced dense TiO2 films on glass, FTO, or Si. Concentrated hydrochloric acid (HCl) or alkali hydroxides caused no apparent changes in the coated samples at room temperature, but hot concentrated sulfuric acid (H2SO4) or sodium hydroxide (NaOH) slowly etched the surface of the TiO2 film. The film thickness was roughly proportional to the number of layers starting from approximately 40–60 nm for one-layer film. Here, the term “layer” is used for a product of one single dip-coating procedure; the term “film” is reserved for a product of one or several consecutive dip-coating events followed by calcination, see Sec. II for details. Despite small thickness, even one-layer film had a dark gray metallic appearance (Fig. S1 in Supporting Information) and electrically insulated the FTO substrate underneath.
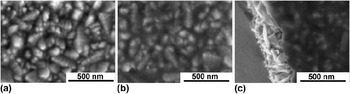
Figure 1 shows scanning electron microscopy (SEM) images of one-layer TiO2 film on top of FTO. There is an apparent difference in image contrast if we compare the bare FTO support [Fig. 1(a)] and that covered with a thin titania film (b, c). The crystals of FTO are visible under the crust of TiO2 dense layer [Fig. 1(b)]. The contrast between the TiO2-coated FTO and the bare FTO is obvious on the SEM image in Fig. 1(c) which shows the edge of mechanically broken sample with naked FTO particles (left side of the image) and compact titania film on top of FTO (right side of the image). TiO2 film perfectly fills the voids between FTO crystals and also covers the top of the crystals. This indicates exceptional thixotropy of the precursor (see Sec. III. C for further discussion).
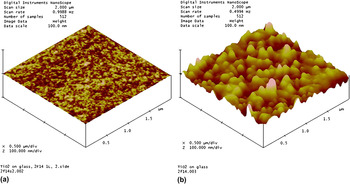
The AFM images of the same TiO2 layer are shown in Fig. 2. The layer on glass [Fig. 2(a)] indicates the surface roughness below 2 nm, which is similar to the surface relief of blank glass. Films deposited on FTO [Fig. 2(b)] expectedly show larger surface corrugation due to roughness of the bare FTO substrate [see Fig. 1(a)].
Scanning electron microscopy images of (a) bare FTO substrate and that covered by of the dense TiO2 layer (b and c). The chart (b) is a top view and the chart (c) is open cut.

AFM images of dense TiO2 layer on (a) glass; (b) FTO.

Kr adsorption isotherms of glass-supported films at 77 K were evaluated by Brunauer-Emmett-Teller (BET) method. This procedure is suitable for determination of roughness factor (r.f.), which is the ratio of BET-surface area versus the projected geometric area.Reference Prochazka, Kavan, Shklover, Zukalova, Frank, Kalbac, Zukal, Pelouchova, Janda, Mocek, Klementova and Carbonne12, Reference Zukalova, Zukal, Kavan, Nazeeruddin, Liska and Grätzel16 However, trials to measure the r.f. (BET-specific surface area) of our dense films failed even for those approximately 1.5 μm in thickness. This is in striking contrast to TiO2 films grown by the same dip-coating procedure, but templated, e.g., by Pluronic P123, which exhibited roughness factors of several hundred depending on the film thickness.Reference Prochazka, Kavan, Shklover, Zukalova, Frank, Kalbac, Zukal, Pelouchova, Janda, Mocek, Klementova and Carbonne12, Reference Zukalova, Zukal, Kavan, Nazeeruddin, Liska and Grätzel16 For instance, the Pluronic P123 templated five-layer film with thickness of 1.3 μm exhibited the roughness factor of 429. The detection limit of our Kr adsorption method (see Sec. II) can be estimated to be about 20 in the r.f. units. Hence, our poly(hexafluorobutyl methacrylate)-templated thick film is without any measurable porosity at r.f. <≈20, which confirms its exceptionally dense packing.
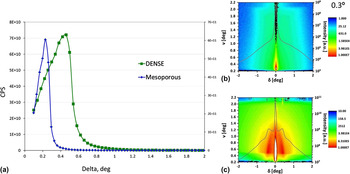
The scattering of synchrotron radiation was studied on our dense films and, for comparison, on porous films templated by Pluronic P123.Reference Prochazka, Kavan, Zukalova, Frank, Kalbac, Zukal, Klementova, Carbonne and Grätzel11, Reference Prochazka, Kavan, Shklover, Zukalova, Frank, Kalbac, Zukal, Pelouchova, Janda, Mocek, Klementova and Carbonne12 Relative density of porous and dense films was determined from critical angles of GISAX reflectivity scans [Fig. 3(a)] and detector maps [Figs. 3(b) and 3(c)]. Although density of films can only be approximated from critical angle values, the shift of critical angle from delta 0.26 to 0.46 indicates considerable densification of poly(hexafluorobutyl methacrylate)-templated films (delta = 4θ). The GISAXS detector maps of the dense [see green line in Fig. 3(a)] and porous films [see blue line in Fig. 3(a)] are compared in the Figs. 3(b) and 3(c) for incident angle 0.3°. The dense layer indicated no other events than plain reflection [Fig. 3(b)]. In contrast, multiple events from scattering of particles and pores in the mesoporous TiO2 matrix are shown in Fig. 3(c). TiO2 particle size of 8 nm and several types of porosity were detected in the mesoporous films templated by Pluronic P123.Reference Prochazka, Kavan, Zukalova, Frank, Kalbac, Zukal, Klementova, Carbonne and Grätzel11, Reference Prochazka, Kavan, Shklover, Zukalova, Frank, Kalbac, Zukal, Pelouchova, Janda, Mocek, Klementova and Carbonne12
GISAX reflectivity scans (a) and detector maps (b, c) for dense TiO2 film (a, b) compared with parameters of mesoporous film templated by Pluronic P-123 (a, c).

Optical spectra of glass-supported 1- to 3-layer dense films are displayed in Fig. 4. The transmittance (T) and reflectance (R) spectra show complementary interferences. High contrast of interference fringes confirms good optical quality of our films on glass. The films reflect from 10% to 35% of visible to near-infrared (NIR) light, which is higher than that for blank glass reflecting less than 10% (Fig. 4). The interference fringes are almost eliminated if we plot the corresponding absorbance (A) spectrum calculated by the formula:
 $$A\, = \, - \log \,(T + R).$$
Optical transmission and reflectance spectra of multilayer dense TiO2 films deposited on glass showing complementary interferences; blank glass without TiO2 film (black), those with (i) one-layer film (yellow), (ii) 2-layers film (cyan), and (iii) 3-layers film (magenta). Inset shows the corresponding absorbance (A) spectra for wave lengths from 320 to 360 nm.
This is shown in inset of Fig. 4, where we can trace the onset of TiO2 band gap excitation (see Sec. III. D for further discussion).
B. Phase analysis of dense films
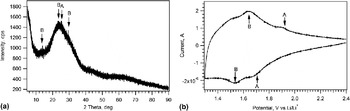
XRD pattern of our dense 5-layer film is shown in Fig. 5(a). It indicates that the film is virtually amorphous, exhibiting solely one broad diffraction peak around 25° (2 theta) where the strongest (101) line of TiO2 anatase is expected. There are also possible diffraction lines of monoclinic TiO2(B) in the same region of the diffractogram. This conclusion about apparent prevalence of amorphous film is supported also by Raman spectrum, which shows only two weak and noisy peaks at 148 and 640 cm−1 (Fig. S2, Supporting Information). Although these peaks are assignable to the two strongest Raman lines of TiO2 (anatase), Eg(1) and Eg(3), there is also a possible overlap with the lines of TiO2(B) which are located nearly in the same spectral region.Reference Zukalova, Kalbac, Kavan, Exnar and Grätzel19 Hence, the phase analysis of our dense film is not conclusive either by XRD or by Raman spectroscopy. The decisive method is electrochemical lithium (Li) insertion, which is known to possess exceptional sensitivity in this particular case.Reference Prochazka, Kavan, Shklover, Zukalova, Frank, Kalbac, Zukal, Pelouchova, Janda, Mocek, Klementova and Carbonne12, Reference Zukalova, Prochazka, Zukal, Yum, Kavan and Grätzel17, Reference Kavan, Bacsa, Tunckol, Serp, Zakeeruddin, Le Formal, Zukalova and Grätzel20–Reference Kavan22 Indeed, the cyclic voltammogram displayed in Fig. 5(b) confirms that both titania phases, viz. anatase and TiO2(B), are present in our dense film, but the broad envelope of background currents is suggestive of the apparent prevalence of amorphous titania.
Determination of the TiO2 phase in dense films. (a): X-ray diffractogram of 5-layer film on glass; arrows point at the diffraction angles where strong diffraction lines of anatase (A) and monoclinic titania (B) are expected. (b): Cyclic voltammogram of lithium insertion into 5-layer film on FTO; scan rate 0.1 mV/s. Arrows indicate the voltammetric peaks of anatase (A) and TiO2(B) (B).

C. Thixotropic properties of the precursor: Films grown on textured Si substrate
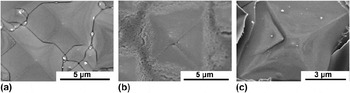
As discussed in Sec. III. A, our dense films make an almost ideal coating even on rough surfaces, which can be ascribed to the thixotropic properties of the precursor gel. This effect was further explored using textured surface of crystalline silicon. Alkaline anisotropic etching of (100)-oriented Si wafer produced textured Si surface with (111)-oriented pyramids, which is the usual procedure of activation of crystalline Si in photovoltaic applications. The dimensions of pyramid base are 3–15 μm and the pyramid angle is 70.5° [Fig. 6(a)]. To grow a reference porous film for comparison, this substrate was dip coated from a precursor sol containing Pluronic P-123. Figure 6(b) indicates that TiO2 is not spread evenly in the case of Pluronic-containing precursor sol. Tips of the pyramids were mostly uncovered and TiO2 accumulated at the pyramid bases in the form of aggregated particles with high degree of porosity [Fig. 6(b)]. In contrast, the poly(hexafluorobutyl methacrylate)-containing precursor provided a uniform and compact thin TiO2 film, perfectly copying the substrate surface [Fig. 6(c)]. No individual particles are noticeable in the dense film, but this is better visualized on flat Si surfaces (Sec. III. D).
SEM pictures of crystalline (111) Si-substrate etched (textured) for photovoltaic applications: (a) Blank Si-substrate; (b) Si-substrate dip coated from a Pluronic-P123 containing precursor sol. (c) Si-substrate dip coated from the poly(hexafluorobutyl methacrylate) containing precursor sol.

D. Dense TiO2 layer on flat Si (111) surface: Structure and optical properties
The dense films on crystalline Si are perfectly compact and uniform on textured surfaces (Sec. III. C) but the deposition on flat surface is a stipulated option for detailed optical studies. For this purpose, we grew thin dense TiO2 layer on polished crystalline Si (111) plane, either pure or covered with thermally made SiO2 (see Sec. II). Optical appearance of the double-layer stack (TiO2/SiO2/Si sample) was dark blue, in case of TiO2/Si sample the color was light brown.
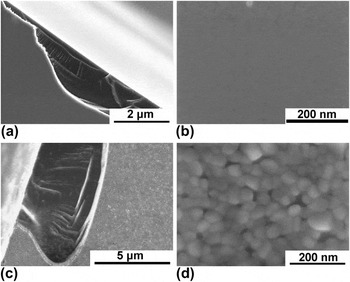
SEM images shown in Fig. 7 confirm that the as-grown dense coating on a plain Si(111) surface is almost ideally flat and free from any cracks or pores in the ≈ 2–10 nm scale [Fig. 7(b)]. Thanks to the high thermal stability of Si, we can investigate these films at higher temperatures than those accessible for glass- or FTO-supported films. Figures 7(c) and 7(d) show structural changes upon calcination at 900 °C for 2 h. There is pronounced crystallization to form grains of approximately 40 nm size [Fig. 7(d)]. We should note that these 40-nm grains very probably make just one single layer of particles on top of Si (111), because the parent “amorphous” TiO2 film [Figs. 7(a) and 7(b)] was of a similar thickness (see also Sec. III. D).
SEM pictures of dense TiO2 layer on polished crystalline silicon (111) face. Charts (a and b) show the films prepared by a standard synthetic protocol. The same films after calcination at 900 °C are shown in charts (c) and (d).

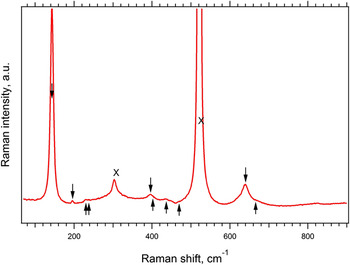
Crystals formed in dense films at 900 °C [see Figs. 7(c) and 7(d)] show apparent prevalence of anatase. This is demonstrated by a Raman spectrum shown in Fig. 8. The Raman spectrum is now much better resolved than the spectrum of the parent film on glass which was calcined at 450 °C only (Fig. S2 in Supporting Information). Also the monoclinic TiO2(B) phase, which was found in the parent film by electrochemical analysis (see Sec. III. B) still exists in these conditions. This is documented by several diagnostic lines of TiO2(B) shown in Fig. 8. On the other hand, there is no evidence for the presence of rutile, which would give rise to a strong line at 614 cm−1. It is surely surprising that anatase and even metastable TiO2(B) are not transformed to rutile at 900 °C, and we can merely speculate that dense packing of thin film and Si support, either alone or acting in concert with each other, are responsible for this behavior. The fact that a film is composed from just one layer of grains (see Fig. 7 and discussion thereof) may also play a role, because each crystal is contacting directly the Si(111) support. Our observation qualitatively agrees with Kim et al.Reference Kim, Hahn, Oh and Kim23 who reported that their thin film of TiO2 anatase (300 nm), made on Si support by sol–gel dip coating, too withstood 900 °C.
Raman spectra of TiO2 dense layer on silicon calcined at 900 °C for 2 h. The downward pointing arrows label the bands of anatase and the upward pointing arrows labels the bands of TiO2(B). Crosses (x) denote the lines of Si from the substrate.

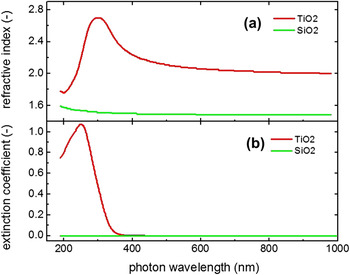
Optical properties of our standard dense films on plain Si(111) surface [calcined at 450 °C, see Figs. 7(a) and 7(b)] were characterized by spectroscopic ellipsometry and reflectometry both on pure flat Si (111) surface and that covered by thermal SiO2 layer. The optical parameters, namely refractive index, extinction coefficient, and reflectance of our dense films on crystalline Si qualify them for being used as antireflection coatings in photovoltaic applications. The corresponding requirements for an ideal antireflection coating on photovoltaic-quality silicon are: (i) zero extinction coefficient in the region of usable solar spectrum and (ii) the refractive index equal to geometric average of the indices of the surrounding environments, that is n film ≈ 2 for the interface of air and crystalline silicon, n Si ≈ 4. Figure 9 shows the ellipsometrically determined optical parameters. The refractive index [Fig. 9(a)] is approximately 20% smaller than that of anatase single crystal, n A ≈ 2.5 (at 589 nm),Reference Jang, Zakutayev, Stoweres, Anderson, Tate, McIntyre, Johnson and Keszler24 which is obviously due to amorphous nature of our film (Sec. III. B). This is also corroborated by the extinction coefficients [Fig. 9(b)] which indicate blue-shifted onset of optical absorption compared with that of crystalline anatase or TiO2(B), with band gap, E g ≈ 3.2 eV for both modificationsReference Chen and Mao1, Reference Yahia, Lemoigno, Beuvier, Filhol, Plouet, Brohan and Doublet25 (see also inset in Fig. 4). In our case, the plot for indirect band gap of titania:
 $$(khv)^{1/2} \,{\rm{versus}}\,hv{,}$$
Index of refraction (a) and extinction coefficient (b) of the SiO2 and TiO2 thin films grown on polished Si (111) substrates determined by spectroscopic ellipsometry.

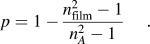
yields 3.4 eV (see Fig. S3 in Supporting Information). Small enhancement of the band gap is usually ascribed to size-quantification effect,Reference Kavan, Stoto, Grätzel, Fitzmaurice and Shklover26 but, sometimes, large shifts are reported even for nanocrystalline (≈10 nm sized) films made by sol–gel dip coating, particularly if the calcination temperature is lower.Reference Mechiakh, Ben Sedrine, Ben Naceur and Chtorou27 The refractive indices similar to those of ours (n film ≈ 2) were reported for porous thin films made on Si substrate by sol–gel dip coating but without organic templates.Reference Kim, Hahn, Oh and Kim23 They were discussed in terms of porosity, p according to equationReference Kim, Hahn, Oh and Kim23:
 $$p = 1 - {{n_{{\rm{film}}}^2 - 1} \over {n_A^2 - 1}}.$$
However this correlation might be misleading for amorphous films, such as in our case, where we observe n film ≈ 2.1 for a film, which is almost nonporous.
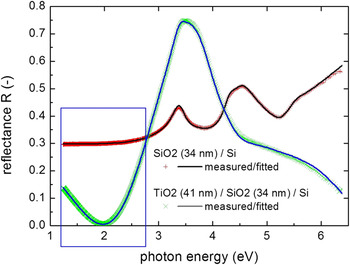
Figure 10 shows results from ellipsometry, confirming significantly lower optical reflectance after deposition of a dense TiO2 layer on the thermally oxidized silicon substrate in part of a solar spectrum that is important for photovoltaic application (rectangular selection on the graph). We may note that the observed decrease of reflectivity of the Si/SiO2 surface involves just the opposite effect as compared with the reflectivity on glass (see Fig. 4) attributable to glass having lower refractive index.
Reflectance spectra of the substrate with and without the TiO2 coating.

E. Exploration of the densification effect
To get a deeper insight into the sol–gel chemistry responsible for the growth of our dense films, we made a systematic screening of other additives similar to poly(hexafluorobutyl methacrylate). Various organic molecules, including high-fluorine-content ionic liquids and copolymers were tested in a dip-coating precursor (see Sec. II). Although some of these films were quite compact, all of them were polycrystalline, with crystals of about 20 nm in size. Similar morphology was also reported for titania films made by sol–gel dip coating from an analogous sol containing acetic acidReference Mechiakh, Ben Sedrine, Ben Naceur and Chtorou27 or hydrochloric acid.Reference Kim, Hahn, Oh and Kim23 Each additive had a specific impact on the film characteristics and moreover, the effect of pH and also the effect of addition of a small amount of phosphoric acid (H3PO4) were significant. Particularly the phosphorus-doping (P-doping) caused important changes, which is in consonance with earlier reports on P-doping of TiO2.Reference Prochazka, Kavan, Zukalova, Frank, Kalbac, Zukal, Klementova, Carbonne and Grätzel11, Reference Zukalova, Prochazka, Zukal, Yum, Kavan and Grätzel17
The ionic liquids, butyl methyl imidazolium acetate and butyl-methyl imidazolium trifluoroacetate, produced fairly dense layers without any noticeable specific influence of fluorine (Fig. S4A, Supporting Information). However, small P-doping efficiently inhibited TiO2 particle growth and caused apparent densification (Fig. S4B), although the film quality was far from that of the poly(hexafluorobutyl methacrylate)-templated film. Similarly, the highly fluorinated ionic liquids did not produce layers of the same density as those from the poly(hexafluorobutyl methacrylate)-containing sol. It is worth mentioning that 1H,1H,2H,2H-perfluoro-decyl-1-methyl imidazolium iodide template formed a planar crust with regular bubbles underneath the surface (Fig. S4C), while the 1H,1H,2H,2H-perfluoro-decyl-1-methyl imidazolium bis(trifluoromethane) sulfonimide created fairly open network of TiO2 particles (Fig. S4D). Variations of the above mentioned ionic liquid precursors did not make any contributions to the progress of synthesis of dense layers (modifications of the experimental conditions by adding ethanol, acetone, HCl, phosphorus, or changing of the deposition temperature).
Methyl methacrylate produced porous films similar to other templates (Fig. S5A), but dense layers of comparable quality to those with poly(hexafluorobutyl methacrylate) were obtained, provided methyl methacrylate-containing sol was modified by the addition of H3PO4 and the film was grown from a warm sol, 40–50 °C (Fig. S5B). Exclusively in this case, the dense morphology of our reference poly(hexafluorobutyl methacrylate)-templated films was reproduced (see Figs. S5B and 1B). However, a mixture of poly(hexafluorobutyl methacrylate) with poly(allyl-2-methylacrylate) (1:1 vol) produced only porous layers again. These examples demonstrate that even subtle changes of the dip-coating conditions (temperature, P-doping) as well as the presence of other components in the sol significantly influence the process of titania densification. The growth of dense films from poly(hexafluorobutyl methacrylate)-containing sol is a unique effect, which is attractive because of its simplicity and reproducibility of deposition of high-quality films on variety of substrates.
IV. CONCLUSIONS
Dense nonporous TiO2 films can be prepared via dip coating from a precursor sol, containing poly(hexafluorobutyl methacrylate) as the structure-directing agent. The roughness factor is lower than 20 even for approximately micrometer-thick films. Films were grown on glass, FTO and crystalline silicon (111) face. In the latter case, plain or pyramidal-textured surface was used, both pure and coated with a thin layer of SiO2. Titania films cover even rough surfaces of the substrates perfectly, which proves the presence of thixotropic properties in the Ti-precursor gel.
The films are amorphous with small amount of anatase and monoclinic TiO2(B). Crystalline phases are distinguishable by electrochemical analysis based on cyclic voltammetry of Li-insertion. Other standard methods of titania phase analysis, viz. XRD and Raman spectroscopy, do not provide unambiguous data in this particular case. In the dense films deposited on Si, anatase and TiO2(B) crystals withstand calcination at 900 °C. No recrystallization to rutile is traceable.
The films provide good antireflection function to crystalline Si wafers used in photovoltaic applications. Optical reflectance in the region of visible-to-NIR light is considerably smaller for Si wafers covered by TiO2/SiO2 double-layer film compared with that of SiO2/Si. Their refractive index is smaller than that of crystalline anatase, which is attributed to apparent prevalence of amorphous nature of the films.
For comparison, TiO2 films were grown by the same dip-coating protocol, but with alternative organic additives in the sol, either polymers or ionic liquids. In contrast to poly(hexafluorobutyl methacrylate), the other organic additives do not promote either thixotropic properties or the formation of dense films. Exclusively the precursor sol containing methyl methacrylate produced comparable films, but only at the presence of H3PO4 and higher temperature (40–50 °C). The titania films made from alternative precursors are always porous and substrate coverage is less perfect.
ACKNOWLEDGMENTS
This work was supported by the Academy of Sciences of the Czech Republic (contracts IAA 400400804 and KAN 200100801), Grant agency of the Czech Republic (Contract No. P108/12/0814), by the EC 7th FP project SANS (Contract No. NMP-246124) and ORION (Contract No. NMP-229036). R.T-Z. acknowledges the support of the Program Ramón y Cajal.