

Introduction
Thoroughbred horses race at velocities faster than those required to reach maximal oxygen consumption (VO2max), with a major performance-limiting factor being the onset of fatigue. One important contributor is the dissociation of lactic acid in working muscles, resulting in an accumulation of hydrogen ions and an associated drop in pHReference Fox, Robinson and Wiegman1. The muscle concentrations of hydrogen ions and lactate begin to exceed the tissue's buffering and lactate oxidation capacities as working muscle begins to rely more heavily on anaerobic metabolism. The aim of Thoroughbred training is to forestall the onset of fatigue and increase muscular strength by inducing beneficial cardiovascular and muscular adaptations while limiting the risk for injury. Interval training (IT) has become a widely studied means of improving both aerobic and anaerobic performance in human athletes, but few studies exist comparing Thoroughbred fitness following IT versus other forms of trainingReference Knight, Sinha and Rose2–Reference Harkins, Kamerling, Bagwell and Karns4.
Interval training consists of short bouts of high-intensity work alternating with periods of recovery at a reduced speed. This enables the participant to complete multiple bouts of strenuous activity at a given intensity and for a cumulative time that would be impossible to match with continuous exercise due to the onset of fatigue. In horses, such training should allow for a larger quantity of training to be completed at a heart rate >200 beats min− 1, which appears necessary in order to induce the desired beneficial metabolic effects of trainingReference Bayly5. Additionally, the high-velocity running should increase neuromuscular coordination at race speedsReference Bayly5.
One benefit of IT in humans is a greater improvement in VO2max compared with low-intensity training, suggesting a greater increase in cardiorespiratory functionReference Poole and Gaesser6–Reference Laursen, Shing, Peake, Coombes and Jenkins8. In horses, it has been shown that IT improves VO2max and reduces submaximal heart rates at a given workload, but the extent of improvement relative to other forms of training is unknownReference Harkins and Kamerling9, Reference Hinchcliff, Lauderdale, Dutson, Geor, Lacombe and Taylor10. Improvement of the cardiorespiratory system is significant because it is estimated that Thoroughbreds obtain approximately 70% of their energy from aerobic metabolism during a raceReference Eaton, Evans, Hodgson and Rose11.
Additionally, IT provides for a higher production of lactate followed by a recovery period, causing maximal stimulation of lactate removal via oxidative recoveryReference Henriksson and Reitman12, Reference Mazzeo, Brooks, Schoeller and Budinger13. Lactate oxidation within working muscles and lactate transport to and oxidation by other tissues such as the liver are major mechanisms of lactate removal during exerciseReference Philp, Macdonald and Watt14. IT has proved to be as effective at improving lactate threshold as other forms of training in humansReference Poole and Gaesser6. In horses, work intervals with rest periods of less than 2 min showed a reduction in blood lactate concentration over the training period when compared with intervals with rest periods of 5–10 min, suggesting shorter recovery periods result in greater activation of oxidative recovery within working musclesReference Eto, Hada, Kusano, Kai and Kusuose15. IT has been shown to significantly improve lactate threshold in horsesReference Harkins, Kamerling, Bagwell and Karns4, Reference Hinchcliff, Lauderdale, Dutson, Geor, Lacombe and Taylor10, Reference Wilson, Thornton, Inglis, Ainscow, Gillespie and Robinson16.
In humans and horses, IT has also been shown to increase muscle enzyme activities, resulting in a greater buffering capacity, glycolytic power and oxidative potential of muscle fibresReference Wilson, Thornton, Inglis, Ainscow, Gillespie and Robinson16, Reference Burgomaster, Hughes, Heigenhauser, Bradwell and Gibala17–Reference Gillespie, Fox and Merola19. Human performance during endurance, sprint and repeated sprint tests in both untrained and trained individuals improved following completion of an interval-training programme when compared with other forms of trainingReference Laursen, Shing, Peake, Coombes and Jenkins8, Reference Burgomaster, Hughes, Heigenhauser, Bradwell and Gibala17, Reference Edge, Bishop, Goodman and Dawson20–Reference Roels, Millet, Marcoux, Coste, Bentley and Candau23. Similarly, equine sprint duration has increased following ITReference Hinchcliff, Lauderdale, Dutson, Geor, Lacombe and Taylor10.
Previous research indicates that IT has the potential to produce competitive racehorses. However, the possibility that IT will increase the incidence of injury in the racehorse is a source of considerable debate. Wolff's law dictates that bone remodels according to the stresses placed upon itReference Robling, Castillo and Turner24. IT, rather than long, slow galloping, more closely reproduces the stresses that will be placed upon the bones during a race season; thus, an interval-trained horse may be more adept at handling the skeletal stresses of a race and a racing season. Epidemiological studies have led to the suggestion that more breeze work and less long, slow galloping be included in racehorse preparation for the above reasonReference Boston and Nunamaker25, Reference Stover26. Breeze work is a form of IT, which utilizes short, high-velocity gallops. In addition, the number of strides taken at a gallop has shown to be positively correlated with an increased risk for injuryReference Stover26. IT results in a decrease in the number of strides taken at a gallop when compared with continuous incremental training (CT) over the same cumulative distance. Thus, IT may help promote better performance while possibly decreasing the risk of injury, provided such a training regimen is progressive in nature with adequate recovery time.
Despite these promising findings, studies comparing IT to other forms of training in Thoroughbred horses are limited. The purpose of this study was to test the following hypothesis: IT results in similar or better performance parameters in Thoroughbreds when compared with CT of the same workload while decreasing the number of galloping strides taken to attain fitness.
Materials and methods
This study had the approval of the Institutional Animal Care and Use Committee of Washington State University.
Horses
Nine healthy, Thoroughbred horses and one Thoroughbred-cross (eight geldings and two mares; 8.5 ± 1 year of age (mean ± SE)) completed the study. The horses were pasture rested for 9 months prior to the start of the study. The horses were matched by weight into pairs and randomly allocated to either the interval-trained group or the continuous incremental-trained group to form two groups of five.
Training protocol
Two training protocols, interval (IT) and continuous incremental (CT), were completed on an equine treadmill (SATO I treadmill, SATO, Gothenburg, Sweden (0–16 m s− 1, 0–10% slope)) for 6 weeks. Five days a week, horses from both groups completed equivalent, predetermined amounts of work (W) in joules, where work equalled force multiplied by the vertical displacement, and force (F) equalled the body mass in kilograms and vertical displacement equalled the sine of the angle of the treadmill (sin Φ) multiplied by the distance (D) travelled in metres. Prior to each week of training, the horses were weighed to calculate force. Distance to be travelled during each training bout was then calculated for each horse, each week by application of the following equation: D = (W)/[(F)(sin Φ)].
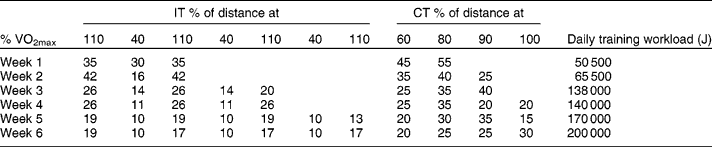
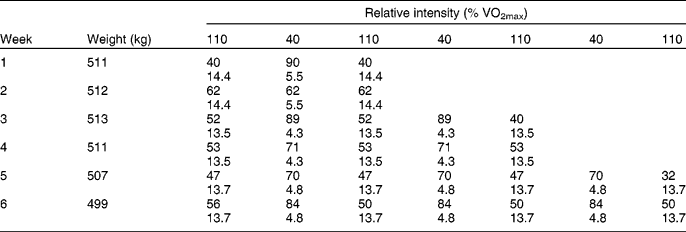
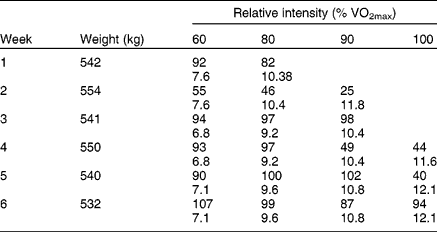
The horses were exercised at individualized speeds correlating with specific %VO2max values as determined by the previous testing day. This enabled the horses to run at equivalent relative intensities. On each day of training, both groups completed a warm-up and cool-down at 40% VO2max. The distances of both the warm-up and cool-down were equivalent to 29 000 J for weeks 1–2 and 48 000 J for weeks 3–6. Both groups exercised 5 days a week with three training days alternating with two trot days. The trot days consisted of the warm-up, the cool-down and an additional 50 500 J for weeks 1–2 and 84 000 J for weeks 3–6 at a speed of 40% VO2max. In addition to the warm-up and cool-down, on the three training days, the horses in each group were exercised in accordance with the plan depicted by Table 1. Representative training protocols for each group are provided in Tables 2 and 3. The CT was similar in design to conventional methods of Thoroughbred trainingReference Harkins, Kamerling, Bagwell and Karns4, Reference Bayly5. The supramaximal IT was more similar in design to human IT in intensity and repetition compared with previous equine studiesReference Knight, Sinha and Rose2–Reference Harkins, Kamerling, Bagwell and Karns4, Reference Henriksson and Reitman12, Reference Laursen, Shing, Peake, Coombes and Jenkins21, Reference Billat, Flechet, Petit, Muriaux and Koralsztein27–Reference Smith, Coombes and Geraghty29. The treadmill slope was adjusted from 6 to 10% between weeks 2 and 3 as described below. The horses were rested on a 2-acre (0.8 ha) pasture in between training bouts with unrestricted access to alfalfa hay.
Training protocols

Chart of the training regimens for the interval (IT) and continuous incremental groups (CT) showing the percentage distance travelled at the speeds correlating with the specified relative intensities (% VO2max). The treadmill slope for weeks 1–2 was 6% and for weeks 3–6 was 10%. Daily training workloads do not include the warm-up or cool-down.
Interval training protrocol

Chart of an interval-training (IT) protocol of a representative IT horse showing the time (s), upper, and speed (m s − 1), lower, corresponding to the defined relative intensity. Each training protocol was individualized and calculated based on the horse's weight, their individual speeds and the values described in Table 1. The treadmill slope for weeks 1–2 was 6% and for weeks 3–6 was 10%. The above chart does not include the warm-up or cool-down.
Continuous incremental training protocol

Chart of a continuous incremental training (CT) protocol of a representative CT horse showing the speed (m s − 1, lower) corresponding to the defined relative intensity and the time (s, upper) for which that speed was completed. Each training protocol was individualized and calculated based on the horse's weight, their individual speeds and the values described in Table 1. The treadmill slope for weeks 1–2 was 6% and for weeks 3–6 was 10%. The above chart does not include the warm-up or cool-down.
During each warm-up and cool-down period, the horses were evaluated for signs of lameness. All lameness was recorded and the horses treated with a minimum of 48 h of rest followed by re-evaluation. Additionally, the number of galloping strides was acoustically counted and recorded each training day.
Test protocol
Two test protocol weeks were completed, one prior to and one at completion of the 6 weeks of training. At the start of each test protocol week and between weeks 2–3 and weeks 4–5, each horse performed a standardized exercise test on an equine treadmill. During the first test protocol week and for the first 2 weeks of training, the equine treadmill slope was at 6%. Training continued from week 3 to week 6 at a treadmill slope of 10% to accommodate for increasing fitness. The standardized exercise test consisted of a 4-min warm-up at 4 m s− 1, followed by 60 s at 6 m s− 1 and 60 s at 8 m s− 1. Thereafter, the speed was increased by 1 m s− 1 for each 60 s until a VO2 plateau was achieved. An open flow-through system was used to measure submaximal VO2, VO2max and the production of carbon dioxide (VCO2)Reference Bayly, Schott and Slocombe30. A regression equation was then used to determine the VO2 speed curve and to calculate the speeds corresponding to 40, 80, 100 and 110% VO2max.
During the test protocol weeks, 2 days after assessment of the VO2 speed curve and at least 1 h prior to exercise, the horses were aseptically catheterized to allow collection of mixed venous blood from the pulmonary artery. The horses were then exercised for 3 min at 40% VO2max, 2 min at 80% VO2max and 1 min at 100% VO2max, and then maintained at 110% VO2max until fatigue. Expired gases, heart rate and mixed venous samples were collected during the last 15 s of each speed. In addition, blood samples were collected at fatigue, 5 and 10 min post-exercise. The expired gases were collected for measurement of VO2 and VCO2. Plasma lactate concentrations were measured enzymatically (Yellow Springs Instruments, Yellow Springs, OH, USA, 2300 STAT-L; COBAS-FARA, Roche Co., Basel, Switzerland). Time until fatigue was recorded and defined as the point at which, for 5 s, the exercising horse could no longer maintain pace with the treadmill and refused to quicken pace in response to verbal encouragement.
To permit the comparison of untrained and trained values, the data were reviewed in relation to work. This accommodated for the change in treadmill slope. Total work until fatigue, 110% VO2max work rates and lactate thresholds were calculated. Total work until fatigue was calculated using the previously described equation (W = (DF)(sin Φ)). Work rate was calculated as: work rate = [(FS)(sin Φ)]/0.102, where force (F) equals the body mass in kilograms; Φ equals the angle of the slope of the treadmill; speed (S) is in metres per second; and 0.102 is a constantReference Harkins, Beadle and Kamerling31, Reference Jacobs, Schele and Sjödin32. Lactate concentrations were plotted against the work rate. Work rate lactate threshold (WLa4) was defined as the work rate corresponding to 4 mmol l− 1 lactateReference Jacobs, Schele and Sjödin32, Reference Evans, Rose, Gillespie and Robinson33.
Statistical analysis
Individual group results were analyzed using an ANOVA one-way analysis of variance for repeated measures. Comparative results were analysed using an ANOVA two-way analysis for variance to determine the effects of both exercise and the type of exercise on performance parameters. Significance was interpreted to exist when P ≤ 0.05. When the f statistic was significant, individual means were compared using a Bonferroni post hoc test to determine points of significance.
Results
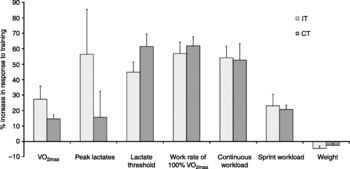
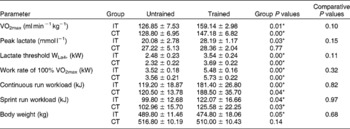
There were no significant differences detected between the untrained, interval (IT) group and the untrained, continuous incremental (CT) group for all measured parameters (see the electronic supplementary Table S1, available online only at http://journals.cambridge.org). All results with corresponding P values are summarized in Fig. 1 and Table 4. All results are expressed as the mean ± SE.
Percentage increase in response to training. Error bars indicate standard error. The percentage increase in the described fitness parameters for the interval (IT) and the continuous incremental (CT) groups

Measured fitness parameters

All values are listed as the mean ± SE. The measured fitness parameters for the interval (IT) and the continuous incremental (CT) groups, both untrained and trained, with corresponding individual group P values for the detection of significant improvement within a group and comparative P values for the detection of significant differences in improvement between groups. *Statistically significant, defined as P < 0.05.
Individual group results
There was a significant increase in VO2max associated with training for both the IT (P = 0.01) and CT (P = 0.00) groups, increasing by 27.38 ± 8.44 and 14.64 ± 2.66%, respectively. Work rate lactate thresholds increased significantly for both groups by 44.84 ± 6.52% for the IT group (P = 0.00) and 61.52 ± 8.02% for the CT group (P = 0.00). The workloads until fatigue increased significantly for both groups. The continuous workload increased for the IT group (P = 0.00) by 54.12 ± 7.55% and for the CT group (P = 0.04) by 52.65 ± 10.65%. The sprint workload increased for the IT group (P = 0.04) by 23.11 ± 7.45% and for the CT group (P = 0.03) by 20.72 ± 2.77%. The work rate corresponding to the 100% VO2max speed increased significantly for both groups by 56.95 ± 7.43% for the IT group (P = 0.00) and 61.93 ± 5.75% for the CT group (P = 0.00).
The IT group had a significant increase in peak lactate values, 56.41 ± 29.05% (P = 0.03); conversely, the CT group did not have a significant increase in peak lactate values, 15.73 ± 16.77% (P = 0.77). Additionally, the IT group had a significant decrease in body weight, 4.47 ± 1.58% (P = 0.05), which was not duplicated in the CT group, 2.47 ± 1.21% (P = 0.14).
Comparative results
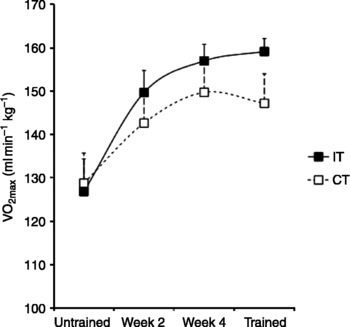
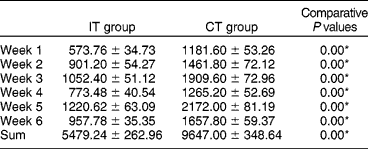
The increase in VO2max values was greater in the IT group than for the CT group (Fig. 2), although not significant (P = 0.10). The IT group took significantly fewer galloping strides for all training weeks (P < 0.00), summing to 5479 ± 263. In contrast, the CT group took 9647 ± 349 galloping strides (Table 5). There were no significant differences when comparing the increase in peak lactate concentrations, lactate thresholds, continuous workloads, sprint workloads, VO2max work rates or the body weights between the two groups.
Change in VO2max. Error bars indicate standard error. Change in VO2max (ml min − 1 kg− 1) over the 6-week training period for both the interval (IT) and continuous incremental (CT) groups. Both groups improved in VO2max significantly (P < 0.05)

Number of galloping strides

All values are expressed as the mean ± SE. The number of galloping strides taken by the interval (IT) and continuous incremental (CT) groups for each week of training and for all weeks of training. *Values are significant, defined as P < 0.05.
Lameness
No significant lameness developed during the study. Two horses, one IT and one CT, developed mild lameness that resolved after 48 h of rest. Both horses were able to continue their training as scheduled.
Discussion
VO2max is considered a measurement of maximal aerobic power. Since it is estimated that Thoroughbred horses produce 70% of their energy during a race by aerobic metabolism, an improvement in VO2max would indicate a significant increase in energy availabilityReference Laursen, Shing, Peake, Coombes and Jenkins8. Previous equine studies have shown significant increases, 8.9–46%, in VO2max with various forms of training, with values ranging from 145 to 162 ml min− 1 kg− 1 for trained VO2maxReference Knight, Sinha and Rose2, Reference Eaton, Hodgson, Evans and Rose3, Reference Hinchcliff, Lauderdale, Dutson, Geor, Lacombe and Taylor10, Reference Evans, Rose, Gillespie and Robinson33–Reference Tyler, Golland, Evans, Hodgson and Rose39. Both the IT and CT groups demonstrated comparable increases to those presented in previous studies, 27.38 and 14.64%, respectively, and comparable trained VO2max values, 159.14 ± 2.98 and 147.18 ± 6.82 ml min− 1 kg− 1.
Although not significant (P = 0.10), the comparative increase in VO2max of the IT group is consistent with the findings of human studies. Such studies determined that training intensity is significantly correlated with improvements in VO2maxReference Poole and Gaesser6–Reference Laursen, Shing, Peake, Coombes and Jenkins8. In contrast, previous equine studies did not demonstrate a difference in the improvement of VO2max with training of varying intensities. However, the training intensities of the fast groups in these studies were below VO2max, performed at 80% VO2max or at speeds corresponding to 4–8 mmol l− 1 lactate and were continuous in natureReference Knight, Sinha and Rose2, Reference Eaton, Hodgson, Evans and Rose3, Reference Evans, Rainger, Hodgson, Eaton and Rose40. Human studies have shown that repetitive work bout intensities ≥ VO2max with a duration of 60% of the maximum time that bout could be performed is the most effective in eliciting improved performance and VO2maxReference Henriksson and Reitman12, Reference Laursen, Shing, Peake, Coombes and Jenkins21, Reference Billat, Flechet, Petit, Muriaux and Koralsztein27–Reference Smith, Coombes and Geraghty29. This study incorporated these findings into the interval-training programme, and the supramaximal intensity of the intervals may explain the difference in VO2max improvement between the two groups. Due to the small sample size, the ability to detect a significant difference was limited and a larger study would probably provide more details concerning the degree of variation between IT- and CT-trained groups.
It is unknown whether beginning to train the CT group with intervals following the 6-week programme would have improved that group's VO2max further. One equine study found a significant improvement in VO2max following 3 weeks of IT in a group of Thoroughbreds that had just completed 3 weeks of aerobic training. It is important to consider that the aerobic training was considerably light and consisted primarily of trottingReference Art and Lekeux38. In contrast, the CT group in this study performed at speeds ranging from 60 to 100% VO2max and demonstrated significant improvements in fitness, reducing the likelihood for a change to be detected. However, human studies have demonstrated significant improvements in VO2max in trained, elite cyclists following ITReference Laursen, Shing, Peake, Coombes and Jenkins21. The results of this study and those of human studies suggest that a further improvement in the CT group's VO2max values might have been realized.
The significant training effect on the work required to reach a plasma lactate value of 4 mmol l− 1 (WLa4) for both groups following training is consistent with current research. With training, the oxidative capacities of tissues improve, resulting in decreased accumulation of lactate for the same absolute work load. Lactate threshold, whether expressed as a function of velocity or work rate, consistently increases with various forms of training in both horses and humans and is accepted as a measure of fitnessReference Eaton, Hodgson, Evans and Rose3, Reference Harkins, Kamerling, Bagwell and Karns4, Reference Poole and Gaesser6, Reference Hinchcliff, Lauderdale, Dutson, Geor, Lacombe and Taylor10, Reference Wilson, Thornton, Inglis, Ainscow, Gillespie and Robinson16, Reference Edge, Bishop and Goodman18, Reference Rainger, Evans, Hodgson and Rose36, Reference Geor, McCutcheon and Shen37, Reference Thornton, Essen-Gustavsson, Lindholm, McMiken, Persson, Snow, Persson and Rose41–Reference Trilk, Lindner, Greene, Alberghina and Wickler43. The absence of comparative significance between the IT and CT groups is also consistent with current human studiesReference Poole and Gaesser6, Reference Edge, Bishop and Goodman18.
The significant increase in peak lactate values of the IT group suggests that this group's lactate tolerance is improved. Peak lactate values have been shown to be positively correlated with running speed in horses, and the IT group did have a significant improvement in the work rate corresponding to 100% VO2maxReference Harkins, Beadle and Kamerling31. The lack of significant improvement in peak lactate values in the CT group does not probably represent a less improved lactate tolerance relative to the IT group; in fact, the two groups had similar trained peak lactate values– for the IT group 28.19 ± 1.17 mmol l− 1 and for the CT group 28.36 ± 2.04 mmol l− 1. It is more probably the result of two CT horses being substantially anxious during the untrained-testing protocol and calm for the trained-testing protocol. Upon removal of the horses from the analysis, a P value of 0.07 is obtained, possibly indicating a training-induced improvement in peak lactate values for the CT group.
The significant improvements in work to fatigue during a continuous and sprint test are consistent with other equine studies that have demonstrated an increased time to fatigue following trainingReference Eaton, Hodgson, Evans and Rose3, Reference Hinchcliff, Lauderdale, Dutson, Geor, Lacombe and Taylor10, Reference Geor, McCutcheon and Shen37, Reference Evans, Rainger, Hodgson, Eaton and Rose40, Reference McGowan, Golland, Evans, Hodgson and Rose42. Similarly, the significant increase in the work rate corresponding to VO2max of both groups is consistent with other studies that have demonstrated improvements in the VO2max speed following trainingReference Hinchcliff, Lauderdale, Dutson, Geor, Lacombe and Taylor10, Reference Evans and Rose34. The lack of a significant improvement of the IT group compared with the CT group in these parameters is contrary to what would be expected based on human studies. Human subjects have shown significant increases in both endurance and sprint performance following IT relative to other forms of training, regardless of prior training statusReference Laursen, Shing, Peake, Coombes and Jenkins8, Reference Burgomaster, Hughes, Heigenhauser, Bradwell and Gibala17, Reference Edge, Bishop, Goodman and Dawson20–Reference Roels, Millet, Marcoux, Coste, Bentley and Candau23. It is important to consider, however, the method of detecting difference used in this study. Work and work rate include body weight as a variable. Additionally, the ability to detect differences in speed and duration is lost with the calculation of work. Regardless of these limitations, it can be concluded that the IT and CT groups were able to complete the same quantity of work during a continuous and a sprint run following training, despite the IT group having lost a significant amount of body weight.
The significant decrease in body weight of the IT group and the lack thereof in the CT group cannot be explained by the amount of energy expended during the treadmill training, because both groups were exercised for equivalent amounts of work; however, the type of work can influence post-exercise energy expenditure. It has been shown in humans that subjects who completed supramaximal intervals had significantly higher oxygen consumption for up to 8 h post-exercise when compared with subjects who completed submaximal runs of the same workload, resulting in a higher total net energy expenditure by the interval groupReference Laforgia, Withers, Shipp and Gore44.
The significantly fewer galloping strides of the IT group were the result of two predictable conditions. Since the IT and CT groups trained for equivalent amounts of work and because part of that work consisted of trot recovery periods for the IT group, the total distance galloped by the IT group was less then that of the CT group. Secondly, the limited increase in stride frequency in relation to speed combined with the longer time spent galloping by the CT group resulted in a further relative decrease in the number of galloping strides taken by the IT groupReference Ratzlaff, Grant, Rathgeber and Kunka45. The lower number of galloping strides taken by the IT group is significant because the number of galloping strides taken is a possible factor in increasing the risk for injury in the racehorseReference Stover26.
It is important to consider the intensity of the galloping strides as another factor for the risk of injuryReference Stover26. There is conflicting research in this regard: studies have shown both increased and decreased risks for injury with more intensive racing and training schedulesReference Boston and Nunamaker25, Reference Estberg, Gardner, Stover and Johnosn46–Reference Mohammed, Hill and Lowe52. Additionally, these studies are limited to official time trials or races for approximating training distances and are influenced by the presence of lay-ups. It has been shown that increased speed of training may reduce the chance of injury if completed over short distances; research indicates breezing at ~15 m s− 1 is associated with a reduction in risk for fatigue injury, while galloping at ~11 m s− 1 over longer distances is associated with an increased riskReference Boston and Nunamaker25. Neither the CT nor IT group in this study was significantly affected by lameness and no pattern was revealed. The use of a treadmill provides for a consistent surface and probably reduced the chance for injury. Further assessment of the risk for injury and its relation to IT versus CT training would require a larger study group and a means of detecting subclinical maladaptations.
Conclusion
The results of this study indicate that supramaximal IT improves equine fitness as well as CT of the same workload and with fewer galloping strides. This may translate into greater consistency and/or improved performance on the track. It is unfortunate that our analysis was limited due to the change in treadmill slope and a low sample size. Completing a similar, larger study has several advantages, including the detection of additional small differences that might exist between two fit groups, detection of differences in VO2max speed and sprint duration and better evaluation of the effects that intervals may have on lameness.