

1. Introduction
New books by Robert Allen (Reference Allen2009a) and Joel Mokyr (Reference Mokyr2009) contain important, but competing, reinterpretations of the British Industrial Revolution. They share common ground in placing the explanation of sustained acceleration in technological progress at the heart of the story. They differ, however, on the reasons for this. Allen stresses that the new technologies were invented in Britain because they were profitable there but not elsewhere, while Mokyr sees the Enlightenment as highly significant and underestimated by previous scholars. They each think that the other's argument is flawed.
This review article seeks first to set out the claims of the two authors and to place them in some historiographic context, and then to evaluate them. The tone will, I hope, be one of sympathetic criticism. The task of explaining why the first Industrial Revolution took place in Britain in the late eighteenth and early nineteenth centuries is far from trivial; indeed, it has been thought of in the past as akin to a search for the Holy Grail. The endeavour undertaken by Allen and Mokyr is most welcome, inter alia, as an antidote to the fashionable approach of Unified Growth Theory (Galor Reference Galor, Aghion and Durlauf2005), which treats the Industrial Revolution either as essentially a scale effect or as the outcome of some Darwinian selection process. Taking technological change seriously must be the hallmark of an economic historian's perspective on the transition to modern economic growth and these two authors have over some decades been established at the top of the premier league as analysts of the economic history of technology.
2. Allen's argument and Mokyr's objections
Allen's explanation for the time and place of the first Industrial Revolution can be summarized as follows. He concentrates on examining what stimulated the technological breakthroughs associated with famous inventions which then triggered off sequences of technological progress (p. 135). His conclusion is deceptively simple: ‘The Industrial Revolution, in short, was invented in Britain in the eighteenth century because it paid to invent it there’ (p. 2).
This bottom line is reached in several steps. First, it is stressed that ‘Britain's unique price and wage structure was the pivot around which the Industrial Revolution turned’ (p. 15). In particular, international comparisons show Britain had relatively high wages but cheap capital and very cheap energy. Second, Allen points to the high fixed costs of developing ‘macro-inventions’ into commercially viable technologies through research and development; he argues that these will only be incurred where the technology is profitable to adopt, a decision which turns on relative factor prices, and where the market is big enough that success in perfecting the technology will deliver enough sales to reward the proprietor (pp. 141–2, 151–4). Third, the profitability of adopting several inventions including the spinning jenny, Arkwright's mill and coke smelting is examined, with the result in each case that adoption is rational at British but not at French prices (chapters 8 and 9). Fourth, these technologies are improved markedly through time in a process of micro-invention, which is Hicks-neutral rather than labour-saving and eventually means that it is rational for them to diffuse widely across the rest of the world. This ‘tipping point’ was typically reached some decades later and then British competitive advantage was lost (pp. 154–5). Fifth, it is recognized that a favourable configuration of prices and wages would not be sufficient to deliver the Industrial Revolution. Allen accepts that ‘factors touching on the supply of inventors may explain why the Industrial Revolution happened in 1800 rather than 1400’ (pp. 268–9); he notes that a cultural revolution had happened in the meantime and that, by the latter date, the British economy had a much greater level of human capital (p. 12).
Although Allen provides much greater detail and conceptual sophistication, in essence, this argument is not new. Earlier vintages tended to talk in terms of the role of ‘shortages’ in inducing technological progress and to note that Britain differed from its rivals in this regard. For example, Peter Mathias wrote that ‘It is a commonplace to remark that Britain had been fortunate in her scarcities’ (Reference Mathias1979, p. 8), while Francois Crouzet (Reference Crouzet1990) provided a lengthy review of the factor scarcity hypothesis with which he clearly sympathized but for which he could not quite provide a clinching justification. Nevertheless, the construction in the past decade of the extensive datasets that clearly establish Britain as a high-wage economy in the context of Asia-Europe comparisons has thrown new light on these issues and returned them to centre stage, as is underlined by recent research by Stephen Broadberry and Bishnupriya Gupta (Reference Broadberry and Gupta2009) on competitive advantage in cotton textiles. Allen himself acknowledges an intellectual debt to H. J. Habakkuk (Reference Habakkuk1962) and sees eighteenth-century Britain as ‘the prequel to nineteenth-century America’ (p. 15). Moreover, as he points out, his approach to micro-inventions is based on the localized-learning formulation of the Habakkuk hypothesis about the role of relative factor prices in promoting labour-saving technological progress in nineteenth-century America developed by Paul David (Reference David1975).
While he accepts the basic assumption that inventive activity was driven by a desire to make money, Mokyr devotes several pages, comprising both theoretical and empirical objections, to a direct rebuttal of Allen's arguments. Mokyr makes three main points. First, in the tradition of W. E. G. Salter's (Reference Salter1960) critique of Sir John Hicks (Reference Hicks1932), he notes that, in the search for new techniques, firms will try to save all costs not just those of relatively expensive factors (pp. 268–9). Second, he claims that there is little evidence to support the view that technological progress exhibited a labour-saving bias overall either in terms of its macroeconomic footprint or the evidence from patents compiled by Christine Macleod (Reference Macleod1988) which suggest that, even at the end of the eighteenth century, only 21 per cent of inventions could be classified as intended to save labour (pp. 269, 271). Third, at most relative factor prices may determine the direction of technological change rather than the intensity of innovative effort, which depended on technological capabilities and was constrained by the availability of useful knowledge (pp. 270, 272).
3. Mokyr's argument and Allen's objections
Mokyr conceptualizes the Industrial Revolution as ‘the set of events that placed technology in the position of the main engine of economic change’ (p. 5). His aim is to explain this phenomenon. He sums up his thesis as follows: ‘Britain became the leader of the Industrial Revolution because, more than any other European economy, it was able to take advantage of its endowment of human and physical resources thanks to the great synergy of the Enlightenment: the combination of the Baconian program in useful knowledge and the recognition that better institutions created better incentives’ (p. 122).
Mokyr suggests that what was needed to generate an industrial revolution was the right combination of useful knowledge generated by scientists, engineers and inventors to be exploited by a supply of skilled craftsmen in an institutional environment that produced the correct incentives for entrepreneurs (p. 116). He believes that Britain's advantages must have been on the supply rather than the demand side of the economy since the Netherlands was richer, France was larger, and Spain had more colonies (p. 99). In this regard, the Enlightenment is seen as having two favourable effects in terms of improving both technological capabilities and also institutional quality. The Baconian program comprised research based on experimentation and scientific method, directing the research agenda to focus on solving practical problems, and making the results widely accessible by organization and dissemination of knowledge (p. 40). Mokyr acknowledges that the impact of the Enlightenment on institutions is hard to quantify but argues that the success of its ideology reduced rent-seeking and promoted competitive markets (p. 63). It was manifested in terms of legislation such as the abolition of the Corn Laws, but also strengthened informal institutions in the form of social norms that favoured gentlemanly capitalism rather than opportunistic behaviour (chapter 16).
Here too, it is easy to point to precursors in the historiography but, in this case, of the components of the argument rather than the synthesis highlighting the role of ideology that is constructed by Mokyr. The links between scientific thought and the Industrial Revolution were underlined by T. S. Ashton (Reference Ashton1948), extensively documented in A. E. Musson and Eric Robinson (Reference Musson and Robinson1969) and put into perspective by Mathias (Reference Mathias1979) who anticipated Mokyr's emphasis on scientific attitudes rather than scientific knowledge. Recent cliometric work by Joerg Baten and Jan-Luiten van Zanden (Reference Baten and van Zanden2008) has found that the growth of book production had a positive effect on European economic growth in the pre- and early industrial period. Similarly, the role played by gentlemanly capitalism in reducing transactions costs was promulgated by Peter Cain and Antony Hopkins (Reference Cain and Hopkins1993), while Daniel Bogart and Gary Richardson (Reference Bogart and Richardson2008) have catalogued the role of parliament as a force for institutional adaptability that promoted more efficient markets, and the emphasis on belief systems as a major influence on institutions, especially informal institutions, echoes Douglass North (Reference North2005).
Allen devotes chapter 10 of his book to rejecting Mokyr's ‘Industrial-Enlightenment model’ of invention using a sample of 79 inventors of whom 10 created macro-inventions that drove the Industrial Revolution.Footnote 1 First, Allen investigates the links of these people with Enlightenment science and finds that these were present for about half, but that while this was quite general in the case of steam it was infrequent for textiles or metals which had much greater economic impact: ‘using that yardstick, the Industrial Enlightenment did not matter much’ (p. 252). Second, Allen considers whether the inventors came from the upper class as he contends the Enlightenment model predicts. There is some support for this, in particular, merchants, lawyers and capitalists made up 4.6 per cent of the population but 32.8 per cent of the inventors (p. 259); however, at the same time, the fathers of many inventors were artisans. Third, Allen looks at inventors as experimenters; he finds that ‘Experimentation was . . . the common feature that characterized eighteenth-century inventors’ (p. 255), but sees this as nothing new and takes any increases in the volume of experimentation to be more a consequence of better education than the Enlightenment per se (pp. 257, 267). Interestingly, Allen says nothing about the impact of the Enlightenment on institutions or economic reform. Presumably, this is because he considers institutional quality to be unimportant as a reason for English primacy in the Industrial Revolution (pp. 5, 15, 125).
4. Assessment
4.1. The role of relative factor prices
This deserves to be examined in terms both of what modern economic theory has to say and also with regard to the details of the empirical evidence. Taking an approach based on the endogenous-innovation school of new growth economics makes a difference. But while this provides a solid theoretical underpinning for a labour-scarcity hypothesis about the bias and the rate of technological progress it also highlights the need for clarification as to what the key differences were between Britain and other countries. Then, the weight of the evidence put forward by Allen to support his claims can be assessed.
The model set out by Daron Acemoglu (Reference Acemoglu2002) predicts the direction of technical change in a setting where suppliers of different types of new technology respond to market signals. In his model, relative-price and market-size effects both matter; the former creates incentives to develop techniques used in the production of goods that use more expensive factors of production and the latter to invent technologies that have a larger market, i.e. use the more abundant factor. The net effect depends on the elasticity of substitution between factors. The importance of the market-size effect can be understood in terms of expected profitability in the context of incurring fixed costs in development of a new technology.Footnote 2 Acemoglu (Reference Acemoglu2009) extends this analysis to consider the impact of labour scarcity on the rate, rather than the bias, of technological progress. The key result is that this effect is positive if technological change is strongly labour saving, i.e. it reduces the marginal product of labour.Footnote 3
Thus, notwithstanding Mokyr's dismissive reaction, Allen's analysis is theoretically defensible and his emphasis on the costs of development of a technology goes with the flow of recent growth economics. In the spirit of Acemoglu's model, the decision to incur the development costs for the technologies that were central to the Industrial Revolution would be predicted to depend on the number of potential adopters. In turn, this would depend both on whether it was profitable for firms to adopt the technology, given factor prices, and also on how many firms were in the market, as Allen points out (pp. 152–3). Either relative factor prices or market size might undermine the viability of developing the technology and it would be nice to distinguish clearly between the two. Let us review Allen's evidence with this in mind.
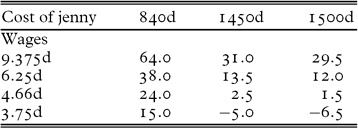
Allen considers the profitability of adopting the spinning jenny in detail (pp. 185, 194–5, 213–15). He compares savings in wages with the cost of the jenny and finds that the rate of return around 1780 was 38 per cent in England, compared with a required rate of return assumed to be 15 per cent, but only 2.5 per cent in France and minus 5.2 per cent in India. England's advantage over France accrues both from higher wages and cheaper jennies in the former. Allen's calculations are reported in Table 1 together with some further permutations.
Internal rate of return on purchase of spinning jenny, c. 1780 (%)
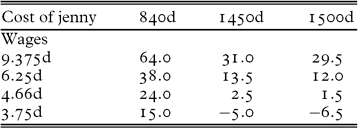
Notes:
England: price of jenny = 840d, wage = 6.25d (Allen Reference Allen2009, p. 214)
France: price of jenny = 1450d, wage = 4.66d (Allen Reference Allen2009, p. 214)
United States (Philadelphia): price of jenny = 1500d (Jeremy Reference Jeremy1973, p. 30), wage = 9.375d based on 50 per cent differential with England (Adams Reference Adams1970).
Rate of return is derived from the expression
J = Σ(wΔL – m)/(1 + r)t
where J is the price of the jenny, w is the daily wage of a spinner, m is the additional maintenance cost of the jenny assumed to be 10 per cent of the purchase price each year and the lifetime of the machine is 10 years.
ΔL is the saving of labour based on the formula
ΔL = YD(1 – 1/P)
Where Y is the number of days the jenny is used each year, D is the proportion of a full day that it was used for, and P is the relative labour productivity of a spinner with the jenny compared with the spinning wheel. Allen's base-case assumptions are that Y = 250, D = 0.4 and P = 3 so ΔL = 67.
Source: own calculations based on these assumptions.
Several interesting points emerge from Table 1. First, at the English price, the jenny would be profitable at French wages. It is incorrect to say that low wages were the reason the French did not use the jenny. Indeed, at the French jenny price, adoption would not have been profitable at English wages. Second, it looks very profitable to invent and adopt the jenny in America.Footnote 4 So, perhaps it is really the small size of the market there that is the obstacle, as Allen seems to suggest (p. 41), or perhaps human capital is inadequate (p. 212).Footnote 5 Third, in England, the jenny would have been profitable at wages of 3.75d (60 per cent of the figure used by Allen). Based on Allen's wage and prices dataset, this implies that it had been profitable since 1650, over a century before Hargreaves's invention. Fourth, it should also be noted that the rate of return is quite sensitive to the utilization assumptions.Footnote 6 If it is assumed that the jenny would be in use for half the day on 300 days of the year rather than 40 per cent of the day on 250 days, as assumed by Allen, then ΔL = 100 and the rate of return in France becomes 18 per cent while it would have been profitable with English wages at 2.51d (40 per cent of Allen's wage rate).
Overall, Allen's headline story that the combination of high wages and cheap coal was the key to inventing the Industrial Revolution seems a bit too bold. Market size may well matter and coal does not come into it in the important case of the breakthroughs in cotton-textile technology; devoting some effort to quantifying market size would be valuable. The delay in inventing the jenny, although it appears that it would have been profitable long before the 1760s, and the questionable robustness of the rate-of-return calculations add to the sense that the argument is oversold. More work on similar calculations for the other inventions would strengthen Allen's claims.
4.2. Macro- and micro-inventions
Both Allen and Mokyr use the terminology of ‘macro-inventions’ and ‘micro-inventions’ and this distinction is not only valuable in thinking about technological change in the Industrial Revolution but it also has implications in terms of the evidence for their rival interpretations. To avoid serious confusion, however, it is important to recognize that they use different definitions of these terms.
The Enlightened Economy continues in the tradition of Mokyr (Reference Mokyr1990), where macro-inventions are radical new ideas without clear precedent that emerge more or less ab nihilo with potentially dramatic effects. The Industrial Revolution was notable for a cluster of such inventions. Micro-inventions represent the development stage which turns the original invention into a viable business proposition (Mokyr Reference Mokyr2002, p. 48, 105) and the continuous flow of incremental improvements that made the new techniques work better (Mokyr Reference Mokyr2009, p. 81). In other words, micro-inventions are a combination of research and development and learning by doing/using. Mokyr sees macro-inventions as only weakly, if at all, related to economic forces but the process of micro-invention is responsive to economic incentives (Reference Mokyr1990, p. 295). Micro-inventions are far more frequent and account for the lion's share of productivity gains (Mokyr Reference Mokyr1990, p. 13).
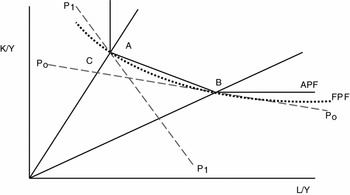
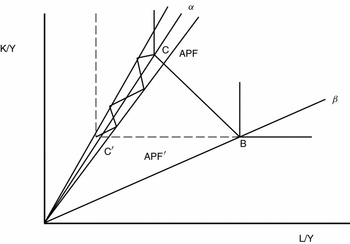
Allen also sees macro-inventions as important breakthroughs that give rise to long trajectories of advance but, for him, a key characteristic is that they radically changed factor proportions, and in the case of the Industrial Revolution were labour saving (p. 136). To perfect a macro-invention to the point where it is commercially viable requires a great deal of perspiration (and expense) and this explains why macro-invention is biased and sensitive to relative factor prices (p. 141). Micro-invention is the process of localized learning after the technology has been introduced and this is neutral rather than prone to a factor-saving bias. Allen thinks in terms of a diagram introduced by David (Reference David1975) and reproduced here as Figure 1. The process of macro-invention makes point C possible, which will only appeal to the country with the P1 relative factor prices, but then learning generates movement down the α ray.
Choice of technology: the role of factor prices

Technical progress: localized change

If we think of a sequence which comprises three phases, which are (1) idea → (2) R & D including substantial development expenditure → (3) incremental improvement, then Allen considers (1) and (2) as ‘macro-invention’ and (3) as ‘micro-invention’, whereas for Mokyr (1) is ‘macro-invention’ while (2) and 3) are both aspects of ‘micro-invention’. The different treatment of development explains why for Allen macro- but not micro-invention is sensitive to price signals but for Mokyr the opposite is the case. Adopting a common convention on terminology could eliminate this apparent discrepancy and allow the two approaches to be combined. Then the big difference between the two authors would concern their hypotheses about the major influences on the successful development of new technology (phase 2).Footnote 7
If micro-invention is central to technological advance, especially with regard to realizing its productivity potential, then, if the Industrial Enlightenment hypothesis is to carry weight, it must explain why it entails a substantial impact on micro-invention. Indeed, this is central to Mokyr's argument. He maintains that micro-invention required a great deal of pragmatic and informal knowledge and a systematic method of experimentation (2002, p. 48), that at the heart of the process were anonymous craftsmen who investigated what worked and what did not work (2009, p. 44), and that a major contribution came from reduced access costs to useful knowledge. The human capital of the workforce then gave Britain a comparative advantage in micro-invention (2009, p.113).
Several points arise from this with regard to attempts to test Mokyr's hypothesis. First, Allen's focus on the origins and contacts of the macro-inventors is at best a partial test or, at worst, misplaced and the very anonymity of micro-invention makes quantitative investigation of the craftsmen's role impossible. Second, if artisanal micro-invention is important, the connections of this with the Enlightenment remain somewhat elusive and, at best, indirect, as Mokyr admits (Reference Mokyr2009, pp. 57–61). Third, the notion of lower access costs to knowledge as a stimulus to micro-invention during the Industrial Revolution is attractive but again remains to be quantified and may be the result of the spread of tacit knowledge through the factory system or urbanization rather than the availability of technical manuals or the activities of scientific societies.
The notion of micro-invention embodied in Figure 1 has implications for the identification of labour-saving bias in technological progress. If there is movement towards the origin down the α ray, then the cumulative effect of these locally neutral improvements is to impart a labour-saving bias to the shape of the isoquant. (Indeed, this is exactly what David had in mind (Reference David1975, p. 59) when he devised this set-up as a solution to the problems posed by the Habakkuk debate.) However, in this case, there is no reason to expect that the associated patent citations will on average exhibit claims of labour saving. Indeed, following Moses Abramovitz and David (Reference Abramovitz and David2001), the place to look for evidence would be in the macroeconomic footprint of technological change on relative factor shares as capital-to-labour ratios change.
Here, pace Mokyr, there is some evidence in support of Allen's view that technological change in the Industrial Revolution was labour saving. Allen (Reference Allen2009b) offers a calibrated model of the British economy based on a translog production function that approximately replicates the stagnation of real wages and the rise in the share of profits in national income at this time together with faster growth of the capital stock than the labour force. The calibration assumes that technical change is entirely labour augmenting and has an elasticity of substitution between capital and labour of 0.2. This is similar to the view of technological change in nineteenth-century America offered by Abramovitz and David (Reference Abramovitz and David2001).Footnote 8
Was micro-invention really neutral? David (Reference David1975) asserted that localized learning would have this characteristic and had technical reasons for wanting this to be the case but offered little evidence to support his claim. Allen's discussion of several cases offers at best mixed support. While coke smelting seems to fit the assumption (p. 217), micro-invention in cotton textiles was relentless labour saving (pp. 184, 209) while in steam engines it actually entailed a reversal of the original bias and became energy saving (p. 177). When micro-invention is interpreted à la Mokyr, then bias might be predicted if, for example, trying to find point C is interpreted as factor substitution when the process of trying to convert ideas into commercial propositions is guided by price signals (cf. David Reference David1975, p. 35).
If micro-invention is interpreted as a flow of incremental improvements, then it remains to be established how far the resulting labour productivity growth was the result of passive learning rather than investments in intangible capital or changes in physical or human capital to labour ratios. Generally speaking, the literature on learning by doing has tended over time to think that omitted-variables bias has inflated estimates of productivity growth from case studies of learning-by-doing. This appears to be true in the famous cases both of Liberty ships (Thompson Reference Thompson2001) and the Lowell textile mills (Bessen Reference Bessen2003; Lazonick and Brush Reference Lazonick and Brush1985), although in neither case has this bias been fully purged. The bottom line seems to be that we need to know considerably more about micro-invention and, especially, learning in order to evaluate the competing claims of Allen and Mokyr.
4.3. Ideology, institutional change and economic reform
Mokyr stresses that the ideology of the Enlightenment had a dual impact on the first Industrial Revolution both because it was conducive to the production of more useful knowledge while at the same time reducing access costs and through its effects in improving incentive structures through promoting better economic policy and institutions. This argument fits perfectly with endogenous growth theory in the tradition of Philippe Aghion and Peter Howitt (Reference Aghion and Howitt1992). Once again, the issues that arise are not so much with the logic of the argument but its empirical validity.
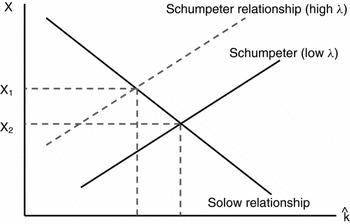
In terms of Figure 2, the Enlightenment would raise λ, the innovation-friendliness of the economy, thus shifting the Schumpeter relationship upwards and increasing the amount of technological progress expected for any level of the capital to effective labour ratio. The favourable impact on λ came both through lower costs of innovating and from better payoffs from innovating as the process of creative destruction was facilitated and rent-seeking opportunities were greatly reduced. Mokyr sees the breakthrough of the British Industrial Revolution in terms of a transition to sustained technological advance and thus the real contribution of the higher λ thanks to the Enlightenment was to underpin productivity growth through micro-invention (pp. 487–8).
Endogenous growth

Mokyr's argument is much more subtle than earlier discussions of institutional change in the context of the Industrial Revolution. For example, in emphasizing the effectiveness of the parliamentary system as an agent of reforms that make markets work better he is more convincing on how the Glorious Revolution mattered than North and Barry Weingast (Reference North and Weingast1989), in downplaying the role of the ‘deeply flawed’ patent system (p. 410) relative to other aspects of institutional quality he rightly dismisses the claims of North and Robert Thomas (Reference North and Thomas1973), and in focusing on the incentives for micro-invention he need not be perturbed by the rejection of the institutional-improvement hypothesis by Greg Clark (Reference Clark2007) on the grounds that many famous inventors made no money.
Mokyr can certainly point to evidence of improvements in institutions and reductions in rent-seeking from the mid eighteenth to the mid nineteenth century. Bogart and Richardson (Reference Bogart and Richardson2008) noted the number of parliamentary Acts that reorganized property rights numbered about 25 per year in the 1720s compared with 175 per year in the 1820s. Forrest Capie (Reference Capie and de la Escosura2004) calculated an increase in the coefficient of contract-intensive money (defined as non-currency money divided by total money supply), a proxy for the enforceability and security of property rights, from 0.26 in 1790 to 0.76 in 1870. William Rubinstein's research on probates (Reference Rubinstein1992) showed that those based on exploiting rent-seeking opportunities provided by the state were still very prominent in 1809–39 but not thereafter.
That said, it has to be noted that Mokyr offers no quantification either of institutional quality or its impact on technological progress and, indeed, this may not be possible, especially if informal institutions are held to be the key; λ is unobservable. Moreover, while Mokyr can point to better economic policy in terms, for example, of the abolition of the Statute of Artificers, the Bubble Act and the Usury Laws, the reform of the patent system, and the repeal of the Corn Laws, many of these were long-delayed. And it is easy to point to major failures of government policy which might well disappoint those imbued with Enlightenment views, for example, the refusal to promote state-financed primary education despite the high social (and fiscal) rate of return it could have delivered (Lindert Reference Lindert2009), the incompetent regulation of the railway system that involved the construction of a seriously sub-optimal network at high cost (Casson Reference Casson2009; Foreman-Peck Reference Foreman-Peck1987), and the obvious shortcomings of company law even in the second half of the nineteenth century (Cottrell Reference Cottrell1980). These really seem to be the outcome of interest-group politics not evidence-based policy design.
So did Enlightenment ideology matter as much as Mokyr claims? The most serious and quantitative debate on the role of ideology in policy reform has related to the repeal of the Corn Laws in 1846. Using various econometric methodologies, results have differed but it would fair to conclude that it is possible to detect roles for ideology, party affiliation and economic interests in the crucial vote (McKeown Reference McKeown1989; McLean and Bustani Reference McLean and Bustani1999). However, the ideology which is held to matter is not that of the Enlightenment. The most sophisticated interpretation by Cheryl Schonhardt-Bailey (Reference Schonhardt-Bailey2003) actually concludes that the success of repeal in 1846 was based on a weakening of the role of ideology relative to constituency economic interest within the split Tory party and the ideology in question relates to defending traditional British institutions.
Of course, Mokyr repeatedly acknowledges qualifications to his hypothesis along similar lines to the above and accepts that the evidence for his claims will not strike everyone as compelling, while at the same time definitely thinking that ‘the glass is half-full’. To be convinced that the Enlightenment had the twofold favourable impact on λ that Mokyr claims requires not only that institutions and/or policy improved, but also that this was driven by ideology. In particular, this entails dropping the traditional belief that economic interests were much more important than ideas in shaping economic reform and being able to show that there were significant positive impacts of reforms on innovative effort. Before this interpretation gains general acceptance, especially among those of a cliometric disposition, more quantitative evidence will be required.
5. Concluding comments
These books are really valuable additions to the historiography of the Industrial Revolution. Not surprisingly, they do not solve the problem of explaining why the ideas for the famous inventions came along where and when they did; that would be to ask too much. But they do make progress in offering plausible ideas as to why these ideas fell on fertile ground and they do offer important insights into what we need to know to understand how and why a sustained and significant acceleration of technological progress took place in Britain from the late eighteenth century onwards. Unlike Unified Growth Theory, they seek to understand this phenomenon rather than, in effect, to explain it away.
In the best argumentative traditions of the new economic history, Allen and Mokyr see their accounts as competing. In essence, however, they are not mutually exclusive and perhaps eventually will more appropriately be seen as complementary. It is widely accepted by economic historians that the explanation for a sustained acceleration of productivity growth must come from understanding the development and subsequent incremental improvement of new technologies. Thus, a combination of Allen's and Mokyr's claims might produce the hypothesis that this resulted from the responsiveness of agents, which was augmented by the Enlightenment, to the wage and price configuration that underpinned the profitability of innovative effort in the eighteenth century.
Acknowledgements
I am grateful to Bishnu Gupta for comments on an earlier draft, to Steve Broadberry and Tim Leunig for a number of very useful suggestions, to John Lyons for his insights on cotton-spinning technology, and to Bob Allen for help with his data. The usual disclaimer applies.