Returns to education, conventionally defined as the income effects of a year of schooling for an individual, have risen dramatically in urban China in recent years. For example, using data from the Chinese Urban Household Surveys from 1988 to 2001, Zhang et al. showed that returns had risen from 4 per cent per year of schooling in 1988 to as high as 10.2 per cent per year of schooling by 2001, with increases observed across different groups of workers.Footnote 1 A prominent finding in the returns to schooling literature in urban China is that returns tend to be higher for women than for men – a pattern found in numerous analyses. For example, Maurer-Fazio reported returns of 4.5 per cent for women and 2.9 per cent for men, based on the 1988 Chinese Household Income Project (CHIP) data.Footnote 2 Comparable figures were 4.5 per cent for women and 3.7 per cent for men, based on the 1992 Chinese Labour Market Research Project (CLMRP) data. Estimates based on the CHIP 1995 data found overall returns to education at 6.9 per cent for women and 4.3 per cent for men.Footnote 3 Also drawing on urban income surveys from 1988 and 1995, Gustafsson and Li found an 8.9 per cent increase in earnings for college education compared to high school education for men, and a 10.2 per cent increase for women in 1988.Footnote 4 Corresponding figures rose to 15.5 per cent for men and 20.8 per cent for women in 1995. Zhang et al. analysed China's Urban Household Surveys from 1988 to 2001, to find that the returns to schooling were higher for women throughout the period, exceeding men's returns to education by an average of about 60 per cent.Footnote 5
We suggest that such findings are accurate but misleading owing to an individualist perspective. The income to which most working-age women and men have access includes not only their own income, but also spouse income.Footnote 6 For example, according to the 2000 census, about 89 per cent of 25 to 44 year olds in urban China were married.Footnote 7 Furthermore, decisions about participation in the labour force, which are consequential for income trajectories, are likely to be made with partner characteristics in mind. To our knowledge, no research in China has explored the returns to education enjoyed via spouse income, or the implications of pooling couple income when thinking about the returns to schooling difference for women and men.
Using data from the China Urban Labour Survey (2001), we contend that returns, conventionally defined, are higher for women than for men because many women trade their own income for spouse income, and this is particularly true among less educated women. First, we demonstrate that women who are more educated are less likely to get married, but that the reverse is true for men. Second, we show that among couples, there is evidence of a trade-off in investments in careers. Moreover, among couples, the less educated the woman and the more educated the man, the less likely the couple is to depend heavily on her income. Finally, we show that among couples, there is a compensating reverse pattern of returns differences by sex when income is conceptualized as spouse income such that in terms of total couple income there are no returns differences by sex.
Background
Gender, human capital and labour outcomes in China
Studies of returns to education in urban China have attested to a rapid increase, and a variety of explanations have been put forward.Footnote 8 Zhang et al.Footnote 9 suggest that institutional reforms played a key role in increasing the returns to schooling in urban China. The labour market trajectories of individuals also play a part. Analysing data from the Life Histories and Social Change in Contemporary China Study (1987–1996), Wu and XieFootnote 10 argue that higher returns to schooling occur only for those who have entered the market sector recently. These new entrants are high earners and also well educated. In this time of rapid change in school-to-work links, two regular patterns of gender difference have been identified: a gender gap in income favouring men, and a pattern of higher returns to education for women.
The income gap between men and women in China has been well documented.Footnote 11 In national, city-based surveys for 1988 and 1997, women earned 80 to 82 per cent as much as men.Footnote 12 Evidence has suggested that the income gap between men and women was stable between the pre-reform and reform periods and across different cohorts,Footnote 13 but more recent analyses indicate that the gender gap in income may have been increasing since the mid-1980s.Footnote 14 Analysing China Urban Household Survey data, Zhang, Han, Liu and Zhao found that the mean female-to-male income ratio declined from 86.3 per cent to 76.2 per cent from 1988 to 2004.Footnote 15 Importantly, the differential in observed skills between high-earning women and men narrowed, while that between low-earning women and men widened. Using parallel data for the years 1987, 1996 and 2004, Chi and Li found that the gender income gap increased substantially, and was greatest at the bottom of the income distribution.Footnote 16
Recent studies have also highlighted the important role of human capital in explaining the gender gap in income over time and space in urban China.Footnote 17 Bian et al. note that in the change from first job to current job, women's slower wage growth is attributable in part to their lower rates of college education.Footnote 18 Further, educational differences may play a role in gender differences in whether individuals are employed at all. Maurer-Fazio's work indicates that the more education a worker has, the better his or her protection against layoff, and the better his or her chance of being re-employed.Footnote 19 Studies have found that more educated women have smaller gaps with men.Footnote 20 Numerous studies have attested to returns being higher for women than for men in China, although most evidence for this statement pertains to urban populations.Footnote 21 This trend has persisted at least throughout the period from 1988 to 2001, and is related to the greater positive self selection of women into the labour force.Footnote 22
However, to place these findings in context, it is important to note that labour market strategies are also linked to family formation, with smaller gender differences in employment and income observed among single people, and significant gender differences favouring men among the married and parents.Footnote 23 Marriage and parenthood are associated with an economic cost for women, but not for men, when measured in terms of own employment and income. Evidence of a greater time competition between work and home for married women and mothers than for married men and fathers is also reflected in the greater increment in time spent on housework associated with family formation for women than for men.Footnote 24 Parish and Farrer found that women spent more time per week on household chores, although their estimates excluded time spent on child care and so probably underestimate the total gender gap in housework.Footnote 25
The greater conflict between family formation and work for urban women raises questions about the pattern of higher returns observed for women than for men. Obviously, the conflict highlights the heightened selectivity issues for women in the workforce. It also underscores that a woman's economic welfare is linked not only to her own income, but to a partner's income, or the lack thereof. Education may shape the likelihood of marriage differently for men and women in China, as occurs elsewhere. Education is also tied to the earnings potential of the spouse, once married. Evidence suggests that this is increasingly the case in China, as educational homogamy has been tied to its high-growth reform period.Footnote 26 Huang, Li, Liu and Zhang analysed twin data from urban China and found strong evidence of a cross-productivity effect from husbands to wives.Footnote 27 In other words, the wife's education had no effect on the hourly wage rate of her husband, but the husband's education had a positive effect on the hourly wage rate of his wife. Human capital is a proxy for potential income, an attribute that may shape the desirability of men and women as marriage partners in different ways.
Moreover, it is likely that labour decisions that are consequential for income are made with spouse characteristics, potential spouse characteristics, or the lack of a spouse, in mind. Consistent with this notion, using data collected in 20 cities in China in 1993 and 1994, Zhou and Moen used couples as the unit of analysis to examine patterns of job shifts between spouses, and found that spouses' socio-economic status and resources mattered for the job-shift patterns of husbands and wives.Footnote 28 It is likely that the degree to which one pushes to actualize returns via one's own income depends on the presence or absence of a spouse, and on his or her potential in the labour market.
Comparative perspectives
Similar to findings in China, research in the United States shows that returns to college education in the form of income were higher for women than for men in recent decades.Footnote 29 Evidence from the United States also speaks to the need to move beyond a conventional conceptualization of returns to understand more fully how the economic implications of education differ for men and women.Footnote 30 Diprete and Buchmann found that women's returns to higher education in terms of probability of marriage, a higher standard of living and insurance against poverty were higher, and had risen faster, than those for men. Also in the United States, college-educated women have a much higher probability than other women of marrying a college graduate, which creates higher total returns, as the sum of both a woman's own and her husband's income.Footnote 31 However, Xie and Raymo found that women's likelihood of marriage was not increased by their economic potential to the same degree as men's.Footnote 32
In addition, marriage has different impacts on the labour force positions of men and women.Footnote 33 The demand for working long hours tends to cause husbands to push for a reduction in wives' investments in the labour market, as well as to push wives out of the labour force. On the other hand, the competition between work and an intense demand for “good mothers” to invest in children's education tends to drive mothers, but not fathers, to “opt out” of the paid work force in favour of spending more time with family.Footnote 34
A different line of research that also speaks to the need to investigate returns to schooling from a couple perspective is work that has considered the impact of a spouse's education on own income. A positive association between spousal education and individual earnings is a common empirical finding.Footnote 35 The two most common explanations for this association are sample selection and cross-productivity effects. Research in the United States has suggested that a woman's education benefits her husband through his own wage income, beyond the effects of assortative marriage alone.Footnote 36 Wong, in an analysis of 1976 census data from Hong Kong, also found that a wife's education had a large effect on her husband's income, although this effect differed by sector of the husband's employment, with those husbands working in family businesses benefiting the most.Footnote 37 A positive association between a wife's education and her husband's income has also been found in Israel and Japan.Footnote 38
Tiefenthaler tested the effect of spouse education on own productivity across different sectors for both men and women, using data collected in Brazil in 1989.Footnote 39 Findings showed that the largest percentage gains per year from spousal education were reaped by men in the formal sector whose wives did not work, and by self-employed women whose husbands were also self-employed.Footnote 40 In Japan, the association of a wife's human capital and her husband's wages was especially pronounced if the wife did not work.Footnote 41 Neuman and Ziderman and Tiefenthaler come to the similar conclusion that the market gains of a woman's education were not limited to her own labour market returns, because her education also increased her husband's income. This also applied to those women who were not in the labour market.Footnote 42 Brynin and Schupp, analysing German and British household panel surveys, found that a wife's education contributed more to her husband's income, as measured by hourly wage, than a husband's education contributed to his wife's, and this within-couple benefit of a partner's education was largest at the level of higher education.Footnote 43
Using 2000 census data from the United States, Lefgren and McIntyre showed that a woman's education was strongly related to her husband's income, although not to the probability of marriage.Footnote 44 For a woman who marries, education is more closely linked to a rise in her husband's income than to a rise in her own, suggesting that the marriage market returns to education may dominate the labour market returns. Using longitudinal data with information both before and after marriage, Astrom found that there was a large negative effect of marriage on female earnings. For a woman, being married to a man with a high level of education could have negative effects on individual earnings, unless the woman herself also had a high level of education.Footnote 45 Overall, for men, all levels of wives' education exert positive effects on earnings; for women, only when a woman's own education was above university level was the effect of her husband's education positive. Otherwise, the effect of a husband's education was negative.
Overall, studies both inside and outside of China show higher returns to education for women than for men, measured as own income. While research elsewhere has expanded focus to consider broader definitions of income, and to investigate returns to members of couples, little similar work has emerged in China.
Data and Methods
Data
This analysis draws on the China Urban Labour Survey (CULS)/China Adult Literacy Survey (CALS), a labour survey combined with an assessment of adult literacy among urban workers in China. The assessment was devised to measure quantitative, document and prose literacy in the Chinese context. The survey and assessment were designed to allow analyses of how literacy is related to different worker characteristics, to enable the use of literacy measures to analyse how human capital is linked to income and employment outcomes, and to address the extent to which urban labour markets discriminate with respect to gender. Analyses using test scores in standard wage regressions and employment model estimations suggest that literacy tests measure important aspects of human capital not captured by years of education, and have significant effects on labour outcomes.Footnote 46 The CULS also contains extensive measurements of education, including training opportunities, which are not found in most surveys.
Sample
The sampling procedure for the CULS is described in detail in Giles et al.Footnote 47 The survey was conducted between November 2001 and January 2002 in five large cities in China: Shenyang, Xi'an, Wuhan, Shanghai and Fuzhou. It was administered by the Institute of Population and Labor Economics at the Chinese Academy of Social Sciences, in collaboration with local offices of the National Bureau of Statistics. For each city, households were selected based on a probability proportional to size sampling method. The probability of sample units being chosen varied with their size such that the larger size units had a higher probability of being chosen.
There were three stages in the sampling process. In stage one, neighbourhoods (jiedao 街道) were selected in each city. All of the jiedao in the city were listed with their population size, and the sampling interval was found by dividing the total population of the city by the number of jiedao that needed to be chosen from the city. Then, a random start point was selected. Finally, jiedao were selected based on the sampling interval. In stage two, community residents' committees (juweihui 居委会), were chosen from each jiedao, following the same procedure. In stage three, households were chosen in the same way. Within each city, an average of 15 households was chosen from each of 70 juweihui. An average of 10 households would be interviewed, and an additional five would be available for interview if households could not be found, had moved or refused to be interviewed. After a household was selected, all of the family members older than 16 were interviewed.
For this study, we limited our sample to urban residents only. The exclusion of rural migrants is based on the consideration that the factors that determine their employment and earnings may be quite different from those for urban residents. From this sample, we drew a subsample of residents aged 25–44. We set the lower age limit at 25 to ensure that our sample was unbiased by the omission of individuals who were still in school, and we set a low upper limit on age to lessen the impact of sex differences in retirement on our analysis. We employed three analytic samples: a sample of men, a sample of women, and a sample of couples. There were 1,057 cases in the sample of men and 1,191 cases in the sample of women. Both of these two individual samples were limited to ages 25 to 44. We eliminated those cases for which we did not have sufficient information to determine spousal relationships in the household, since spouse information is used in the analysis. We also removed all cases with missing data on other relevant variables.
The sample of couples was created using the individual sample information. We included all those couples in which the wife's age is between 25 and 44, regardless of the husband's age. We also included those couples in which the husband's age is between 25 and 44, regardless of the wife's age. As above, we eliminated those cases for which we did not have sufficient information to determine spousal relationships in the household, since spouse information is used in the analysis. After eliminating cases with missing data on other relevant variables, the analytic sample consisted of 886 couples.Footnote 48
Measurement
Labour market outcomes
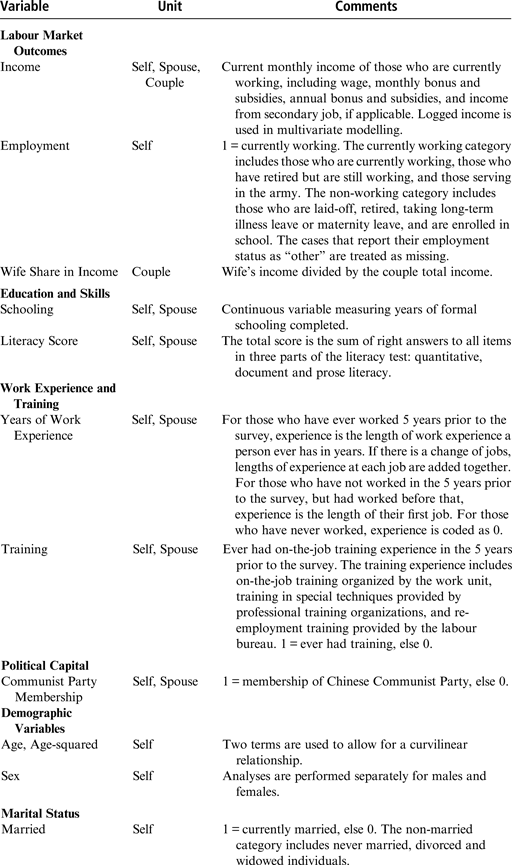
We utilize two measures of labour market outcomes: income and employment status (see Appendix 1 for detailed definitions for all variables used in the analysis and Appendices 2a and 2b for descriptive statistics on analytic samples used in the analysis). We measure labour market income as income for those who were working for wages at the time of the survey. Our current total monthly income measure includes monthly wages, bonuses and subsidies, and other non-monthly-based income, bonuses and subsidies. If a respondent worked at more than one job, all income from the secondary job is also included.Footnote 49 The natural log of income is used in multivariate analyses. In the individual data, we measure own income, spouse income, and couple total income. Couple total income is a measure of a wife's income plus her husband's income, as defined above. In the couple data, couples in which both the husband and wife have zero income are excluded from the analysis. The incomes for a wife and for a husband are calculated for all, including those who report zero income. The logged version of these variables codes zero income to a small number (one yuan) before logging. In addition, we created a measure of a wife's share of couple total income, calculated as wife's income / (wife's income + husband's income).
Employment is measured by a dummy variable indicating if a respondent was currently working or not (0 = no, 1 = yes). We include those who have retired but are still working in the currently working category. The non-working group includes those who have retired, those who have been laid off, those who are taking long-term illness leave or maternity leave, those who are disabled, and those who stay at home doing housework. The few cases with employment status reported as “other” are treated as missing.
Marital status
Own marital status is measured as a dummy variable (married), indicating if a respondent is currently married or not (0 = no, 1 = yes). The non-married category includes those who are single and have never married, and those who are divorced and widowed.
Education
We measure education in the standard way, i.e. the number of years of formal education that a respondent has completed.
Skills
We also consider a direct measure of skills, in the form of a literacy score. The literacy score is derived from the CALS, which was given to each respondent in the CULS who was under the age of 60 during August–October 2002. All respondents were given the same 30-minute test. The design of the literacy test followed the literacy classification used in the International Adult Literacy Survey developed by Statistics Canada. The test encompassed three dimensions of life skills: prose literacy, document literacy and numeracy. Items were adapted to suit the working-age population of urban China.Footnote 50 The total test score used here is derived from the sum of the number of right answers across all three parts of the test.
Work experience and training
Human capital gained after entering the labour market is also important in understanding the current working status and income of the urban work force. Here, we use measures of work experience and training. For the experience variable, the reported beginning and ending time for any past job is used to calculate the total duration of work experience for all who were in the work force at some point during the five years prior to the survey (2,090 out of 2,280 total cases). For 190 cases who had never worked in the five years prior to the survey but who reported having worked at some point earlier in life, the total duration of their first job is used. We believe that the direct calculation of the total number of years of paid work that a person has experienced is still preferable to a more common approximation that subtracts age at school completion from current age to calculate potential experience. Women may have more potential experience if they left school earlier, yet they are more likely to experience a break in work experience due to childbearing.
Access to job training once in the labour market is another important dimension of access to human capital, although it is one that is little studied. It is possible that opportunities for job training differ by gender, and that this difference translates to disparities in credentials or skills needed for improving employment status or increasing wages. In our analysis, training experience includes on-the-job training in the five years prior to the survey. The measure includes training organized by work units, specialized technical training provided by professional training organizations, and re-employment training provided by the government. Training does not include formal credential-granting programmes, such as night or correspondence schools, that lead to academic degrees or diplomas. A dummy variable indicates if a respondent has training experience (0 = no, 1 = yes).
Political capital
While the concept of political capital is not common in studies of gender and the labour force outside of China, it is widely used in the literature on the changing labour market under China's transition. Following precedent in earlier studies,Footnote 51 we measure political capital as Chinese Communist Party (CCP) membership. Shu and Bian point out that membership of the Communist Party is an important form of political capital for it indicates the individual's loyalty to the Party and is an important criterion for rewards to the individual by the Party and the government.Footnote 52 Party members are more likely to be promoted to positions with authority, which often bring higher wages and greater in-kind income, and to receive sponsorship for further education or training.
Demographic variables
Sex (0 = male, 1 = female) is a key analytic variable in our analysis. In marriage models, age and age-squared terms are used. Dummy variables for the household's city of residence are included in all models as control variables.
Methods
We first perform analyses at the individual level. We examine returns to education in terms of own income, and then we describe the relationship between education and skills and marriage. All individual analyses are performed separately on samples of men and women. Next, we perform couple-level analyses that investigate the determinants of decisions about the employment status of couple members, couple total income, and the wife's share in couple total income. Finally, we move back to the individual as a unit of analysis, to evaluate returns to education with two unconventional outcomes: spouse income and couple total income.
For the analysis of marriage, we employ logistic regression. For these and other models, robust standard errors by household are estimated. For the analysis of own income, we perform ordinary least squares regression on working sample members only. For the couple analysis, we present logistic regressions of employment of wives and husbands. We then present results from an analysis of the wife's share in total income, using a “fractional logit” approach of estimating a generalized linear model with a binomial family and logit link.Footnote 53 For the models of spouse income, we present ordinary least squares models estimated for those with working spouses. For models of couple total income, we present ordinary least squares models using a sample in which at least one of the couple members is employed.
Results
Description of the samples
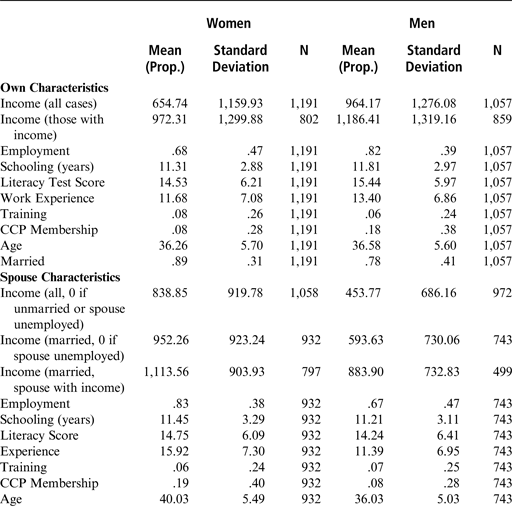
Appendix 2a contains descriptive statistics for the individual male and female samples. Overall, the average income in the sample is 964 yuan a month for men, and 655 yuan for women. Among those with non-zero incomes, the corresponding figures are 1,186 and 972 yuan. In the sample, 82 per cent of men and 68 per cent of women are working. Men have an average of 11.8 years of schooling, compared to women's 11.3 years; men's raw score on the literacy assessment is 15.4, while women's is 14.5. Men have 13.4 years of work experience, compared to women's 11.7, and 6 per cent of men and 8 per cent of women have experienced some form of training in the preceding five years. CCP membership is held by 18 per cent of the men and 8 per cent of the women. The average age for both samples is between 36 and 37 years.
Appendix 2a also contains information on spouses for married respondents. Of course, given that many of the men and women's subsamples are married to each other, the spouse measures reflect the “own characteristics” for the opposite-gender subsample, with slight differences owing to the different composition of the samples described in the data and methods section. Two facts are noteworthy. First, men in the sample are less likely to be married (78 per cent of men versus 89 per cent of women). Second, not surprisingly, by all three spouse income specifications, the average income to which men in the sample have access through a spouse is lower than the average income to which women in the sample have access through a spouse.
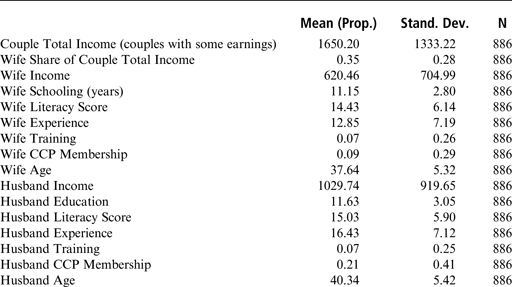
Appendix 2b contains information about the same variables with the couple as the unit of analysis, for couples with at least one member in the 25–44 age range, and at least one member who reported income, along with some additional variables. Additional variables for this sample are total couple income, at an average of 1,650 yuan, and the wife share in couple total income, at an average of 35 per cent.
Gender differences in returns to education
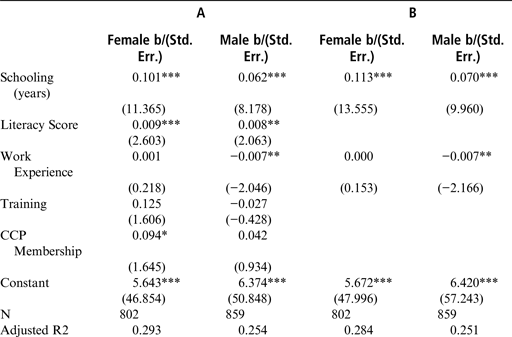
We begin our analysis by investigating returns to education via own income. Table 1 shows models of logged own income by sex. Estimates suggest about a 6 to 7 per cent return to a year of schooling for men, and about an 11 to 12 per cent return for women, depending on specification.Footnote 54 Why are women's returns, when conventionally measured, higher? We argue below that gender differences in returns occur because many women trade-off their own income for spouse income, and this is particularly true among less educated women.
OLS Regression Models of Logged Own Income by Gender (Coefficients and Standard Errors)

Note: *** p < 0.01, ** p < 0.05, * p < 0.1. All models contain dummy variables for cities, with Shanghai as the reference city.
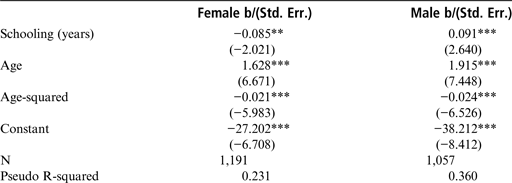
Logistic Regression Models of Marriage by Gender (Coefficients and Standard Errors)
Note: *** p < 0.01, ** p < 0.05, * p < 0.1. All models contain dummy variables for cities, with Shanghai as the reference city.
Analysis of marriage
First, we show that women who are more educated are less likely to get married, but the opposite is true for men. Table 2 shows logit models of marriage by sex. For both men and women, the likelihood of being married shows a curvilinear pattern with age, first increasing and then decreasing. However, what is important in this table is that more educated women are significantly less likely to be married, while the opposite is true for men. An additional year of schooling is associated with about an 8 per cent reduction in odds of marriage for women, but about a 9 per cent increase in odds of marriage for men.Footnote 55 Thus, the more educated a woman is, the more likely she is to be single – that is, dependent exclusively on her own credentials and labour for her economic welfare – and to show up in the conventionally-measured returns models. On the other hand, findings suggest that men who are better educated – and better positioned in the labour market – are also more likely to have spouses. Higher returns to women may be partially attributable to the differential selection of women, compared to men, into marriage, and differing degrees of dependence on another's income.
Analysis of couple work decisions
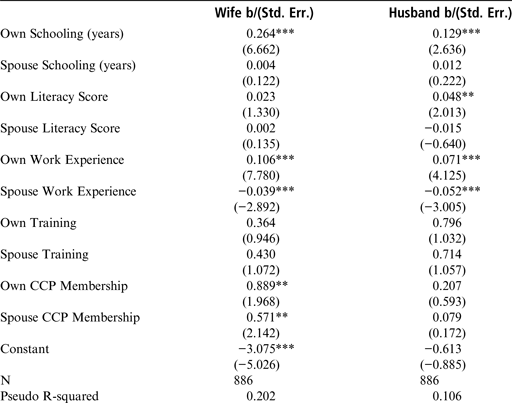
Once a couple are married, we posit that employment decisions, and income consequences of those decisions, are shaped by the characteristics of the other member of the couple. Table 3 shows results from a logit model of employment for those in couples: wives and husbands. This analysis allows us to look at the impact of own and spouse characteristics on employment.Footnote 56 In particular, we are interested in the possibility that spouse characteristics shape employment, particularly for women. Results show that the educational attainments of wives and husbands are positively associated with own employment. The association is sharper for wives, again, suggesting that poorly educated wives are more likely to depend on the employment of their spouses.Footnote 57 Wives' CCP membership is also associated with current employment, and there is an additional spillover effect of husbands' CCP membership. A husband's own literacy matters, but the same is not true for a wife. For neither group does spouse literacy or spouse education significantly predict employment. However, there is evidence of a trade-off in the work experience variables: women and men with more years of experience, unsurprisingly, are more likely to work. However, women and men whose spouses have more experience are less likely to work, all else being equal.
Logistic Regression Models of Employment among Wives and Husbands (Coefficients and Standard Errors)
Note: *** p < 0.01, ** p < 0.05, * p < 0.1. All models contain dummy variables for cities, with Shanghai as the reference city.
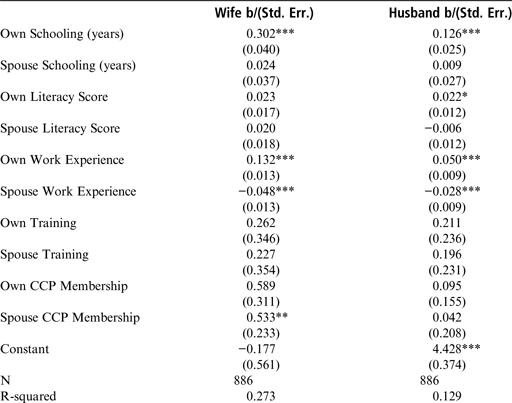
Table 4 shows a model of the incomes of wives and husbands: a seemingly unrelated regression model that allows for correlation of these two incomes.Footnote 58 In these models, couples are included if at least one member reports positive income. If one member of the couple has a zero income, then zero is recoded to one yuan prior to logging income, to allow for the observation to remain in the analysis. Because zero values are included, unlike traditional returns models, the returns to education shown here are much larger than those estimated earlier, but the pattern of a steeper wives' coefficient is still present (coefficients are .302 for wives and .126 for husbands). In these models, again, this pattern emerges probably because less educated women are more likely to be dependent on spouse income. For both women and men, own work experience is positively associated with income, but spouse work experience is negatively associated with income. The work experience finding also hints that there are trade-offs made in investments in employment by women and men, and, by extension, in the share of income that women earn via own income. Wives, but not husbands, seem to enjoy a spillover effect of spouse CCP membership.
Seemingly Unrelated Regression Model of Wife's Income and Husband's Income (Coefficients and Standard Errors)
Note: *** p < 0.01, ** p < 0.05, * p < 0.1. All models contain dummy variables for cities, with Shanghai as the reference city.
Analysis of wife share in couple income
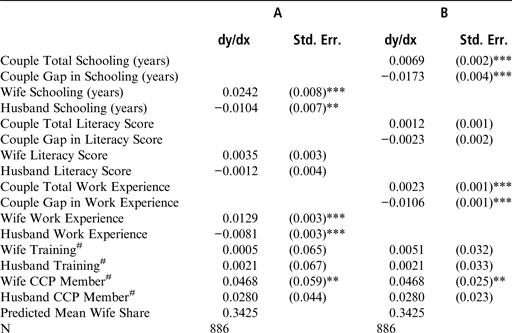
Next, we test directly the idea that less educated women are less likely to depend on their own income. Table 5 shows marginal effects estimates from a fractional logit model of the wife share in total income, expressed as a proportion. The coefficients displayed represent the predicted average change in the wife share in total income associated with a one-unit increase in each independent variable when all other variables are held at their mean values. Model A uses a specification which shows husband and wife education, literacy, training, work experience and Communist Party membership. Model B uses a specification in which husband and wife measures are replaced with a husband + wife total and a husband–wife gap measure for the continuous labour potential measures of education, literacy and work experience.
Marginal Effects from Fractional Logit Models of Wife Share of Total Couple Income
Notes: #dy/dx is for discrete change of dummy variable from 0 to 1. *** p < 0.01, ** p < 0.05, * p < 0.1. All models contain dummy variables for cities, with Shanghai as the reference city.
Consistent with descriptive results, Table 5 shows that, overall, the predicted wife share in total couple income is just over one-third (.34). Model A shows that wife share in total income increases with a wife's education. With all else held at mean levels, a one-year increase in a wife's education is associated with an increase in the wife's proportion of income of .02, and a one-year increase in husband's education is associated with a reduction in the wife share proportion of .01. Work experience shows the same pattern of a positive effect on wife share for a wife's work experience and a negative effect for a husband's work experience. Finally, the proportion of total income attributable to a wife is increased by .05 in households where the wife is a Communist Party member, while there is no effect of a husband's Party membership. Net of other variables included, literacy scores do not matter.
Model B shows results from the same model, except that education and literacy are parameterized as couple total education and couple education gap, and couple total literacy and couple literacy gap. Here, we can see that better educated couples tend to have a somewhat greater wife share in income, and the greater the gap in education, the lower the wife share. A year increase in the husband's educational level over the wife's is associated with a decline in the wife share in income by .017. In the sample, over 20 per cent of cases have a three year, or greater, absolute gap in education between spouses. The work experience total and gap variables show a parallel pattern to the education total and gap variables. These findings indicate a tendency for a wife who is better positioned in the labour market – in terms of education, experience and political capital – to gain more of the return on her education through her own income. A wife with a husband who is better positioned is likely to be gaining more through her husband's income.
Analysis of spouse and couple total income
We have shown that there is differential educational selection into marriage by sex, such that more educated women are less likely to have a spouse to depend on for income, but better educated men are more likely to be married. We have shown evidence of a trade-off among couples, in that a husband's prior investment in work affects his wife's current employment and income, and a wife's prior investment in work affects her husband's current income. We have also demonstrated that the less educated the wife and the more educated the husband, the more likely the couple is to rely on the husband's income. All of these findings suggest that women's returns to education in terms of own income may offer a misleading portrait of the actual returns to education experienced by most women, because most women do marry. In this final section of the article, we seek to establish that, indeed, there is a compensatory pattern of returns by sex when income is conceptualized as spouse income, such that there are no returns differences by sex when returns are conceptualized as couple income.
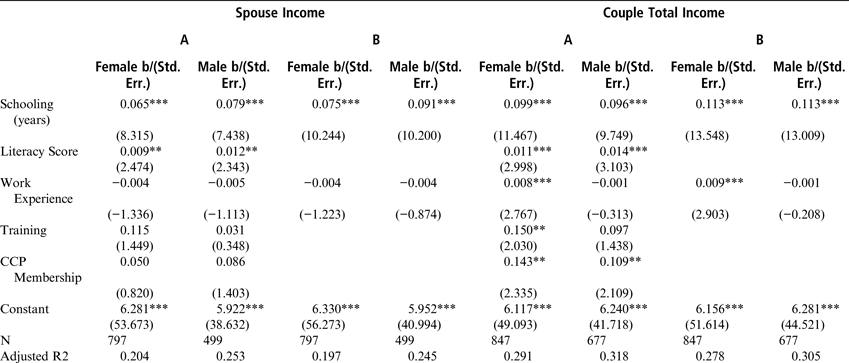
The left-hand panel of Table 6 shows an analysis of spouse income using the same specifications for individual income as in Table 1, based on a sample of those with spouses with positive incomes. Here, the reverse pattern is seen to that of returns estimates for own income: a year of education yields about an 8 to 10 per cent return in spousal income for married men with working spouses, versus a 7 to 8 per cent return for married women with working spouses. The right-hand panel presents models of logged couple income. The specification includes only couples with at least some income. The findings here are simple to summarize: when income is viewed as couple income, returns estimates are the same for men and women. In other words, women and men – at least those in couples – obtain similar returns on investments in education, but via different means.Footnote 59 While these findings pertain only to those in couples, it is important to note that marriage continued to be very widespread during the period of this survey, with the currently married comprising almost 9 out of 10 of all the urban individuals in the age range of this study.Footnote 60
OLS Regression Models of Spouse Income and Couple Total Income by Gender (Coefficients and Standard Errors)
Note: *** p < 0.01, ** p < 0.05, * p < 0.1. All models contain dummy variables for cities, with Shanghai as the reference city.
Conclusions
This analysis has sought to recast the well-established returns difference in education for urban men and women in China by placing this finding in the context of a broader definition of income. We have argued that the conventional notion of returns to education yields higher returns for women because many women trade own income for spouse income, and this is particularly true among less educated women. Our significant findings show that women who are more educated are less likely to get married, though the reverse is true for men. Among couples, there is evidence of a trade-off in investments in careers. Also among couples, the less educated the woman and the more educated the man, the less likely the couple is to depend heavily on her income. Finally, there is a compensatory pattern of returns by sex when income is conceptualized as spouse income, such that in terms of total couple income, there are no significant returns differences by sex. In other words, the apparent returns differences by sex disappear if we view couple total income as a valid indicator of the economic outcomes of an individual's education.
These findings point to the need for empirical studies to reflect the fact that most individuals operate in the context of families and have access to some form of economic support from other family members. This point is increasingly important for understanding the economic well-being of women in China, given evidence of a dramatic decline in urban married women's employment in recent years, from nearly full employment – 92 per cent employed in 1988 and 1995 – to over one quarter not employed –74 per cent employed in 2002.Footnote 61 Finally, while we have focused here on couples, it is also likely that the labour experiences and choices of intergenerational households also shape the relationship between education and own income. Placing individuals in the context of families can help us to understand better the patterns of gender disparity in labour outcomes already established in research focused on individuals.
Appendices
Measures Used in the Analysis
Descriptive Statistics for Variables Used in the Analysis: Individual Samples
Descriptive Statistics for Variables Used in the Analysis: Couple Sample