





Introduction
Plastic pollution has become a pervasive component of global environmental change, with aquatic ecosystems serving as major sinks for persistent plastic contaminants (Bhatt and Chauhan Reference Bhatt and Chauhan2023; Borrelle et al. Reference Borrelle, Rochman, Liboiron, Bond, Lusher, Bradshaw and Provencher2017; Jambeck et al. Reference Jambeck, Geyer, Wilcox, Siegler, Perryman, Andrady, Narayan and Law2015). Among these contaminants, microplastics (MPs; particles <5 mm (Arthur et al. Reference Arthur, Baker and Bamford2009; Thompson et al. Reference Thompson, Olsen, Mitchell, Davis, Rowland, John, McGonigle and Russell2004)) have attracted growing ecological concern because of their persistence, mobility, and potential to enter food webs (Shen et al. Reference Shen, Liang and Jin2023; Wang et al. Reference Wang, Nabi, Yin, Wang, Li, Hao and Li2021). Derived either from the breakdown of plastic debris larger than 5 mm (secondary microplastics) or released directly into the environment as industrial particles and synthetic fibres (primary microplastics), MPs are now reported across marine, freshwater, and terrestrial ecosystems (Bhuyan Reference Bhuyan2022; Li et al. Reference Li, Yu, Craig, He and Su2024).
Microplastics can affect organisms through both physical and chemical pathways (Pittura et al. Reference Pittura, Avio, Giuliani, d’Errico, Keiter, Cormier, Gorbi and Regoli2018; Prinz and Korez Reference Prinz and Korez2019; Rochman Reference Rochman, Begmann, Gutow and Klages2015; Wright et al. Reference Wright, Thompson and Galloway2013). Ingestion may reduce feeding efficiency, obstruct digestive processes, and cause false satiation, while plastics may also transport sorbed contaminants through food webs (Carbery et al. Reference Carbery, O.’Connor and Palanisami2018; Kinigopoulou et al. Reference Kinigopoulou, Pashalidis, Kalderis and Anastopoulos2022). Consequently, understanding the ecological drivers of exposure has become a major focus in contaminant ecology.
Birds, particularly aquatic species, are increasingly recognised as useful indicators of environmental contamination because they occupy diverse trophic positions and often inhabit habitats where pollutants accumulate (Provencher et al. Reference Provencher, Vermaire, Avery-Gomm, Braune and Mallory2018; Puskic et al. Reference Puskic, Slocombe, Ploeg, Roman, Lea, Hutton and Bridle2024; Wang et al. Reference Wang, Nabi, Yin, Wang, Li, Hao and Li2021). Waterbirds may encounter microplastics directly by ingesting them from water and sediments or indirectly via contaminated prey (Reynolds and Ryan Reference Reynolds and Ryan2018). Their ecological diversity also makes them useful systems for examining how species traits mediate exposure risk.
Studies have shown that MP contamination levels in an organism reflect environmental plastic pollution (Lourenco et al. Reference Lourenco, Serra-Goncalves, Ferreira, Catry and Granadeiro2017; Provencher et al. Reference Provencher, Vermaire, Avery-Gomm, Braune and Mallory2018). Birds have shorter intestines and shorter digestive retention times than mammals of similar size (Duque-Correa et al. Reference Duque-Correa, Clauss, Meloro and Abraham2025; Price et al. Reference Price, Brun, Caviedes-Vidal and Karasov2015), allowing food to pass through more quickly and undigested matter to be excreted as faeces (Karasov Reference Karasov1990; McWhorter et al. Reference McWhorter, Caviedes-Vidal and Karasov2009). This means that bird faeces could provide valuable information on the plastic contamination of the feed and the environment in which the birds reside. Therefore, using bird faeces as a tool to investigate plastic pollution in a particular context is not only a non-invasive approach (Heim et al. Reference Heim, Holtmannspötter, Heim, Meinken, Niemann, Temme, Michler-Kozma and Gabel2025) but also suggests that birds can serve as indicators of plastic pollution in an environment (Mansfield et al. Reference Mansfield, Reynolds, Lynch, Matthews and Sadler2024).
Most avian microplastic studies have focused on seabirds, with far less attention given to inland waterbirds, particularly in tropical systems. This is a notable gap, as tropical wetlands are biodiversity-rich ecosystems increasingly exposed to urbanisation, wastewater discharge, and diffuse plastic pollution. In West Africa, evidence of microplastics in sediments, water, and fish is emerging (Blankson et al. Reference Blankson, Tetteh, Oppong and Gbogbo2022), yet little is known about exposure in avifauna.
Urban wetlands face increasing anthropogenic pressure, particularly from plastic pollution. In Ghana, 0.84–1.1 million tonnes of plastic waste are generated annually, with <10% recycled, resulting in environmental leakage (Bening et al. Reference Bening, Kahlert and Asiedu2022; Fiati Reference Fiati2021). Mismanaged waste accumulates in aquatic systems, fragmenting into microplastics and exposing organisms (Okai Reference Okai2020).
Wetland type may strongly influence contamination pathways. Constructed wastewater wetlands receive continuous anthropogenic inputs, particularly synthetic fibres associated with domestic effluent (Acharya et al. Reference Acharya, Rumi, Hu and Abidi2021), and may also function as traps or conduits for microplastic transport through wastewater pathways (Cowger et al. Reference Cowger, Gray, Christiansen, DeFrond, Deshpande, Hemabessiere, Lee, Mill, Munno and Ossmann2020; Kabange et al. Reference Kabange, Yeboah, Sumani and Balaabong2025). Whereas natural wetlands may accumulate plastics through broader hydrological and catchment processes (Sarin and Klomjek Reference Sarin and Klomjek2022; Windsor et al. Reference Windsor, MGr, Tyler and Ormerod2019). Comparing these contrasting wetland types may therefore help identify whether point-source wastewater inputs or landscape-scale processes more strongly shape exposure in bird communities.
Species ecology may further influence microplastic ingestion through its effects on habitat use, feeding behaviour, and exposure pathways. Feeding guilds differ in prey selection, sediment interaction, and use of aquatic microhabitats, all of which may affect microplastic encounter rates (Lourenco et al. Reference Lourenco, Serra-Goncalves, Ferreira, Catry and Granadeiro2017; Porter et al. Reference Porter, Godbold, Lewis, Savage, Solan and Galloway2023; Reynolds and Ryan Reference Reynolds and Ryan2018). Similarly, foraging strategies may determine whether birds ingest particles directly from water and sediments or indirectly through contaminated prey via trophic transfer (Bhatt and Chauhan Reference Bhatt and Chauhan2023; Carbery et al. Reference Carbery, O.’Connor and Palanisami2018). Wingspan, as a proxy for body size and ecological scale, may also influence food intake, foraging range, and trophic position, thereby affecting exposure to microplastics (Jâms et al. Reference Jâms, Windsor, Poudevigne-Durance, Ormerod and Durance2020; Peng et al Reference Peng, Zheng, Liu, Fan, Tang and Xiong2018). Trait-based approaches have increasingly been used to explain ecological responses to contaminants (Menezes et al. Reference Menezes, Baird and Soares2010; Windsor et al. Reference Windsor, MGr, Tyler and Ormerod2019), yet they remain little applied in tropical avian systems. In particular, the extent to which habitat context interacts with ecological traits to shape exposure remains poorly resolved.
Urban aquatic birds increasingly show near-ubiquitous MP contamination in their faecal samples, underscoring the severe pollution of urban aquatic systems. Studies have reported MPs in approximately 98–100% of analysed samples, with concentrations up to 72 particles per mg of faeces (Heim et al. Reference Heim, Holtmannspötter, Heim, Meinken, Niemann, Temme, Michler-Kozma and Gabel2025). These levels reflect heavy anthropogenic pressures on urban waters, including sewage discharge, mismanagement of plastic waste, and stormwater runoff. These findings are alarming, indicating chronic exposure of birds to contaminated food webs and sediments and highlighting the pervasive nature of MP pollution and its potential ecological and physiological consequences. Such consequences may include reduced body condition, impaired nutrient uptake, inflammation of the gastrointestinal tract and other tissues, altered behaviour, reduced reproductive performance, and the transfer of associated contaminants through food webs (Azam Reference Azam2025; Rivers-Auty et al. Reference Rivers-Auty, Bond, Grant and Lavers2023).
Non-invasive sampling through faecal analysis provides a valuable means of assessing recent microplastic exposure in birds without resorting to destructive sampling (Heim et al. Reference Heim, Holtmannspötter, Heim, Meinken, Niemann, Temme, Michler-Kozma and Gabel2025; Provencher et al. Reference Provencher, Vermaire, Avery-Gomm, Braune and Mallory2018). Such approaches may be particularly useful in wetland systems of conservation importance.
This study investigated microplastic occurrence in faecal samples from waterbirds in two contrasting wetland systems in Ghana: a sewage treatment wetland and a natural Ramsar wetland. Specifically, the objectives were to (i) determine the occurrence and abundance of MPs in waterbird faecal samples, (ii) compare MP contamination between the constructed and natural wetlands, (iii) characterise the types, sizes and colours of MPs present, and (iv) examine whether patterns of MP ingestion vary among bird species, feeding guilds, and sensory foraging modes. We predicted that (i) waterbirds inhabiting the sewage-influenced wetland would exhibit higher microplastic loads than those occupying the natural Ramsar wetland, reflecting greater exposure to wastewater-derived plastic contaminants, and (ii) trait-mediated differences in foraging ecology would influence ingestion risk. By providing baseline information on MP contamination in waterbirds from these wetland systems, this study contributes to the growing understanding of plastic pollution in inland aquatic ecosystems and highlights the potential role of birds as indicators of environmental contamination.
Materials and methods
Study sites
The study was conducted at two wetlands in the Greater Accra Region, Ghana: the Densu Delta Ramsar Site (DDRS; 5°31′N, 0°20′W), a natural coastal estuarine wetland, and the Legon Sewage Treatment Plant (LSTP; 5°40′N, 0°11′W), a constructed wastewater wetland (Figure 1). The DDRS comprises lagoon waters, salt pans, freshwater marshes and mangrove-associated habitats and supports resident and migratory waterbirds of conservation importance (EPA 2017; Ntiamoa-Baidu Reference Ntiamoa-Baidu1991). As a designated Ramsar Convention site and Important Bird Area, the wetland provides critical feeding and roosting habitat (Ntiamoa-Baidu Reference Ntiamoa-Baidu1991) but is increasingly affected by urban expansion, habitat conversion and diffuse pollution (Blankson et al. Reference Blankson, Tetteh, Oppong and Gbogbo2022). Catchment-derived inputs may also contribute to contaminant accumulation in the system (Ntiamoa-Baidu and Taye Reference Ntiamoa-Baidu and Taye2025; Windsor et al. Reference Windsor, MGr, Tyler and Ormerod2019). The LSTP is a constructed wastewater wetland comprising stabilisation ponds and open water habitats. Originally designed for domestic wastewater treatment, the system now supports diverse aquatic biota and regularly attracts resident and migratory waterbirds (Adjei et al. Reference Adjei, Adomako, Korang-Labi, Avornyo, Timire, Larbi, Kubasari, Ackon and Reid2023; Holbech and Cobbinah Reference Holbech and Cobbinah2021). Continuous wastewater inflows make the site relevant for examining contaminant exposure associated with anthropogenic inputs, including plastics and other pollutants (Fosu-Mensah et al. Reference Fosu-Mensah, Laryea, Darko and Mensah2024). These contrasting wetland systems provided an opportunity to compare microplastic exposure in birds associated with a natural wetland influenced by landscape-scale processes and a wastewater-influenced wetland characterised by point-source anthropogenic inputs.
Location of the Densu Delta Ramsar Site (DDRS) and Legon Sewage Treatment Plant (LSTP) in Ghana (A = Africa showing Ghana, B = Ghana, C = LSTP, and D = DDRS).

Faecal sample collection
Fresh faecal samples (n = 238) were collected in 12 days between March and May 2024 from waterbirds at DDRS (n = 118) and LSTP (n = 120). No birds were captured or handled during this study. Samples were obtained non-invasively from freshly deposited droppings following direct observation of birds in the field. Similar non-invasive faecal sampling approaches have been used successfully in previous studies investigating microplastic ingestion in wild birds (Jiang et al. Reference Jiang, Cheng, Wu, Li, Chen, Li, Yao, Zhang, Chen, Chen, Chen, Zheng, Sui and Shao2024; Reynolds and Ryan Reference Reynolds and Ryan2018). Sampling was conducted during multiple field visits distributed across the three-month study period at both wetlands, rather than being completed at one site before the other, to minimise potential temporal biases in bird occurrence, habitat use, and microplastic exposure between sites. Sampling was conducted during post-foraging periods (09:00–11:00 h and 15:00–17:00 h GMT) to maximise the collection of fresh droppings, particularly from a monospecific flock. Sampling was avoided during periods when faeces were likely to be extremely dry. Bird species were identified using the field guides (Barlow and Dodman Reference Barlow and Dodman2015; Borrow and Demey Reference Borrow and Demey2010) and direct field observations. For monospecific flocks, species identity was assigned with high confidence based on direct observations of birds immediately before sample collection. Where mixed-species flocks occurred, samples were collected only when species identity could be confidently determined using a combination of flock composition, binocular observations of individual birds prior to disturbance, dropping characteristics, and associated footprints. Potentially ambiguous samples were not collected. Species assignments were further verified by a waterbird technician with over 40 years of experience in waterbird monitoring and census activities in Ghana. Consequently, confidence in species assignments was considered high. To minimise pseudoreplication, samples were collected from spatially separated droppings after flocks had moved, and repeat sampling of the same defecation event was avoided. Fresh samples from solitary birds such as the Common sandpiper Actitis hypoleucos and the Grey heron Ardea cinerea were collected immediately after defecation from natural substrates, while samples associated with plastic materials were excluded. Faecal samples were collected using metal forceps into glass tubes covered with aluminium foil and stored frozen until analysis. Prior to field use, all glass tubes were washed with laboratory detergent, rinsed thoroughly with distilled water and filtered deionised water, air-dried in a clean environment, and covered with aluminium foil to minimise airborne contamination during storage and transport. These procedures were consistent with the contamination-control measures applied to other sampling and laboratory materials used in the study (Cowger et al. Reference Cowger, Gray, Christiansen, DeFrond, Deshpande, Hemabessiere, Lee, Mill, Munno and Ossmann2020). Following collection, tubes were immediately recovered with aluminium foil and stored frozen until analysis. Average wingspan values were obtained from Birds of the World (Reference Billerman, Keeney, Kirwan, Medrano, Sly and Smith2026) and used as a species-size metric in analyses: small (<50 cm), medium (50–100 cm), and large (>100 cm).
Laboratory analysis of microplastics in faecal samples
Each faecal sample was transferred into a pre-cleaned, labelled glass beaker corresponding to its unique sample code. All beakers and associated glassware were arranged on an aluminium foil-covered work surface to minimise contamination. A 10% (w/v) KOH solution was prepared, and 20 mL was added to each beaker to digest organic material and facilitate the isolation of microplastic particles while minimising damage to most plastic polymers (Carlin et al. Reference Carlin, Craig, Little, Donnelly, Fox, Zhai and Walters2020; Pegoraro et al. Reference Pegoraro, Jacoby, Bertoldi, Gomes, Fernandes and Nunes2026). The contents were gently stirred to promote disaggregation. Each beaker was then tightly covered with aluminium foil and incubated at 60°C for 24 hours to ensure complete digestion of organic matter. After digestion, the samples were vacuum-filtered through 1 µm glass fibre filter paper. The filters containing retained residues were carefully transferred into clean glass Petri dishes, covered to prevent contamination, and then dried in an oven at 40°C for 45 minutes.
Microscopic examination was conducted using a DM143 digital LED stereo microscope equipped with an integrated camera system. Image acquisition and measurements were performed using Motic Images Plus 3.0 software. For analysis, each filter paper was placed under the microscope and carefully examined for MPs. Suspected MP particles were visually identified based on established morphological criteria (Hidalgo-Ruz et al. Reference Hidalgo-Ruz, Gutow, Thompson and Thiel2012), following recommended quality assurance procedures for microplastic analyses (Cowger et al. Reference Cowger, Gray, Christiansen, DeFrond, Deshpande, Hemabessiere, Lee, Mill, Munno and Ossmann2020). A metallic probe was used to manipulate and verify suspected particles. Identified particles were measured (in µm) using the micrometre eyepiece in conjunction with the image software and subsequently characterised by morphological type (fibre, fragment, film, or pellet) and colour (Soliz et al. Reference Teampanpong and Duengkae2024). The smallest particle reported (5.7 µm) represents the minimum measured particle size recovered in this study rather than a predefined analytical detection limit. All suspected MPs were counted manually under the microscope. Because the visual identification of very small particles is subject to inherent uncertainty, all suspected MPs were subsequently verified using the hot-needle test (Heim et al. Reference Heim, Holtmannspötter, Heim, Meinken, Niemann, Temme, Michler-Kozma and Gabel2025; Lusher et al. Reference Lusher, Bråte, Munno, Hurley and Welden2020), and the limitations of this stereomicroscope-based approach are acknowledged. A fine metallic needle was heated using an open flame and brought close to the particles. Those that showed visible melting, deformation, or adhesion upon contact were considered likely MPs, consistent with their thermoplastic characteristics. Although spectroscopic techniques such as Fourier-transform infrared (FTIR) and Raman spectroscopy provide more definite polymer identification, their application was beyond the scope of this study. Visual identification of microplastics, particularly fibres, may be susceptible to false positives because natural and semi-synthetic fibres can exhibit similar morphological characteristics (Lenz et al. Reference Lenz, Enders, Stedmon, Mackenzie and Nielsen2015; Lusher et al. Reference Lusher, Bråte, Munno, Hurley and Welden2020). To minimise misclassification, only particles that met established visual identification criteria and exhibited a positive response during the hot-needle test were classified as microplastics.
To minimise contamination, all laboratory procedures were conducted under controlled conditions. Work surfaces were thoroughly cleaned with 70% ethanol and then wiped with lint-free materials before analysis. All glassware was rinsed with filtered distilled water and covered with aluminium foil when not in use. Only non-plastic equipment (glass and metal) was used throughout the analysis. Laboratory personnel wore cotton lab coats and nitrile gloves to minimise the introduction of synthetic fibres. All solutions, including the KOH digest, were prepared using pre-filtered distilled water. Samples were kept covered as much as possible during processing to limit airborne contamination. Procedural blanks were processed alongside samples to assess potential laboratory contamination. All particles detected in the blanks were recorded by type, colour, and size class. Sample counts were subsequently corrected through direct background blank subtraction, whereby the mean number of particles detected in procedural blanks was subtracted from the corresponding particle counts observed in each sample prior to statistical analysis. Quality-control procedures followed current recommendations for minimising airborne and laboratory contamination in microplastic studies (Cowger et al. Reference Cowger, Gray, Christiansen, DeFrond, Deshpande, Hemabessiere, Lee, Mill, Munno and Ossmann2020).
Data analysis
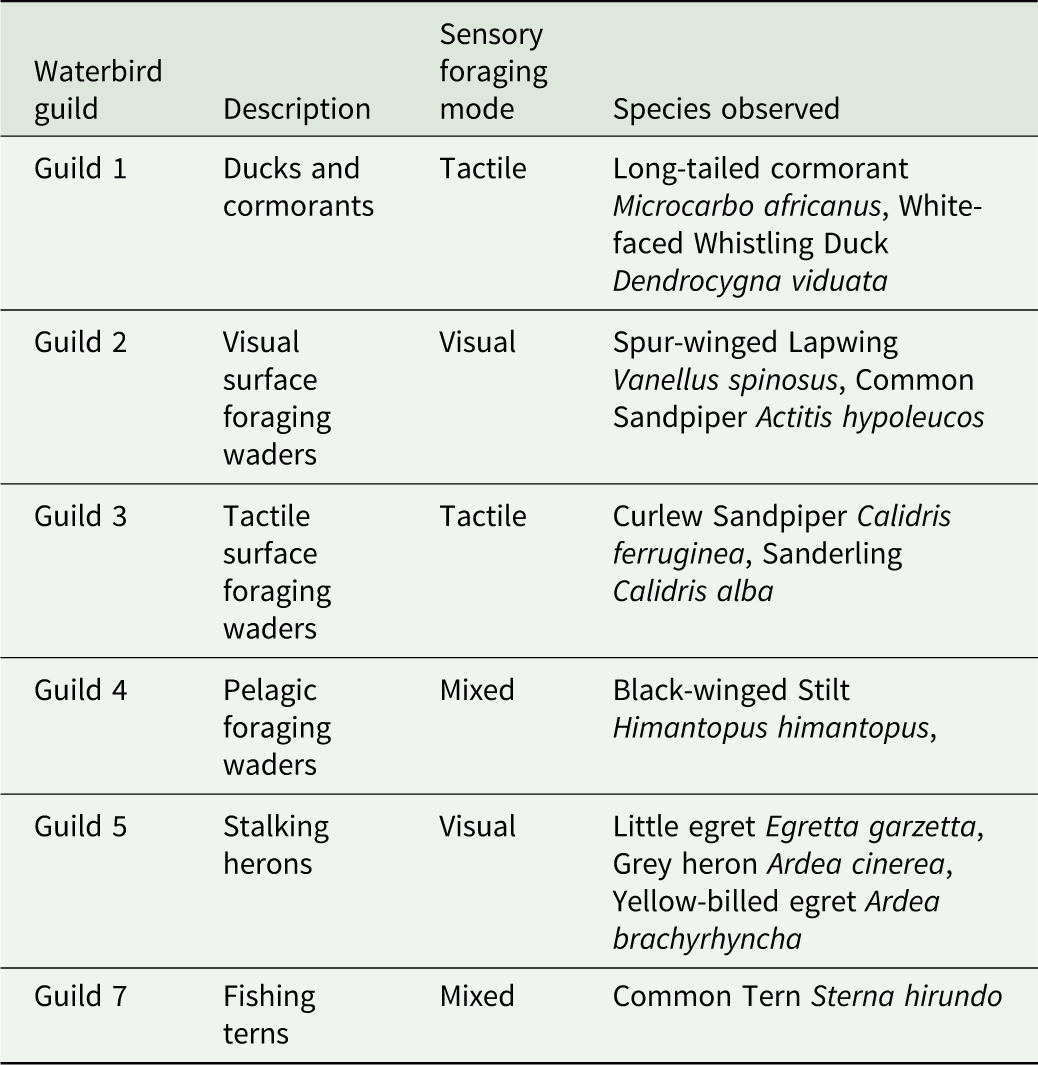
Microplastic frequency data were expressed as percentages, while abundance and particle size were summarised as mean ± SD per faecal sample. Bird species were grouped into ecological guilds following Ntiamoa-Baidu et al. (Reference Ntiamoa-Baidu, Piersma, Wiersma, Poot, Battley and Gordon1998) and Piersma and Ntiamoa-Baidu (Reference Piersma and Ntiamoa-Baidu1995) and classified by dominant sensory foraging mode (visual, tactile, and mixed) following Gbogbo (Reference Gbogbo2007) and Lourenco et al. (Reference Lourenco, Serra-Goncalves, Ferreira, Catry and Granadeiro2017) to evaluate trait-mediated patterns of microplastic exposure (Table 1). Microfibres were also assigned to three size classes (<100 µm, 100–250 µm, and 251–500 µm).
Functional foraging traits and community guild structure of waterbirds

Table 1. Long description
The table groups the waterbird species included in the study into ecological guilds based on their feeding ecology. Each guild is assigned a numerical identifier and includes a brief description of its feeding strategy, the dominant sensory foraging mode (visual, tactile or mixed), and the species belonging to that guild. Six guilds are represented, encompassing ducks and cormorants, surface-foraging waders, pelagic foragers, stalking herons and fishing terns. The table establishes the ecological classifications used throughout the analyses of microplastic occurrence and abundance.
All analyses were conducted in R (R Core Team 2026) using RStudio (Posit Team 2025). Because count data were non-normal (Shapiro–Wilk tests: P < 0.001) and overdispersed, non-parametric tests and negative binomial generalised linear models were used (Zuur et al. Reference Zuur, Ieno, Walker, Saveliev and Smith2009). Mann–Whitney U-tests compared microfibre abundance and particle size between wetlands, while Kruskal–Wallis tests assessed differences among guilds, foraging modes, and bird size classes, with post hoc Dunn tests applied where appropriate. Differences in the frequencies of particle types and fibre colours were examined using simulated chi-square tests, and standardised residuals were used to identify categories contributing to significant deviations. Ecological predictors of microfibre abundance were evaluated using negative binomial generalised linear models with site, guild identity, foraging mode, body size, and average wingspan as explanatory variables. Candidate models were compared using Akaike’s Information Criterion, and inference was based on the most parsimonious model supported. Graphical outputs were generated in R, and statistical significance was accepted at P < 0.05.
Results
Composition and relative abundance of microplastics
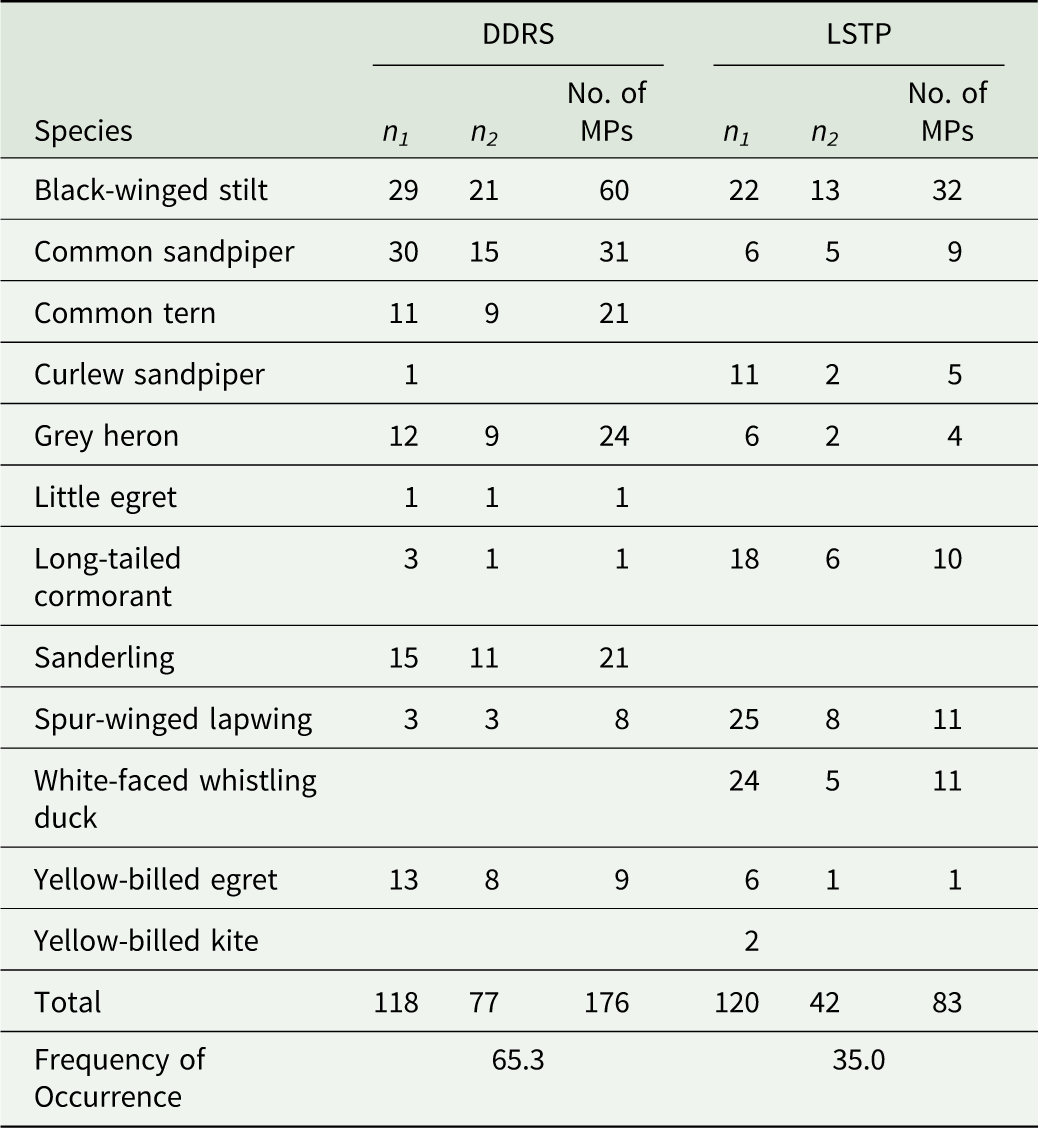
A total of 238 faecal samples representing 11 waterbird species and one associated raptor (Yellow-billed kite, Milvus aegyptius) were analysed from the Densu Delta Ramsar Site (DDRS) and the Legon Sewage Treatment Plant (LSTP). The sampled species belonged to five avian orders and eight families, with Black-winged stilt (21.4%), Common sandpiper (15.1%), Spur-winged lapwing (11.8%), White-faced whistling duck (10.1%), and Long-tailed cormorant (8.8%) contributing the highest proportions of samples. Rarely represented species included the Yellow-billed kite (0.8%) and Little egret (0.4%) (Table 2).
Species composition, sample size, abundance, and frequency of occurrence of microplastics

Table 2. Long description
The table compares microplastic occurrence among waterbird species sampled at the Densu Delta Ramsar Site (DDRS) and the Legon Sewage Treatment Plant (LSTP). Species are listed alphabetically, with separate columns for each study site. For each species, the table reports the total number of faecal samples examined, the number of samples in which microplastics were detected, and the total number of microplastic particles recovered. Some species were sampled at both wetlands, whereas others were recorded only at DDRS. The final rows provide overall sampling totals, the total number of positive samples, the total number of microplastic particles recovered at each site, and the frequency of occurrence of microplastics. Footnotes define the abbreviations for the study sites and sampling variables.
DDRS = Densu Delta Ramsar Site; LSTP = Legon Sewage Treatment Plant; MPs = Microplastics; n1 = number of samples taken from each site; n2 = number of samples containing microplastics.
Overall, 119 of the 238 samples (50.0%) contained microplastics (MPs). Site-level analysis showed a higher frequency of occurrence (FOO) at DDRS (65.3%, 77/118 samples) compared to LSTP (35.0%, 42/120 samples). A total of 259 MPs were recorded from contaminated samples, with DDRS contributing 70.0% (n = 176) and LSTP contributing 30.0% (n = 83). There were variations in the number of MPs observed in the different species, with the Black-winged stilt, Common sandpiper, and Spur-winged lapwing accounting for 35.9%, 15.6%, and 7.3% of the total MPs. No MPs were detected in Yellow-billed kite samples (Table 2).
Species-level frequency of occurrence varied widely. The Spur-winged lapwing showed 100% occurrence of MPs in DDRS samples (n = 3), while relatively high values were also recorded for the Common tern (n = 11, 81.8%), Sanderling (n = 15, 73.3%), Grey heron (n = 18, 61.1%), and Yellow-billed egret (n = 19, 47.4%). In contrast, White-faced whistling duck exhibited a low occurrence rate of 20.8% (Table 2).
Species-level occurrence rates should be interpreted cautiously for species represented by small sample sizes (e.g., Little egret, Yellow-billed kite, and Curlew sandpiper), as these estimates may not be representative of broader population-level exposure patterns.
Four categories of microplastics were identified: fibres, fragments, films, and pellets. Fibres dominated overwhelmingly, accounting for 93.4% of all MPs (n = 259), followed by fragments (4.2%), films (1.9%), and pellets (0.4%). Fibre dominance was consistent across both sites, representing 93.2% of MPs at DDRS and 94.0% at LSTP. No pellets or films were recorded in LSTP samples (Figure 2a). Given the dominance of fibres, subsequent analyses focused on microfibre loads.
Microplastic composition and abundance: (a) Proportion of microplastic types; (b) Microfibre load per bird species; (c) Microfibre load per foraging mode; (d) Microfibre load per site; (e) Microfibre load per ecological guild; and (f) Microfibre load per bird size. DDRS = Densu Delta Ramsar Site; LSTP = Legon Sewage Treatment Plant; n = sample size; BWS = Black-winged Stilt; CoS = Common sandpiper; CT = Common tern; CuS = Curlew sandpiper; GH = Grey heron; LE = Little egret; LTC = Long-tailed Cormorant; Sal = Sanderling; SWL = Spur-winged lapwing; WFT = White-faced Whistling duck; YBE = Yellow-billed egret; YBK = Yellow-billed kite.

Figure 2. Long description
The figure comprises six panels labelled (a) to (f). Panel (a) is a grouped bar chart comparing the proportions of four microplastic types at the Densu Delta Ramsar Site (DDRS) and the Legon Sewage Treatment Plant (LSTP). The categories are fibres, fragments, films and pellets. Fibres are the tallest bars at both sites. Panel (b) consists of barcharts showing microfibre load for individual bird species at each site. Species are identified by abbreviations: Black-winged Stilt (BWS), Common Sandpiper (CoS), Common Tern (CT), Curlew Sandpiper (CuS), Grey Heron (GH), Little Egret (LE), Long-tailed Cormorant (LTC), Sanderling (Sal), Spur-winged Lapwing (SWL), White-faced Whistling Duck (WFT), Yellow-billed Egret (YBE) and Yellow-billed Kite (YBK). Separate bars are presented for DDRS and LSTP where data are available. Sample sizes are shown above the groups. Panel (c) shows barplots comparing microfibre load across three sensory foraging modes: tactile, visual and mixed. Data from DDRS and LSTP are displayed separately for each foraging mode. Panel (d) contains two barplots comparing overall microfibre load between the two study sites, DDRS and LSTP. Panel (e) shows barplots comparing microfibre load among ecological guilds. Guilds are labelled numerically according to the classifications presented in Table 1. Separate distributions are shown for each study site. Panel (f) presents boxplots comparing microfibre load among three bird size classes: small, medium and large, with separate distributions for DDRS and LSTP.
Microfibre abundance varied among sites and species. The overall mean fibre load was significantly higher at DDRS (n = 164; mean ± SE = 1.39 ± 0.15 fibres/sample) than at LSTP (n = 78; mean ± SE = 0.65 ± 0.12 fibres/sample; W = 9414, P < 0.001) (Figure 2d). At DDRS, mean microfibre loads in species ranged from 0.3 ± 0.3 to 2.7 ± 0.3 fibres per sample, while at LSTP, values ranged from 0.2 ± 0.2 to 1.5 ± 0.4 fibres per sample. Species differences in mean fibre loads were not statistically significant at DDRS (H = 14.6, d.f. = 9, P = 0.1) but were significant at LSTP (H = 18.9, d.f. = 8, P = 0.02) (Figure 2b). Post hoc analyses revealed significant differences (P < 0.05) between multiple species pairs, including higher fibre loads in Black-winged stilts (n = 32) compared to Curlew sandpipers (n = 4), Long-tailed cormorants (n = 7), Spur-winged lapwings (n = 11), White-faced whistling ducks (n = 11), and Yellow-billed egrets (n = 1).
Comparisons of shared species across sites showed no significant differences in microfibre loads for Black-winged stilt, Yellow-billed egret, Grey heron, Common sandpiper, and Long-tailed cormorant (P > 0.05 in all cases). However, Spur-winged lapwing exhibited significantly higher fibre loads at DDRS than LSTP (W = 73.5, P = 0.003) (Figure 2b).
When grouped by foraging mode, significant differences in microfibre load were observed at LSTP (H = 8.7, P < 0.05). At LSTP, mixed foragers had significantly higher loads than both tactile and visual foragers (P < 0.05). Comparisons between sites showed that both tactile and visual foragers had significantly higher fibre loads at DDRS than at LSTP (P < 0.05), while mixed foragers showed consistently high values across both sites (P > 0.05) (Figure 2c).
Birds were assigned to six ecological guilds, with no representatives of Guild 7 at LSTP. There were variations in mean fibre loads across guilds, ranging from 0.3 ± 0.3 to 2.7 ± 0.3 fibres per sample at DDRS and 0.4 ± 0.1 to 1.5 ± 0.5 fibres per sample at LSTP. Despite these variations, the differences among guilds were not statistically significant at DDRS (H = 9.9, P = 0.05) but were significant at LSTP (H = 10.1, P = 0.04). Post hoc analyses revealed significant differences among multiple guild pairs, including higher fibre loads in Guild 4 than in Guilds 1, 2, and 5. Between-site comparisons revealed significantly higher fibre loads at DDRS for Guild 2 (W = 73.5, P = 0.002) and Guild 5 (W = 226.0, P = 0.02) (Figure 2e).
Microfibre abundance was also assessed across bird size categories. At DDRS, fibre loads ranged from 1.1 ± 0.2 to 1.7 ± 0.3 fibres per sample, while at LSTP, values ranged from 0.4 ± 0.2 to 0.7 ± 0.1 fibres per sample. There was no significant difference in microfibre loads across the different size classes of birds (DDRS: H = 3.7, P = 0.16; LSTP: H = 1.5, P = 0.457). Between-site comparison showed that large and medium-sized birds had significantly higher fibre loads at DDRS than at LSTP (P < 0.05), whereas small birds showed no significant difference between sites (Figure 2f).
Colours of microfibres in samples
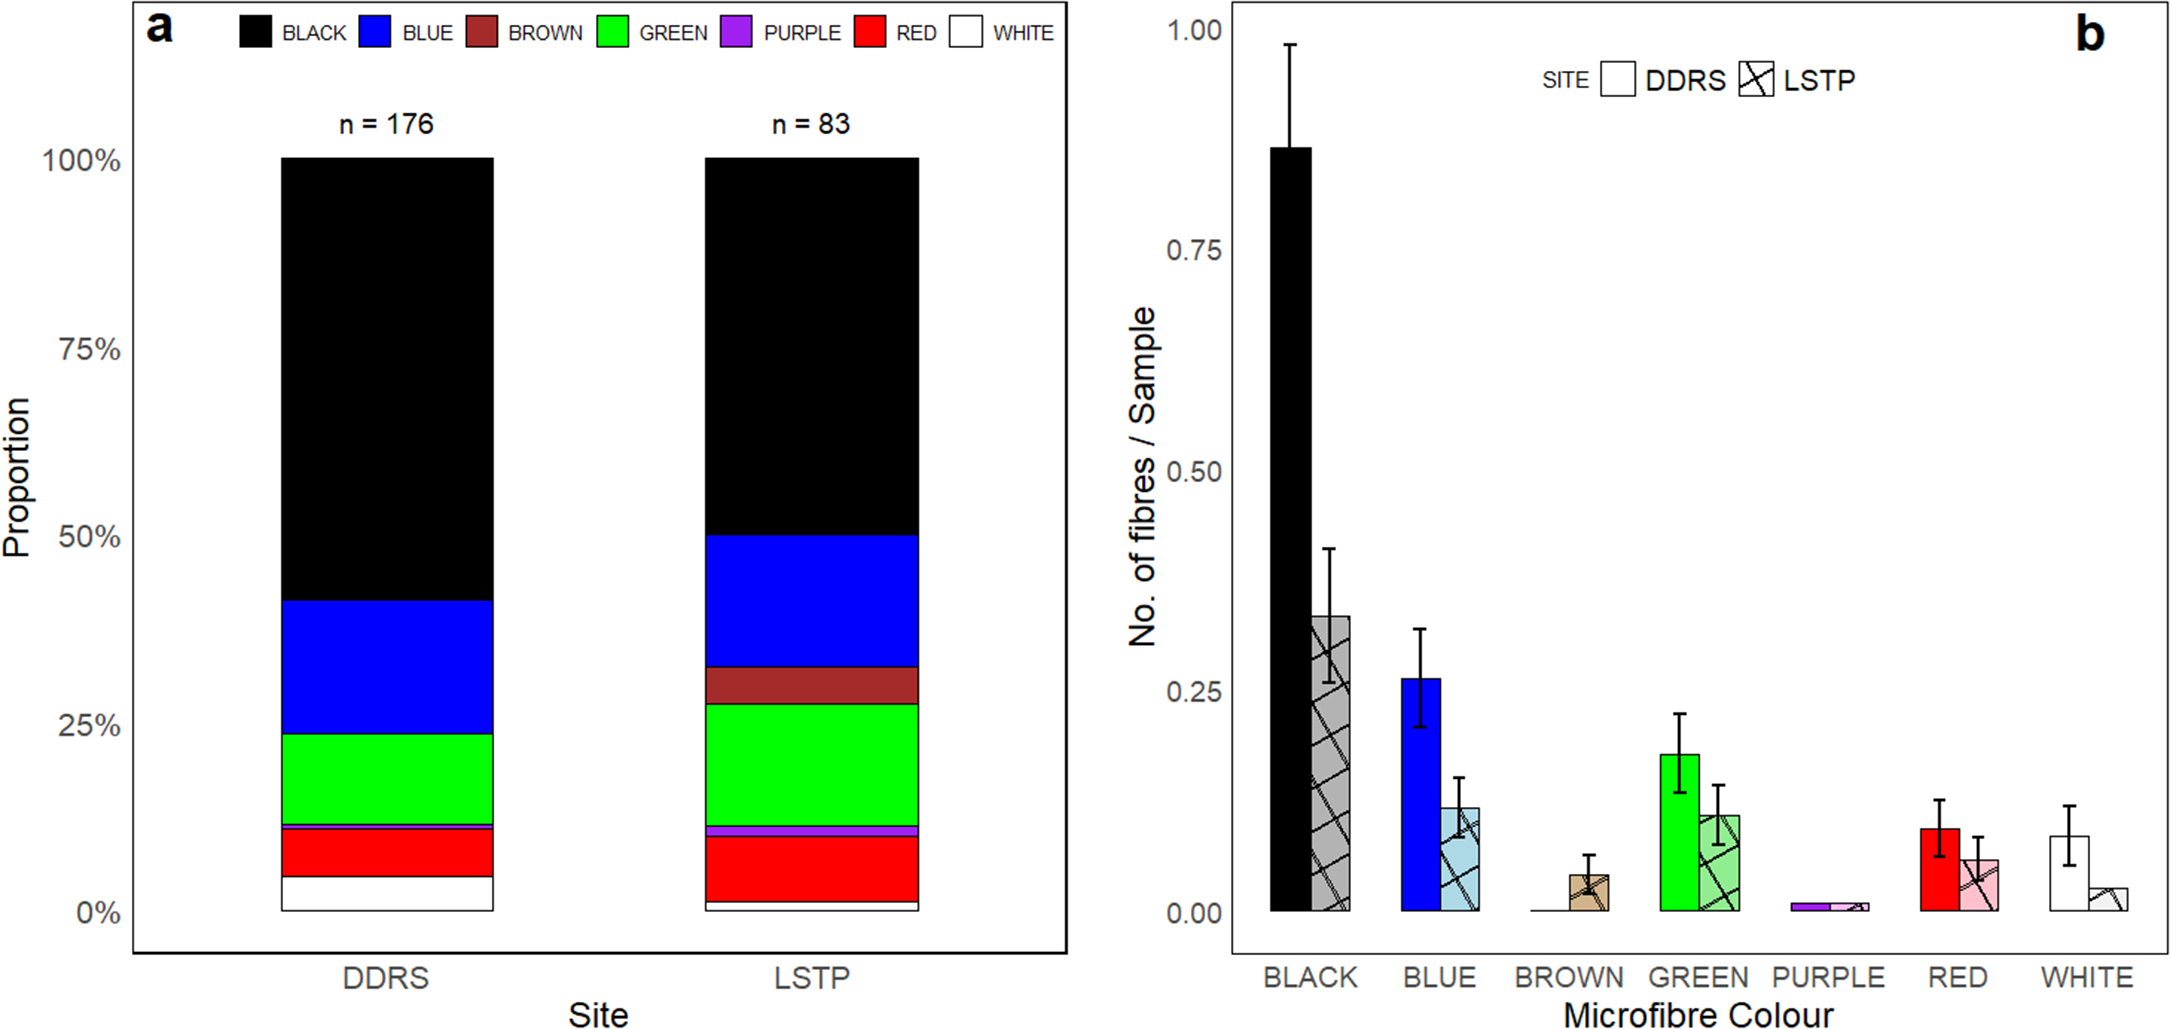
Microfibres recovered from faecal samples occurred in seven colour categories: black, blue, green, brown, red, white, and purple. Black fibres were the most abundant colour at both sites, accounting for 58.6% of all fibres observed at DDRS (n = 164) and 50.0% at LSTP (n = 78). Blue fibres were the second most abundant (17.8% at DDRS; 17.5% at LSTP), followed by green (12.1% at DDRS; 16.2% at LSTP) (Figure 3a). Other colours were comparatively rare, with purple representing the lowest proportion (≤1.3% at both sites). There were no brown fibres recorded at DDRS. Differences in colour distribution were statistically significant at both sites (DDRS: H = 179.2, d.f. = 6, P < 0.001; LSTP: H = 64.6, d.f. = 6, P < 0.001). Black fibres were significantly more abundant than all other colours, while blue fibres were more abundant than the other colours but black (P < 0.05) (Figure 3b).
Colour composition and mean abundance of microfibres in faecal samples. DDRS = Densu Delta Ramsar Site; LSTP = Legon Sewage Treatment Plant; n = sample size.

Figure 3. Long description
The figure contains two panels. Panel (a) is a grouped bar chart showing the proportion of seven microfibre colours recovered from faecal samples at the Densu Delta Ramsar Site (DDRS) and the Legon Sewage Treatment Plant (LSTP). The colours shown are black, blue, green, brown, red, white and purple. Bars for each colour are presented side by side for the two study sites. Panel (b) presents the mean abundance of the same seven fibre colours at DDRS and LSTP. Each colour category is represented separately for the two sites. Error bars indicate variation around the mean. Sample sizes for each site are indicated on the figure.
Sizes of microfibres
The length of microfibres ranged from 5.7 µm to 458.5 µm, with mean sizes of 74.5 ± 5.8 µm at DDRS (n = 164) and 63.8 ± 7.0 µm at LSTP (n = 78). Fibres smaller than 100 µm dominated at both sites, accounting for 76.2% of observations at DDRS and 78.2% at LSTP. The 100–250 µm size class represented approximately 20% of all identified fibres, while fibres in the 251–500 µm range were rare (≤3.7%) (Figure 4a). The <100 µm category consistently dominated across ecological guilds, foraging modes, and bird size classes, contributing approximately 70%–89% of fibres in each grouping (Figure 4b).
Size distribution of microfibres across (a) sites, (b) guilds, (c) foraging mode, and (d) bird size. DDRS = Densu Delta Ramsar Site; LSTP = Legon Sewage Treatment Plant; n = sample size.

Figure 4. Long description
The figure contains four panels labelled (a) to (d). Panel (a) is a grouped bar chart comparing the proportion of three microfibre size classes between the Densu Delta Ramsar Site (DDRS) and the Legon Sewage Treatment Plant (LSTP). The size classes are less than 100 µm, 100–250 µm and 251–500 µm. Panel (b) presents grouped bar charts showing the proportions of the same three size classes within each ecological guild. Guilds are labelled numerically. Separate bars are shown for DDRS and LSTP where data are available. Panel (c) presents grouped bar charts showing the proportions of the three size classes for tactile, visual and mixed sensory foraging modes. Data from DDRS and LSTP are displayed separately. Panel (d) presents grouped bar charts showing the proportions of the three size classes for small, medium and large bird size categories, with separate bars for DDRS and LSTP.
Factors affecting microfibre load in waterbirds
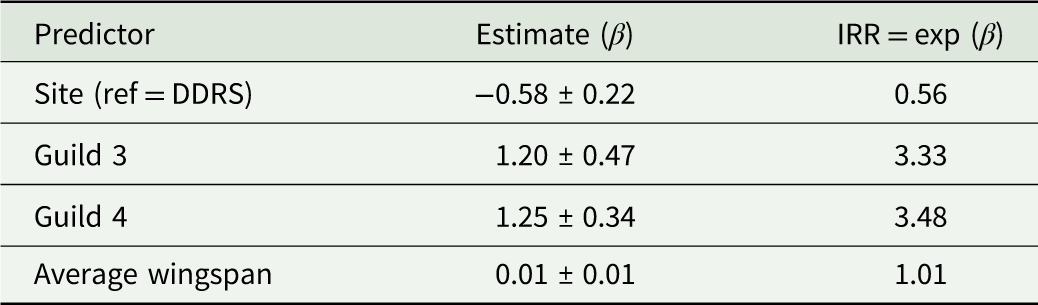
A negative binomial generalised linear model identified site, ecological guild, and average wingspan as significant explanatory variables of microfibre load. Birds sampled at LSTP had significantly lower fibre loads than those at DDRS (β = −0.58 ± 0.22, P = 0.01), corresponding to a reduction of approximately 44%. Relative to Guild 1, species in Guild 3 (β = 1.20 ± 0.47, P < 0.01) and Guild 4 (β = 1.25 ± 0.34, P < 0.001) exhibited significantly higher fibre loads, with expected abundances more than threefold greater. Average wingspan showed a positive association with fibre load (β = 0.01 ± 0.01, P = 0.03). Other predictors, including foraging mode and overall bird size class, were not retained as significant explanatory variables in the model (Table 3).
Negative binomial regression model explaining variation in microfibre load in waterbirds

Table 3. Long description
The table presents the final negative binomial regression model explaining variation in microfibre load in waterbirds. It lists the significant explanatory variables retained in the model, together with their estimated regression coefficients (β) and incidence rate ratios (IRR). The predictors include study site, ecological guild, and average wingspan. The study site uses the Densu Delta Ramsar Site (DDRS) as the reference category, against which the Legon Sewage Treatment Plant (LSTP) is compared. Guilds 3 and 4 are compared with the reference ecological guild (Guild 1). The table also reports the incidence rate ratio (IRR = exp(β)), indicating the relative change in expected microfibre load associated with each predictor. Abbreviations: DDRS = Densu Delta Ramsar Site; LSTP = Legon Sewage Treatment Plant; β = regression coefficient; IRR = incidence rate ratio.
IRR = Incidence Rate Ratio; DDRS = Densu Delta Ramsar Site.
Discussion
Microplastics were widely detected in faecal samples of waterbirds from both wetlands, indicating widespread exposure in diverse aquatic systems. The relatively high frequency of occurrence across multiple species suggests that ingestion reflects an ongoing pattern of environmental availability rather than accidental ingestion. These findings support growing evidence that waterbirds function as effective sentinels of plastic pollution through integration of cross-species exposure across habitats and trophic systems (Provencher et al. Reference Provencher, Vermaire, Avery-Gomm, Braune and Mallory2018; Wang et al. Reference Wang, Nabi, Yin, Wang, Li, Hao and Li2021).
A key result is the higher microplastic load observed at the DDRS compared to the LSTP. This challenges the expectation that engineered wastewater systems represent the dominant sources of contamination and instead highlights the role of landscape context. The Densu Delta is situated within a densely populated catchment, with intense human activity both upstream and in communities immediately surrounding the wetland. Numerous drainage channels discharge into the system, many of which are heavily polluted due to inadequate waste management and poor sanitation. These drains likely transport substantial quantities of plastic debris and microplastics into the wetland via surface runoff. In combination with tidal exchange and sediment deposition, these processes facilitate accumulation, effectively making the wetland a sink for diffuse pollution. These trends have been observed in other coastal systems where contamination is indicative of inputs throughout the catchment and not from the point source (Lourenco et al. Reference Lourenco, Serra-Goncalves, Ferreira, Catry and Granadeiro2017, Qiu et al. Reference Qiu, Xu, Huang, Wei, Z-l, Du, Jiang and Zhang2025, Sarin and Klomjek Reference Sarin and Klomjek2022). This demonstrates that protected status alone does not prevent contamination where surrounding land use is intensive.
The higher microplastic loads observed at DDRS may also reflect ecological characteristics of the wetland itself. As a Ramsar Site and Important Bird Area, DDRS supports a diverse assemblage of resident and migratory waterbirds occupying a range of ecological guilds and foraging niches (Ntiamoa-Baidu Reference Ntiamoa-Baidu1991). Although species richness was not explicitly examined as a predictor in this study, greater ecological diversity may increase the range of potential exposure pathways represented within the bird community. Similar observations have been reported from other protected and ecologically important aquatic systems, where plastic contamination persists despite conservation status because pollutants are transported and accumulated from surrounding catchments (Teampanpong and Duengkae Reference Teampanpong and Duengkae2024). Consequently, the elevated contamination observed at DDRS likely reflects a combination of landscape-scale pollutant accumulation, habitat attractiveness, and ecological heterogeneity.
Fibres dominated microplastic contamination across both sites, accounting for more than 93% of all particles recovered and far exceeding fragments, films, and pellets. This pattern indicates that microfibre pollution is the principal form of exposure in these wetlands and is consistent with global observations linking fibre contamination to domestic waste water, urban runoff, and the degradation of synthetic textiles (Acharya et al. Reference Acharya, Rumi, Hu and Abidi2021; Browne et al. Reference Browne, Crump, Niven, Teuten, Tonkin, Galloway and Thompson2011; Reynolds and Ryan Reference Reynolds and Ryan2018). The predominance of fibres suggests that diffuse anthropogenic inputs, rather than point-source releases of pellets or fragments, are the primary drivers of contamination. Their persistence in the water column and sediments may increase the likelihood of ingestion, either directly during feeding or indirectly through contaminated prey (Carbery et al. Reference Carbery, O.’Connor and Palanisami2018). Furthermore, the absence of pellets and films at LSTP supports the view that secondary, diffuse sources are more important than primary industrial inputs in driving microplastic exposure within these wetland systems.
Microfibre size and colour distributions provide additional insight into exposure pathways. The predominance of fibres smaller than 100 µm indicates that birds are exposed primarily to fine, readily ingestible particles that are widely distributed in aquatic environments. This pattern likely reflects the high environmental availability of fine microfibres and the efficient recovery of small particles by the 1 µm filtration system used in this study. Consequently, the observed size distribution should be interpreted as a combination of environmental exposure patterns and methodological recovery efficiency. The dominance of black and blue fibres is consistent with sources such as synthetic textiles and fishing materials (Lusher et al. Reference Lusher, Mchugh and Thompson2013).
Although some variation in microplastic occurrence and abundance was observed among species, species-level differences were not always pronounced, and several species were represented by relatively small sample sizes. Consequently, occurrence rates and interspecific comparisons for these taxa should be interpreted with caution, as limited sample sizes may have reduced the precision and generality of species-level estimates. Future studies employing larger and more balanced sample sizes across species would enable more robust assessments of interspecific variation in microplastic exposure and help distinguish species-specific patterns from broader ecological trait effects.
Variation in microfibre load among species highlights the role of ecological traits in mediating exposure. Although species-level differences were not always pronounced, ecological guild emerged as an important determinant of ingestion, with Guilds 3 and 4 showing substantially higher loads. This suggests that functional ecology offers a more robust framework for understanding exposure than taxonomy alone, consistent with studies showing that feeding ecology and habitat use strongly influence microplastic ingestion in aquatic birds (Porter et al. Reference Porter, Godbold, Lewis, Savage, Solan and Galloway2023; Reynolds and Ryan Reference Reynolds and Ryan2018).
Patterns of exposure were also influenced by foraging behaviour. Species employing mixed foraging strategies consistently showed higher fibre loads than those relying solely on tactile or visual methods, indicating that exploiting multiple feeding pathways increases the likelihood of encountering microplastics. Exposure may occur directly through ingestion from water and sediment or indirectly via contaminated prey, as documented in aquatic food webs (Bhatt and Chauhan Reference Bhatt and Chauhan2023). The interaction between foraging strategy and site-level contamination is particularly evident at DDRS, where higher environmental loads appear to amplify exposure across feeding groups.
The positive relationship between wingspan and microfibre load indicates that species traits related to body size and ecology may further influence contamination levels. Larger birds may ingest more microplastics due to greater food intake, wider foraging ranges, or differences in trophic position, consistent with general ecological scaling relationships (Jâms et al. Reference Jâms, Windsor, Poudevigne-Durance, Ormerod and Durance2020, Peng et al. Reference Peng, Zheng, Liu, Fan, Tang and Xiong2018). However, the absence of clear patterns across categorical size classes of birds suggests that continuous traits better represent variation of exposure.
Furthermore, because multiple samples were obtained from some species, species-level non-independence was not explicitly modelled. Future studies employing larger and more balanced sample sizes across species should consider mixed-effects models that include species as a random effect to account for repeated sampling within taxa.
Overall, these findings demonstrate that microplastic ingestion in waterbirds is shaped by the interaction between environmental availability and species-specific ecological traits. The higher contamination observed in the natural wetland, together with strong fibre dominance and trait-mediated variation, indicates that exposure is governed not only by pollution sources but also by how organisms interact with contaminated environments. Faecal analysis provides a non-invasive means of assessing recent exposure, although reliance on visual identification may underestimate smaller particles and preclude polymer confirmation.
Conclusion and recommendations
This study provides baseline evidence of microplastic contamination in waterbirds from two contrasting wetland systems in Ghana and demonstrates that exposure is both widespread and variable across ecological contexts. Contrary to expectations, the natural Densu Delta Ramsar Site exhibited higher microplastic loads than the constructed sewage wetland, suggesting that natural wetlands can serve as sinks for diffuse pollution originating from densely populated, poorly managed catchments. Microfibres dominated the recovered particles, with black and blue fibres and particles smaller than 100 µm most prevalent, suggesting potential inputs from common environmental sources, although the specific origins of these particles could not be determined in the absence of polymer characterisation.
Patterns of ingestion varied among species, ecological guilds, and foraging strategies, with guild identity and wingspan emerging as important predictors of microfibre load. These findings highlight the role of ecological traits in shaping exposure and suggest that trait-based approaches may improve predictions of vulnerability in wildlife. The hypothesis regarding foraging behaviour received partial support. Although mixed foragers consistently exhibited relatively higher microplastic loads, the effect was statistically significant only at LSTP and not DDRS. This suggests that the influence of foraging behaviour on microplastic exposure may be context-dependent and mediated by local environmental contamination levels and exposure pathways.
The use of faecal samples provides a practical, non-invasive method for monitoring microplastic ingestion in birds and supports their use as bioindicators in tropical wetland ecosystems. However, methodological limitations, including reliance on visual identification and the lack of polymer confirmation, suggest that reported values are likely conservative. Future studies should incorporate spectroscopic techniques such as FTIR or Raman spectroscopy to improve polymer identification and source attribution. In addition, integrating measurements of microplastics in sediments, water, and prey items would help clarify the pathways driving ingestion.
From a management perspective, efforts to reduce microplastic contamination should prioritise controlling plastic inputs at the catchment scale, particularly in densely populated areas surrounding wetlands. Improving waste management infrastructure and reducing plastic leakage into drainage systems will be critical for limiting transport into aquatic ecosystems. Routine monitoring programmes should adopt integrated approaches that include multiple environmental compartments and biological indicators to better capture the dynamics of contamination.
Overall, this study contributes to the limited body of knowledge on microplastic pollution in West African wetlands and highlights the need for ecosystem-based strategies to address this emerging environmental challenge.
Supplementary material
The supplementary material for this article can be found at https://doi.org/10.1017/S0266467426100698.
Acknowledgements
We acknowledge the management of the Legon Sewage Treatment Plant and Panbros Salt Industry Limited, as well as the leaders and residents of Weija and surrounding communities, for their administrative and logistical support. We are also grateful to the Wildlife Division of the Forestry Commission of Ghana and the Department of Animal Biology and Conservation Science of the University of Ghana for their institutional support. We sincerely appreciate the time and commitment of students, teaching and research assistants who contributed to field data collection and laboratory analyses. Special thanks to Alfred, Emmanuel, and Frank for their invaluable field assistance.
Author contribution
Conceptualisation: Jones K. Quartey, Erasmus H. Owusu. Data management and analysis: Jones K. Quartey, Kingsley Fianu, Maryam Said Boakye, Kwaku Kyei-Mensah, Nicholas Nartey Badger. Investigation: Jones K. Quartey, Kingsley Fianu, Maryam Said Boakye, Kwaku Kyei-Mensah, Nicholas Nartey Badger. Writing – original draft: Jones K. Quartey, Kingsley Fianu, Maryam Said Boakye, Kwaku Kyei-Mensah. Writing – review and editing: Jones K. Quartey, Erasmus H. Owusu, Nicholas Nartey Badger.
Financial support
This research received no specific grant from any funding agency, commercial or not-for-profit sectors.
Competing interests
The authors declare none.





 Open access

