I. INTRODUCTION
Titanium (Ti) is widely used in artificial joints because of its high fracture toughness and good biocompatibility. However, Ti does not bond to living bone and thus its fixation relative to the surrounding bone is not stable over the long term. Several methods have been developed to impart bone-bonding ability to Ti. Reference Kim, Miyaji, Kokubo and Nakamura1–Reference Shozui, Tsuru, Hayakawa and Osaka5 In general, bioactive materials in the body bond to living bone through a hydroxyapatite (HAp) layer. HAp formation is a complex process that involves controlled nucleation and growth from an aqueous solution. Since negatively and positively charged surfaces can induce HAp formation, the generation of HAp initiated via calcium or phosphate ion adsorption upon complexation with negatively or positively charged surfaces, respectively, may be the dominant process. Once HAp nuclei are formed, they grow by the uptake of calcium and phosphate ions from surrounding body fluids.
Wang et al. was able to improve the HAp-forming ability of Ti through the formation of a surface scale produced by the oxidation of Ti.
Reference Wang, Yan, Hayakawa, Tsuru and Osaka6–Reference Xie, Liu, Huang, Ding and Chu8
Recently, we have shown that the heat treatment of Ti in a nitrogen atmosphere with a precisely regulated oxygen partial pressure
 $\left( {{P_{{{\rm{O}}_2}}}} \right)$
of 10−14 Pa at 973 K for 1 h (treatment A) forms a scale containing rutile-type TiO2 with strongly enhanced HAp formation potential compared to that of the scale obtained in air with a
 ${P_{{{\rm{O}}_2}}}$
of 104 Pa (treatment B).
Reference Hashimoto, Kashiwagi and Kitaoka9
The HAp formation kinetics on this scale, described using the Avrami–Erofeev equation, exhibit a significant dependence on the
 ${P_{{{\rm{O}}_2}}}$
in the nitrogen atmosphere. Following treatment A, the Avrami index for the scale was n = 2 when immersed in a simulated body fluid (SBF) with ion concentrations nearly equal to those in human blood plasma and serving as the medium for HAp nucleation at 309.5 K. This value implies the instantaneous nucleation of HAp, which proceeds to completely cover the scale surface in a short time span. In contrast, in the case of treatment B, the Avrami index for the scale was n = 3, indicating that the HAp nuclei were sparsely distributed and formed at a constant rate, taking a long time to cover the scale surface.
Reference Hashimoto, Hayashi and Kitaoka10
To examine the relationship between the type of scale and its HAp forming ability, the scale surfaces have been analyzed using x-ray photoelectron spectroscopy (XPS) and zeta potential measurements. The surface charges on scales formed using treatment A were found to be highly positive, with a zeta potential of approximately 20 mV, whereas the scales formed with treatment B had zeta potentials close to zero. The XPS-N1s spectra of the surfaces of scales formed with treatment A suggested the presence of rutile-type TiO2 containing nitrogen (N). However, the state of the N and the origin of the positive zeta potential were not determined.
Applying a statistical signal processing technique to spectrum imaging datasets obtained by scanning transmission electron microscopy (STEM) combined with electron energy loss spectroscopy (EELS), particularly core state excitation spectral energy-loss near edge structure (ELNES) analyses, can resolve the overlapping spectral components, thereby visualizing the spatial distribution of each different chemical state as a relative concentration map on the nanolevel. Reference Muto, Yoshida and Tatsumi11–Reference Muto, Tatsumi, Sasaki, Kondo, Ohsuna, Horibuchi and Takeuchi13
In the present study, the presence and microstructure of N in the scales formed by treatments A and B were precisely determined by applying this statistical signal processing technique to STEM-EELS data, comparing the experimental and theoretical N-K edge ELNES spectra of the TiO2 layer. The cause of the significant positive charge on the outermost surface of the treatment A scale and the associated acceleration of HAp formation are discussed based on the resulting information.
II. MATERIALS AND METHODS
A. Scale formation
A commercially obtained sample of pure Ti (>99.9%, Nilaco Co., Tokyo, Japan) with dimensions of 10 × 10 × 1 mm was used. The surface of the Ti was polished with a mirror plane and subsequently cleaned with acetone, 2-propanol, and distilled water in an ultrasonic bath for 30 min intervals. The Ti was then placed in a furnace, the atmosphere of which was replaced with
 ${P_{{{\rm{O}}_2}}}$
-controlled nitrogen (N2) gas (
 ${P_{{{\rm{O}}_2}}}$
= 10−14 Pa) using a solid-state electrochemical oxygen pump system. The gas flow rate in this apparatus was 3 × 10⁻⁴ m3/min. The Ti was heated from ambient to 973 K at a rate of 5 K/min and then held at this temperature for 1 h, maintaining a
 ${P_{{{\rm{O}}_2}}}$
value of 10−14 Pa in the nitrogen atmosphere, representing treatment A. Finally, the Ti was cooled to room temperature at a rate of 5 K/min. Treatment in a commercially obtained simulated air mixture was also performed for comparison purposes, representing treatment B. The heating process applied during treatment B was the same as that during treatment A, while the
 ${P_{{{\rm{O}}_2}}}$
value throughout treatment B was 104 Pa.
B. Secondary ion mass spectrometer (SIMS) analysis
The N and O depth profiles in the scales formed by treatments A and B were determined using a PHI ADEPT1010 SIMS (UVLAC-PHI, Chigasaki, Japan), employing a Cs+ primary ion beam at a 5 kV impact voltage for sputtering.
C. STEM-EELS spectral imaging and multivariate curve resolution (MCR) analysis
In preparation for STEM-EELS analyses, cross-sectional specimens were prepared by argon milling (GATAN model 691, Gatan Inc., Pleasanton, California) of samples to a depth of approximately 20 μm below the surface of the scales formed by treatments A and B. STEM-EELS spectral imaging data were acquired at room temperature using a JEOL JEM 2100 STEM system (JEOL Ltd., Akishima, Japan) for the high energy region (including O-K, N-K, and Ti-L2,3 edges). This instrument was equipped with a Gatan Enfina 1000 spectrometer (Gatan Inc.) with a probe size of 2 nm, and an acquisition time of 0.5 s and a scan step of 5 nm were applied. Reference Kojima, Muto, Tatsumi, Kondo, Oka, Horibuchi and Ukyo14,Reference Muto, Tatsumi, Kojima, Oka, Kondo, Horibuchi and Ukyo15 The energy dispersion was set to 0.3 eV/channel with an energy loss range from 370 to 570 eV. Spectral drift correction, pre-edge background subtraction and deconvolution to remove plural scattering were all performed.
Spectral image datacubes were obtained by scanning the nanosized electron probe over wide areas of the sample of interest and analyzing the resulting data using the statistical MCR method to extract the embedded spectral components and map their two-dimensional spatial distributions. Reference Muto, Yoshida and Tatsumi11–Reference Muto, Tatsumi, Sasaki, Kondo, Ohsuna, Horibuchi and Takeuchi13
D. Theoretical N-K ELNES calculations
Theoretical ELNES spectra for possible nitrogen-related defects in rutile-type TiO2 [denoted as (X)i(V): X (defect species) = N, N2, NO, NO2, i (occupying site) = O (oxygen site) or I (interstitial site) and V (effective charge of the defect) = −2 to +3, varying with the possible electron occupancies of the induced band-gap states] were calculated by the pseudopotential plane wave band method within the generalized gradient approximation [GGA Reference Perdew, Burke and Ernzerhof16 ; Cambridge serial total energy package (CASTEP) code Reference Clark, Segall, Pickard, Hasnip, Probert, Refson and Payne17 ]. This allowed comparison of the relative peak intensities and positions of the experimental and theoretical spectra. A 2 × 2 × 3 supercell consisting of a primitive cell containing 72 atoms of the rutile structure per supercell with a core hole introduced at the excited atom was used. Prior to the spectral calculations, the structural parameters were optimized using the same software package. The atom positions were freely relaxed while applying the constraints of the given symmetry of the supercell within the fixed supercell size until the residual force was reduced to less than 0.05 eV/Å. The final ELNES spectrum was broadened using three functions; a Gaussian function with a full width at half maximum of Γ = 1.0 eV, a Lorentzian function with Γ = 0.18 eV, and a Lorentzian function with Γ = 0.1E, where E is an energy value above the threshold. These three functions correspond to instrumental broadening, core-hole lifetime broadening and excited electron lifetime broadening, respectively. As an accuracy check, it was confirmed that the relative peak energy positions calculated using the CASTEP and WIEN2k codes (via the all electron full potential method) deviated by less than 1 eV. Reference Blaha, Schwarz, Madsen, Kvasnicka and Luitz18
III. RESULTS AND DISCUSSION
A. Ti, O, and N distributions in scales
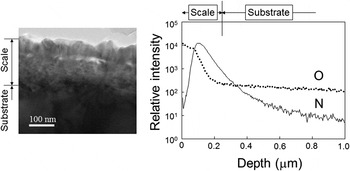
Figure 1 presents a cross-sectional transmission electron microscopy (TEM) image and the N and O SIMS depth profiles for the scale formed by treatment A. Here, the SIMS intensities are normalized to that for Ti. It is evident that the thickness of the scale formed on the Ti is approximately 200 nm, and that it has a double layered structure, primarily consisting of O-rich columnar crystals at the surface side and fine N-rich crystals at the substrate side. The thin-film x-ray diffraction pattern for the scale surface in a previous study Reference Hashimoto, Hayashi and Kitaoka10 and the TEM electron diffraction pattern of the cross-section of the scale in the present study identify these O-rich and N-rich layers as rutile-type TiO2 and TiN, respectively. Using the FactSage free-energy minimization computer code together with the FactPS and FToxid databases, the equilibrium partial pressure of O2 at the interface between the TiO2−x and TiN was calculated thermodynamically to be 10−23 Pa at 973 K. Consequently, the TiN layer is believed to have formed at the interface by the inward diffusion of N into the scale and the simultaneous reduction of the oxygen chemical potential (μO).
Cross-sectional TEM image (left) and N and O SIMS depth profiles (right) through the scale formed by treatment A. The SIMS intensities have been normalized to the Ti intensity.

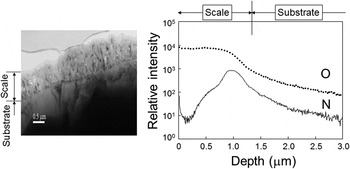
Figure 2 shows a cross-sectional TEM image and N and O SIMS depth profiles for the scale formed by treatment B. This scale was about 1–2 μm thick and also had a layered structure composed of rutile-type TiO2 at the surface side and TiN closer to the substrate. However, the N/Ti ratio of the interface near the substrate in the TiO2 formed by treatment B was obviously less than that in the treatment A scale.
Cross-sectional TEM image (left) and N and O SIMS depth profiles (right) through the scale formed by treatment B. The SIMS intensities have been normalized to the Ti intensity.

B. Spatial distributions of product phases in the scale
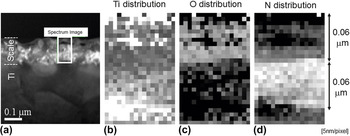
The cross section of the scale formed by treatment A [Fig. 3(a)] was examined by STEM-EELS spectral imaging, and the Ti, O, and N elemental distributions throughout the framed area in Fig. 3(a) were determined, as shown in Figs. 3(b)–3(d). In these images, pores are evident approximately 30 nm below the surface in the middle of the upper TiO2 layer. This suggests that the fluxes associated with the outward diffusion of Ti ions and the inward diffusion of oxygen ions through the TiO2 layer were drastically increased at this position. This divergence of the ion fluxes is likely related to void formation, and similar behavior has been reported in the case of NiO and CoO scales formed on the corresponding metals. Reference Akiba, Ueda, Kawamura and Maruyama19,Reference Akiba, Ueda, Kawamura and Maruyama20
Depth-resolved (b) Ti, (c) O, and (d) N distributions in the scale formed by treatment A, obtained by scanning the framed area in (a) STEM image (5 nm/pixel).

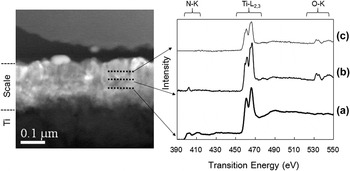
Considering the elemental distributions, the most likely phases are the metallic titanium substrate, followed by TiN and TiO2 moving from bottom to top, although the top oxide layer also contains a small amount of nitrogen. This is consistent with the N-K, Ti-L2,3, and O-K ELNES profiles presented in Fig. 4(b), extracted from the depth regions indicated by the solid broken lines in Fig. 4(a). It is also noteworthy that the nitrogen concentration of the top oxide layer is not uniform, but rather decreases when approaching the surface.
STEM image (left) and depth-resolved Ti-L2,3, O-K, and N-K edge ELNES spectra (right) of a cross-section of the scale formed by treatment A.

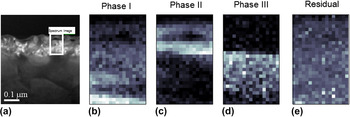
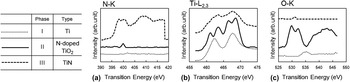
To visualize the distributions of phases rather than elements, an MCR technique based on non-negative matrix factorization Reference Muto, Yoshida and Tatsumi11–Reference Muto, Tatsumi, Sasaki, Kondo, Ohsuna, Horibuchi and Takeuchi13 was applied to the same three sets of electron energy loss (EEL) spectral data shown in Fig. 4, the results of which are provided in Fig. 5. Judging from the random statistical noise in the residual components, three significant phases were identified, and their spectral profiles are shown in Fig. 6. As predicted from the elemental maps in Fig. 4(b), phases I, II, and III can be identified, consisting of metallic titanium, nitrogen-doped TiO2, and slightly oxidized TiN.
Three component MCR analysis of the scale formed by treatment A: (a) STEM image of the scale, and spatial distribution maps from the framed area in (a) showing (b) phase I, (c) phase II, (d) phase III, and (e) the residual phase.

(a) N-K, (b) Ti-L2,3, and (c) O-K edge ELNES spectra of the extracted spectral components of phases I, II, and III in the scale formed by treatment A. Each spectrum has been offset vertically to allow easier comparison.

The chemical state of nitrogen in the top layer of the treatment A scale can be considered by focusing on the N-K ELNES data for phase II, presented in Fig. 6(a). Because of its low concentration (∼1 at.%), the spectral profile exhibits some noise features although it can be characterized by the distinct sharp peak around 400 eV. The chemical states associated with the spectral features can be discussed based on first principles theoretical simulations using several conceivable structural models.
Figure 7 shows the experimental and theoretical N-K ELNES spectra of the N-doped TiO2 formed by treatment A. The theoretical energy loss axis was corrected so that the onsets of the experimental and theoretical N-K spectra of TiN (not shown here) were coincident, and the theoretical (N2)O(+2) spectrum was shifted by the same relative energy difference. The signal at 400 eV in the experimental spectrum is consistent with that in the theoretical (N2)O(+2) spectrum, in which N2 was substituted at the oxygen site in TiO2 and had an effective charge of +2. Treatment A facilitates the formation of oxygen vacancies in the surface TiO2 layer. These vacancies are known to behave as shallow donors in TiO2 at room temperature
Reference Janotti, Franchini, Varley, Kresse and Van de Walle21,Reference Brant, Giles, Yang, Sarker, Watauchi, Nagao, Tanaka, Tryk, Manivannan and Halliburton22
and may thus account for the positive surface charge of +2. However, the HAp-forming ability of the TiO2 surface formed by treatment A was higher than that of the TiO2 surface formed by heat treatment of Ti under a
 ${P_{{{\rm{O}}_2}}}$
of 10−14 Pa in an argon atmosphere at 973 K (our unpublished data). For this reason, doping with N is considered to be an important factor contributing to the enhanced HAp-forming ability of the TiO2 surface resulting from treatment A. Thus, the positive charge of (N2)O(+2) is thought to be responsible for the significant positive surface charge of the scale formed by treatment A. As noted, HAp formation is a complex process that involves controlled nucleation and growth from an aqueous solution. Once HAp nuclei form, they grow through the uptake of calcium and phosphate ions from the surrounding solution. In general, nucleation in an SBF supersaturated with HAp can be divided into two types: homogeneous nucleation occurring spontaneously in the solution and heterogeneous nucleation on a foreign substrate. Previous studies have shown that the SBF can induce heterogeneous nucleation and the growth of HAp when in contact with foreign surfaces and it is important to determine whether the calcium or phosphate ions initiate the first nucleation steps. If it is calcium ion adsorption that triggers nucleation, we can assume that the surface would be negatively charged whereas, if phosphate ion adsorption is the initial step, the surface would likely be positive. In our previous study, during which N-doped TiO2 formed by treatment A was immersed in an SBF, the sequential adsorption of calcium and phosphate ions was examined by time-of-flight SIMS
Reference Hashimoto, Hayashi and Kitaoka10
and phosphate was found to adsorb first, followed by calcium. Therefore, it is the positively charged surface attributed to the concentrated (N2)O(+2) ions at the surface of the scale that effectively promotes the formation of HAp nuclei.
(a) Experimental and [(b)–(g)] theoretical N-K ELNES spectra obtained in the vicinity of the surface of the scale formed by treatment A. The effective charge is indicated on each theoretical spectrum.

It has been reported that N will substitute at the oxygen site (N)O in TiO2, with a resulting effective charge of −1 in the N-doped TiO2, which subsequently exhibits high photocatalytic activity. Reference Varley, Janotti and Van de Walle23–Reference Chen, Cao, Lin and Gao33 The N configuration in this N-doped photocatalyst was obviously different from that in the N-doped TiO2 with significant HAp forming ability generated in the present study. Thus, treatment A can effectively promote HAp formation, but does not produce photocatalytic activity.
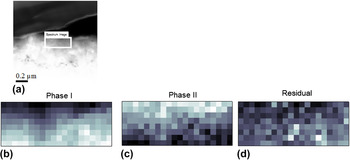
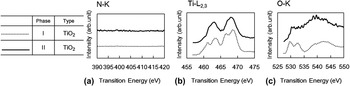
The results of the two-component MCR analysis of the subsurface scale formed by treatment B are summarized in Fig. 8, in which two significant components are identified. The spectral profiles of these phases are shown in Fig. 9. Both phases I and II can be identified as rutile-type TiO2, containing no N atoms. It should also be noted that the oxygen content in the subsurface scale formed by treatment B was apparently higher than that in the treatment A scale. The subsurface scale without N is considered to represent a zero charge surface. In this case, Ti–OH groups formed on the TiO2 in the SBF at a pH value of 7.4. These Ti–OH groups, which are neither negatively nor positively charged, are predicted to be much less active with regard to promoting the growth of HAp on the scale.
Two-component MCR analysis of the scale formed by treatment B: (a) STEM image of the scale, and spatial distribution maps from the framed area in (a) showing (b) phase I, (c) phase II and (d) the residual phase.

(a) N-K, (b) Ti-L2,3, and (c) O-K edge ELNES spectra of the extracted spectral components of phases I and II in the subsurface scale formed by treatment B. Each spectrum has been offset vertically to allow easier comparison.

Our study indicates that positively charged N-doped TiO2 scale is formed by treatment A (Figs. 5 and 6) while zero-charge TiO2 scale results from treatment B (Figs. 8 and 9). The N-doped TiO2, in which N2 is substituted at the oxygen sites in TiO2 and that has an effective charge of +2, provides a surface that promotes HAp formation (Fig. 7). This positively charged surface obtained by treatment A evidently promotes HAp formation by the initial complexation of phosphate ions and subsequent complexation of calcium ions. In contrast, TiO2 from treatment B does not contain N, has a nonionic surface, and only weakly induces HAp formation. The potent HAp formation capability experimentally observed in the case of the positively charged surface apparently results from the complexation of phosphate ion with the positively charged surface and the subsequent complexation of calcium ions.
IV. CONCLUSIONS
The microstructures of scales formed on Ti substrates by heat treatment either in a N2 atmosphere containing extremely low oxygen partial pressure
 $\left( {{P_{{{\rm{O}}_2}}}} \right)$
or in air were analyzed by SIMS, STEM, and EELS. The scale obtained under a low
 ${P_{{{\rm{O}}_2}}}$
in N2 exhibited high HAp forming ability and was composed primarily of a rutile-type N-doped TiO2 layer at the surface side and a TiN layer at the substrate side. Comparing the experimental and theoretical N-K ELNES spectra of the N-doped TiO2, N was found to have substituted oxygen sites in the TiO2, providing an effective charge of +2. The high HAp forming ability of the scale is likely attributable to the positively charged surface induced by the presence of N in the TiO2 layer. In contrast, the subsurface scale formed by heat treatment in air, that did not contain N in the subsurface, was considered to have a neutral surface and was much less active with regard to the formation of HAp.
ACKNOWLEDGMENTS
This work was supported in part by a Grant-in-Aid for Scientific Research on Innovative Areas “Nano Informatics” (Nos. 25106008 and 25106004) and by a Kibankenkyu A grant (No. 26249096) from the Japan Society for the Promotion of Science (JSPS).