




No CrossRef data available.
Neuropsychological profile of Italians with Williams syndrome: An example of a dissociation between language and cognition?
Published online by Cambridge University Press: 01 October 2004
Abstract
Important claims have been made regarding the contrasting profiles of linguistic and cognitive performance observed in two genetically based syndromes, Williams syndrome (WS) and Down syndrome (DS). Earlier studies suggested a double dissociation, with language better preserved than nonverbal cognition in children and adults with WS, and an opposite profile in children and adults with DS. More recent studies show that this initial characterization was too simple, and that qualitatively different patterns of deficit observed within both language and visual–spatial cognition, in both groups. In the present study, large samples of children and adolescents with WS and age-matched DS are compared with typically developing (TD) controls matched to WS in mental age, on receptive and expressive lexical and grammatical abilities, semantic and phonological fluency, digit span and nonverbal visual–spatial span, and on 2 visual–spatial construction tasks. Study 1 confirmed distinct profiles of sparing and impairment for the 2 groups, within as well as between language and nonlinguistic domains, even after IQ variations were controlled. In Study 2 we compared performance of the children, adolescents and young adults with DS and WS included in the first study, divided on the basis of the chronological age of the participants (under 8 years; over 12 years). Although it is important to stress that these are cross-sectional rather than longitudinal data, the results demonstrated that the profile of younger children is different in respect to those of the older children; initial states of the system cannot be inferred by the final state. Possible neural substrates for these profiles and trajectories are discussed. (JINS, 2004, 10, 862–876.)
Information
- Type
- Research Article
- Information
- Journal of the International Neuropsychological Society , Volume 10 , Issue 6 , October 2004 , pp. 862 - 876
- Copyright
- © 2004 The International Neuropsychological Society
INTRODUCTION
The scientific debate in developmental neuropsychology regarding the relationship between language and cognition has received, in the last decade, new evidence from studies conducted in special populations. Williams syndrome (WS), one of those more extensively investigated, is a rare genetic syndrome (the incidence is estimated to be 1:25,000 live births) caused by a microdeletion of the long arm of chromosome 7q11.23 (Bellugi & St. George, 2001; Botta et al., 1999; Ewart et al., 1993; Frangiskakis et al., 1996). Children with WS often have infantile hypercalcemia, delays in growth and in psychomotor development, facial dysmorphism, congenital malformations mostly in the cardiovascular system, and some degree of cognitive impairment (Arnold et al., 1985; Bellugi et al., 1990; Udwin & Yule, 1990).
WS has received a great deal of attention recently because of its particular cognitive profile. Several authors have noted that aspects of language development are relatively proficient, while visual–spatial processing ability, counting, planning, and implicit learning are severely impaired (Atkinson et al., 2001; Bellugi et al., 2001, Vicari et al., 2001). This sort of cognitive dissociation becomes even more evident when the performance of children with WS is compared, not only with that of typically developing children of the same mental age, but also, and above all, with those of other children with mental retardation of a different nature, for example Down syndrome (trisomy 21, DS). Comparisons with the latter are especially interesting because the cognitive profile of children with DS seems to mirror that of WS syndrome children: deficits in language abilities that often exceed impairments in visual–spatial abilities.
Several recent studies suggest, however, that a characterization of the cognitive profiles of WS children in terms of a dissociation between language and visual–spatial abilities is too simplistic. Studies from different laboratories have demonstrated a more complex neuropsychological profile in this population, with atypical development not only in the cognitive but also in the linguistic domain (Gosh et al., 1994; Karmiloff-Smith et al., 2003; Pezzini et al., 1999; Vicari et al., 1996b; Volterra et al., 1996).
Linguistic Abilities
Considering the language domain, comparative studies of adolescents with WS and DS have shown that WS participants were significantly more competent in terms of vocabulary and semantic fluency, morphological abilities, and also narrative abilities (Bellugi et al., 1990, 1996; Reilly et al., 1990; Rubba & Klima, 1991). More recent studies, however, report partially different results. A study by Klein and Mervis (1999) showed that receptive lexical abilities are equivalent for 9- and 10-year-old children when the two syndromes are matched for chronological and mental age. Another study involving large numbers of children with WS and DS in the early stages of language development (Singer-Harris et al., 1997) found that both syndrome groups are substantially and equally delayed in the onset of language. However, children with WS displayed a significant advantage over children with DS in the early stages of grammar. A study by Mervis and Robinson (2000) on groups of very young children with DS and WS, carefully matched for chronological age, confirmed that both syndromes evidence a language delay. But, in contrast with some of the results reported by Singer-Harris et al. (1997), an expressive advantage in children with WS relative to children with DS was apparent even at age 2 years, 2 months.
In a recent paper, Vicari et al. (2002) evaluated the linguistic abilities in Italian-speaking children with WS and with DS at a comparable global cognitive level (mean MA = 34 and 32 months respectively; mean CA = 58 and 67 months, respectively). A further control group was formed by typically developing children matched for mental age. In the groups no dissociation was evident between lexical and cognitive abilities, but specific morphosyntactic difficulties emerged both in comprehension and production in children with DS. Individuals with WS, albeit less compromised than DS, also exhibited difficulties in the sentence repetition task. These results demonstrated that the linguistic abilities of toddlers with WS are not above their cognitive level, and that language development in these special populations is more deviant than delayed.
All these findings seem to suggest that neuropsychological characteristics of the two syndromes may develop differently along distinct developmental trajectories. As Paterson et al. (1999) have argued, linguistic and cognitive skills in adolescents are not predictable on the basis of the pattern exhibited at younger ages and, consequently, researchers “cannot rely on phenotypic outcomes to make generalizations about impaired or intact modules in the initial state” (p. 2357). Language development of children with DS appears consistent with this theoretical framework. Despite rare exceptions (Papagno & Vallar, 2001; Rondal, 1995; Vallar & Papagno, 1993), adolescents and young adults with DS usually exhibit very poor linguistic capacities. Their spontaneous language is telegraphic with a highly reduced use of function words such as articles, prepositions, pronouns, etc. (Chapman, 1995; Fabbretti et al., 1997; Rondal et al., 1988). Verbal comprehension also usually lags behind the stage of cognitive development to which the individuals belong, even though it appears better preserved than the production domain (Miller, 1988, 1992).
In contrast with this generalized and compromised pattern observed in older children, early linguistic development in infants with DS presents some surprises, with a much less even pattern. In a recent paper, Vicari et al. (2000) explored the acquisition of language in children with DS in comparison with typically developing toddlers of the same mental age (around 30 months). At this developmental stage, the two groups are very similar in lexical production and no dissociation was evident between lexical and cognitive abilities in either group, but children with DS showed specific morphosyntactic difficulties both in comprehension and production for DS.
Visual–Spatial and Memory Abilities
Patients with DS and with WS usually exhibit distinct performance profiles in the visual–spatial domain. In these tasks, participants with DS usually perform consistently to their mental age. In contrast, a greater general difficulty on spatial constructive processing but relatively preserved visual–perceptual abilities such as, for example, facial recognition have been suggested in WS children (Bellugi et al., 1999b; Bellugi & St. George, 2001; Mervis et al., 1999; Pezzini et al., 1999). In an attempt to describe the biological bases of the spatial processing deficit, Atkinson et al. (1997) studied a group of 15 children with WS and 30 with typical cognitive development. They administered tests traditionally held to be indices of the ability to cortically process spatial characteristics (dorsal cortical stream) and visual characteristics (ventral cortical stream) of objects. The results showed that children with WS were very deficient on tests involving the structures that are believed to rely on the dorsal stream for their correct execution, although the same children were in the norm on tests involving the processing of visual information. On the basis of Atkinson et al.'s study (1997, 2003), the spatial deficit observed by many authors in children with WS can reasonably be attributed to an impairment of the dorsal cortical stream and a relative sparing of the ventral stream.
Studies from memory gave us further information about cognitive and linguistic capabilities in WS and DS, contributing to a better definition of their neuropsychological profile. In children with WS, phonological short-term memory is usually at the level of their mental age (Udwin & Yule, 1990; Vicari et al., 1996a) or higher than their mental age (Mervis et al., 1999). Furthermore, Wang and Bellugi (1994) and, more recently, Jarrold et al. (1999) demonstrated opposite patterns of memory span performance in children with DS and with WS. Namely, these authors described better verbal span in children with WS and, conversely, better visual–spatial span in children with DS. Wang and Bellugi (1994) discussed these data in light of a working memory model (Baddeley, 1986; Baddeley & Hitch, 1974) and suggested better preservation of the articulatory loop in WS children but better preservation of the visual–spatial sketchpad (a system devoted to the processing of visual–spatial data) in DS children.
Vicari et al. (1996b) investigated the contribution of phonological and semantic processes to verbal span in children with WS. In particular, they explored phonological similarity and length and frequency effects in a verbal span task in groups of children with WS and mental age-matched normal controls. The participants with WS showed normal similarity and length effects in their performance, supporting the hypothesis of relatively preserved phonological competencies in children with this syndrome. However, the authors found a reduced frequency effect in the verbal span of these participants compared to the group of normally developing children. Although both groups repeated high-frequency words better than low-frequency words, this effect was smaller in the WS group. The reduced frequency effect in these children may be the result of a rigid use of phonological recoding strategy both for high- and low-frequency words. The dissociation between normal phonological encoding and the reduced contribution of lexical–semantic encoding mechanisms to word span in children with WS is particularly interesting in light of their pattern of linguistic abilities. As we have seen, in fact, several studies demonstrated that children with WS present relatively impaired lexical–semantic abilities in the presence of well-preserved phonological processes (Grant et al., 1997; Karmiloff-Smith et al., 1997, 1998; Mervis et al., 1999; Volterra et al., 1996).
The marked difficulty WS participants have in spatial processing have been explored also in the memory domain. As reported above, it is well known that children with WS perform below children with DS in the Corsi block-tapping test (Jarrold et al., 1999; Wang & Bellugi, 1994). Recently Vicari et al. (2003) compared WS and typically developing children matched for mental age in a visual and spatial span test. The two tests involved studying the same complex, nonverbalizable figures and using the same response modality (pointing to targets on the screen). The crucial experimental variable was that in one case the position where the figure appeared on the screen had to be recalled; in the other case, the physical aspect of the figure studied had to be recalled. The results showed a different performance profile in the two groups of children. Although the normal and the WS children performed analogously in the visual span test, the spatial-span performance of the WS children was significantly lower than that of the controls. These data are consistent with the results of several other studies that documented more difficulty on tests of spatial than visual processing in children with Williams syndrome (Bellugi et al., 1999a, 1999b; Mervis et al., 1999; Pezzini et al., 1999).
Although all the data presented strongly suggest that many different dissociations can happen not only between cognition and language but also within cognition and language, many researchers still considered the uneven pattern of cognitive and linguistic abilities in WS as empirical evidence for the existence of specialized and separate cognitive modules (e.g., Piattelli-Palmarini, 2001), some of which are impaired and others preserved. The goal of the present study is to gather more detailed data on language and cognition in a large sample of Italian speakers with WS, results of a cooperative study started in 1995. Our intent is to contribute to a more precise definition of the neuropsychological profile of WS and, in particular, to investigate whether children with WS show a stable neuropsychological profile with a clear dissociation between visual–spatial and linguistic abilities, or rather, whether they show atypical profiles with peaks and valleys both in the cognitive as well in the linguistic domain. Moreover we are interested in clarifying the relationships among linguistic and nonlinguistic measures, across the life span, to obtain a deeper understanding of developmental effects and variations in developmental trajectories.
We conducted two studies. In Study 1, we compared the neuropsychological profile of participants with WS with a first control group composed of typically developing (TD) children, matched with the WS group on the basis of their mental age. We also compared data on participants with WS with those of a second control group formed by people with DS matched on the basis of both chronological and mental age. Our hypothesis is that the linguistic and cognitive patterns exhibited by children with WS are, in part, specific to this population and do not entirely result from the cognitive delay.
The second aim of this work is to explore the effect of chronological age on the cognitive and linguistic competence in patients with cognitive delay. To this aim in Study 2 we compared performance in language, memory and the visual–spatial domain of patients with WS and with DS included in Study 1, divided into two subgroups as a function of their chronological age, below 8 years or above 12 years. Our hypothesis is that the profile which characterizes the older children and adolescents with cognitive delay is, in some ways, different in respect to the profile of children at younger ages. The data presented in this study are cross-sectional rather than longitudinal, but nonetheless should highlight the fact that the cognitive and linguistic abilities of children with WS may vary when examined at different ages. Here we are interested in determining whether the profile that characterizes adult WS participants is already evident at a younger age or, alternatively, whether the behavioral phenotype varies at different points of development.
STUDY 1
Materials and Methods
Research participants
The sample consisted of 69 Italian children, adolescents and young adults with WS, matched on the basis of mental age to a group of 46 typically developing children (TD). An additional control group consisted of 56 Italian children, adolescents and young adults with DS matched, as a group, on the basis of mental age with the TD group and by mental age and chronological age with the WS group. Since we did not recruit our first group (WS) according to a sampling design balanced for age, a uniform distribution was not obtained; indeed the age distribution of WS group fitted a Gaussian distribution nicely, with very few cases at the range borders. The other TD and DS participants were MA matched and thus mental ages generally varied in a restricted range of values (between 2.7 and 7.8 years) and presented relatively small standard deviations.
The participants with WS and with DS came from the Children's Hospital Bambino Gesù of Santa Marinella, Rome and from IRCCS Eugenio Medea of Bosisio Parini. The sample was selected on the basis of the following criteria: a positive result on the fluorescent in situ hybridization (FISH) test for elastin deletion for children with WS; a free trisomy 21 documented by karyotyping for children with DS; the absence of any neurosensory deficits, such as hypoacusia or serious impairment of visus; and absence of epilepsy and psychopathological disorders. Also, all individuals lived with their own families. All the TD children exhibited normal hearing and oral–motor function, and displayed no signs of neurological impairment or psychopathological disorders. All were full-term, monolingual children, and the families were from middle social-educational class. All children, except 6, were preschoolers. The three groups of children were given the same tests. For evaluation purposes, the children with WS and those with DS were examined in the hospital on two occasions across an approximate 1-week period. The TD children were examined individually at school.
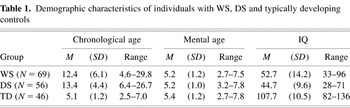
The present study has been conducted in agreement with the Italian Williams Syndrome Foundation (Associazione Italiana Sindrome di Williams). All the observations were carried out after obtaining informed consent from participants and their families. The demographic characteristics of the participants are reported in Table 1.
Demographic characteristics of individuals with WS, DS and typically developing controls

Instruments
For this study, the battery was composed of various tasks to assess general intelligence and specific abilities in different subdomains of language, visual–motor/visual–perceptual, and memory span. A short description of the tests included is reported below.
Intelligence test
The Stanford–Binet Intelligence Scale, Form L-M, edited by Terman–Merrill (Bozzo & Mansueto Zecca, 1993): This intelligence scale provides both IQ and mental age, and allowed us to use the same instrument for all participants tested, since it is validated for all the mental ages that we considered (ages 2.7–7.8 years).
Tasks for language assessment: lexicon
The Peabody Picture Vocabulary Test (PPVT; Dunn & Dunn, 1981) is a widely used test, selected to provide a reliable measure of lexical comprehension. The Boston Naming Test (BNT; Nicholas et al., 1989) is a measure of lexical production, elicited by pictures.
Tasks for language assessment: morphosyntax
The Grammar Comprehension Test (GCT; Rustioni, 1994) is a measure of morphology/syntax comprehension, assessed by choosing the correct picture among four alternatives after listening to a sentence. The Phrase Repetition Test (PRT) is actually a word and phrase repetition test. It is designed to ascertain children's ability to imitate verbal stimuli, particularly their morphological and syntactic aspects. There are two versions of this test: one for assessing morphology/syntax production in smaller children with a visual support (mental age 2–4 years: Devescovi & Caselli, 2001; Devescovi et al., 1992) and another for assessing morphology/syntax production in older children (mental age above 4 years: Vender et al., 1981). The evaluation consisted of the total number of phrases repeated correctly out of the total number of phrases repeated.
Tasks for language assessment: verbal fluency
This task is organized into two different subtests. The categorical subtest (CAT) assesses verbal fluency with a semantic cue that asks participants to recall all the words they can think of within a fixed time limit within each of three categories: animals, clothing, and food (Riva et al., 2000). The phonological subtest (FAS) assesses verbal fluency when a phonemic cue is provided, asking participants to produce as many words as they can think of in a fixed time limit that begin with a particular letter (F-A-S) (Riva et al., 2000).
Test for assessing short-term memory abilities
In the Digit Forward Span Test (Orsini et al., 1987), the examiner reads aloud a list of two digits at a rate of 1 digit/s and the child was required to repeat the list in the same order. If he succeeded, lists of digits of increasing length were presented; if the child failed on a list, a second list of the same length was presented; and if the child was successful, a list 1 digit longer was then presented. However, if the child also failed on the second list, the test was stopped. The span was established as the length of the last list recalled correctly.
The spatial forward span was established according to the procedure devised by Corsi (Orsini et al., 1987). The experimental apparatus consists of a board, 25 × 35 cm, on which nine blocks (4 cm each side) are fixed in a well-defined spatial arrangement. A serial number identifying each block was visible only to the examiner. Initially, the examiner touched a sequence of two blocks at a rate of 1 block/s. Immediately following the presentation, the child was asked to touch the blocks in the same order. If he succeeded, sequences of blocks of increasing length were presented by the examiner. As before, if the child failed on a sequence, a second sequence of the same length was presented and, if the child was successful, a sequence 1 block longer (up to a maximum of 7) was then presented. When the child failed on two consecutive sequences of the same length, the test was stopped. The span was established as the length of the last sequence reproduced correctly.
Test for assessing visual–spatial abilities
Block Design (WBD; Wechsler, 1986) is a subtest of the Wechsler Intelligence Scale for Children (revised), comprising several colored geometric pictures that children have to reproduce using small blocks (from four to nine). The Visual Motor Integration Test (VMI; Beery, 1997) consists of a sequence of 24 geometric forms, from simple to difficult, that children are asked to copy with pencil and paper.
Statistical analysis
The scores from the various tests were distributed over different ranges. In order to compare them, the raw scores were transformed into z scores, normalized on the basis of mean and standard deviation of the TD group. Since a large number of independent comparisons were performed and alpha inflation could lead to spurious finding, we performed only a planned analysis, comparing specific tests across the three groups. In this case, a more conservative level of alpha could increase Type-II error, and thus we preferred to evaluate the relevance of the observed contrasts calculating the Cohen's d. This measure of effect size is usually considered large if greater than or equal to 0.8, medium if greater than or equal to 0.5, small if greater than or equal to 0.2. When a significant effect was found throughout the statistical analysis, this effect size measure was usually computed as follows: when d resulted medium or large, the probability of a spurious finding could be considered quite small. Data were analyzed with the Statistical Package for Windows, Version 5.0 (StatSoft, Inc., Tulsa, Oklahoma). We performed several ANCOVAs with group (WS, DS and TD) as an independent variable, tests as dependent variables, and IQ as a covariate. Post-hoc comparisons (Tukey HSD test) were computed to assist in the interpretation of ANCOVA results.
Results
Considering the demographic characteristics of our sample (see Table 1 reported above), we found that the groups did not differ in mental age [F(2,168) = 0.2, p = 0.8], confirming the matching criterion. Of course, significant differences between groups were observed for chronological age [F(2,168) = 47.7, p < .00001]. Post-hoc analysis failed to show significant differences between the WS and DS groups in chronological age (p = .5), thus confirming the criterion chosen to match these two groups. However, WS and DS were both significantly older chronologically than typically developing controls (p < .0001 in both cases).
Although the WS, DS, and TD groups matched on mental age, all three groups differed by IQ level [F(2,168) = 411, p < .00001], and the post-hoc analysis revealed that all the comparisons were significant (TD > WS > DS, all ps < 0.001). In order to take this pervasive IQ difference into account, all further analyses of the different linguistic and nonlinguistic tests were conducted taking IQ into account as a covariate.
Tasks for language assessment: lexicon
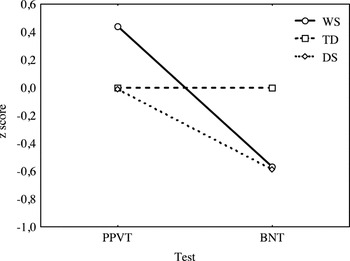
Performance scores of the two groups on the PPVT (the receptive lexical test) and on the BNT (the expressive lexical test) were analyzed by means of a two-way Group × Test (PPVT and BNT) mixed ANCOVA, covarying for IQ (Figure 1).

Performances obtained by the three groups in the receptive (PPVT) and expressive (BNT) lexical tests.
The group effect was significant [F(2,168) = 5.6, p = .005]. Also significant were the difference between tests [PPVT > BNT; F(1,168) = 53.1, p < .00001] and the Group × Test interaction [F(2,168) = 18.4, p < .00001]. Post-hoc analyses were performed to assist in the interpretation of this interaction. These revealed that individuals with DS and TD performed worse on the PPVT than the WS participants (p = .004 in both cases, Cohen's d = 0.38 and 0.39, respectively) when IQ is covaried out. Instead, no differences emerged between the DS and TD groups (p = .9). On the BNT the performance profile was quite different. Indeed, DS and WS obtained a very similar performance (p = .9), lower than TD (p < .0001 in both cases, Cohen's d = 0.58 and 0.56, respectively), despite the control for IQ. Moreover, both WS and DS performed significantly better in the PPVT than in the BNT (p < .0001 for both groups, Cohen's d = 1.66 in WS and = 0.95 in DS).
Tasks for language assessment: morphosyntax
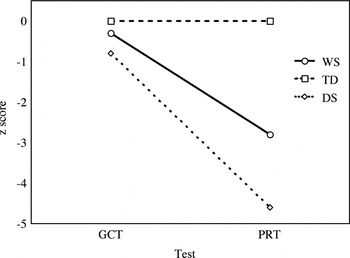
Performance scores of the two groups on the GCT (the receptive grammar test) and on the PRT (the expressive grammar test) were analyzed by means of a two-way Group × Test (GCT and PRT) mixed ANCOVA, again controlling for IQ (Figure 2). The group effect was significant [F(2,168) = 11.7, p = .00002; (DS < WS < TD, with p always < .001]. The main effect of test was also significant [F(1,165) = 173.1, p < .00001; PRT < GCT], as was the Group × Test interaction [F(2,168) = 46.1, p < .00001]. Post-hoc analyses were performed to explore this interaction. These revealed that, on the GCT, individuals with DS performed worse than TD (p = .04, Cohen's d = 0.80) but similarly to the WS participants (p = .5). However, no significant differences were observed between WS and TD groups (p = .7) when IQ is controlled.

Performances obtained by the three groups in the receptive (GCT) and expressive (PRT) grammar tests.
On the PRT, the performance profile showed by the three groups was different. DS obtained, again, the lowest performance (DS < WS, Cohen's d = 0.71; WS < TD, Cohen's d = 1.10; DS < TD, Cohen's d = 1.81; all ps < .0001). Note that in this case, the WS group performed below the TD group, albeit better than DS. Moreover, both WS and DS performed significantly better in the GCT than in the PRT (p < .0001 for both groups, Cohen's d = 2.21 and 3.37, respectively).
Tasks for language assessment: verbal fluency
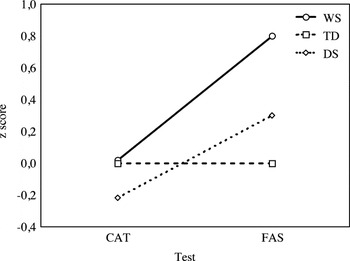
Performance scores of the two groups on the CAT (semantic fluency) and on the FAS (phonological fluency) were analyzed by means of a two-way Group × Test (CAT and FAS) mixed ANCOVA, with IQ as the covariate (Figure 3). The group effect was significant [F(2,168) = 4.7, p = .01; WS > TD = DS, p < .05], as was the difference between the two tests [F(1,168) = 31.2, p < .00001]. The Group × Test interaction was also significant [F(2,168) = 8.4, p < 0.001]. Post-hoc analyses were performed to explore this interaction. These revealed that although the three groups did not differ on the CAT (all ps > .5), performances on the FAS were quite different. In fact, here WS participants performed significantly better than both DS and TD children (all ps < .001, Cohen's d = 0.50 and 0.81, respectively), while DS and TD did not differ (p = .3). It is worthy to note that both WS and DS performed significantly better in the FAS than in the CAT (p < .005 for both groups, Cohen's d = 1.80 and 1.20, respectively).

Performances obtained by the three groups in the semantic fluency (CAT) and phonological fluency (FAS) tests.
Test for assessing short-term memory abilities
Performance scores of the two groups on the C × S (nonverbal Corsi span) and on the DiS (verbal Digit Span) were analyzed by means of a two-way Group × Test (CS and DiS) mixed ANCOVA, once again with IQ as the covariate (Figure 4). The group effect was significant [F(2,168) = 3.6, p < .05; TD > WS = DS, p < .0001], as well as the main effect of test [F(1,168) = 16.1, p < .0001 (CS < DiS]. The Group × Test interaction was also significant [F(2,168) = 10.9, p < .0001]. Post-hoc analyses, performed to explore this interaction, revealed that TD performed better than the other two groups in both tasks (all ps < .05, Cohen's d ranging between 0.44 and 1.10). Moreover, although individuals with WS performed similarly to the individuals with DS on the CS (p = 0.2), significant differences were observed between these two groups on the DiS (WS > DS; p = 0.001, Cohen's d = 0.51). Finally, a significant difference (p < .0001, Cohen's d = 1.69) between CS (worse) and DiS (better) was observed in theWS group but not in the DS group (p = .99).

Performances obtained by the three groups in the nonverbal Corsi span (CS) and in the verbal Digit Span (DiS).
Test for assessing visual–spatial abilities
Performance scores obtained by the two groups on the WBD (Wechsler Block Design) and on the VMI (Visual–Motor Integration drawing task) were analyzed by means of a two-way Group × Test (WBD and VMI) mixed ANCOVA, covarying IQ (Figure 5). The group effect was significant [F(2,168) = 8.2, p < .001], as well as the main effect of test [F(1,168) = 3.8, p = .05; WBD < VMI]. The Group × Test interaction only approached significance [F(2,168) = 2.9, p = 0.06]. Post-hoc analyses, performed to interpret the group effect, revealed that WS performed worse than both TD (p = .001, Cohen's d = 0.69) and DS children (p = .008, Cohen's d = 0.60). No significant differences emerged between the TD and DS groups (p =.9).

Performances obtained by the three groups in the Wechsler Block Design test (WBD) and in the Visual Motor Integration test (VMI).
Discussion
In the present study, we investigated cognitive and linguistic abilities in Italian participants with WS. Two different control groups were chosen, TD children and participants with DS matched to WS for mental age. Moreover, participants with DS and with WS were matched also for chronological age. The aims were to determine whether individuals with WS exhibit a specific neuropsychological profile with, for example, proficient language processing and reduced visual–spatial competencies. First of all, differences were observed in general IQ between groups. Although this is a predictable result for WS versus TD children (where the match in mental age to younger children guarantees an IQ difference), the difference between WS and DS must be emphasized. There are some reports suggesting that DS individuals are more severely compromised than WS in general IQ. Our result supports this conclusion in a large sample, and suggest that such a difference must be taken into account when cognitive and linguistic abilities of these two syndromes are compared directly.
The results reported above confirm a complex but atypical neuropsychological profile in participants with WS. In fact, in processing language as well as memory or visual–spatial abilities, individuals with WS show a neuropsychological profile characterized by some abilities that are more proficient than others. With regard to language, we have analyzed both lexical comprehension and production abilities. The participants with WS included in our study did not show particular difficulties in lexical comprehension, evaluated by the Peabody Picture Vocabulary Test and they performed better than their controls (TD and DS) when IQ is taken into account. In lexical production (Boston Naming Test), a different picture emerged: children with WS obtain a similar result to DS children, but here children with WS performed significantly worse than TD children even after controlling for IQ.
Results from the two morphosyntax tasks confirm the heterogeneity of the WS linguistic profile. In fact, although no differences were observed between TD children and WS participants in grammatical comprehension (and the WS were actually better than TD in lexical comprehension when IQ was controlled), significant differences were obtained in lexical production and phrase repetition (WS < TD). Finally, individuals with DS performed worse than TD on both morphosyntax tasks, and than WS only on the phrase repetition, confirming a specific vulnerability of grammar in this population and, in particular, in the expressive domain.
On the Word Fluency test with semantic (CAT) and phonemic (FAS) cues, no differences were observed between WS and TD groups at the CAT but, interestingly, participants with WS produced a higher number of words than TD children at the FAS. Looking at the DS performance, this group produced a lower number of words than the WS group on the FAS but not on the CAT; moreover, adults with DS performed similarly to TD children on both tasks. It is worth pointing out, however, that young TD children below the age of 6 years (all TD children were included in this study, but six had been attending school starting a few months ago) are not usually exposed to letters and alphabet games in Italy, whereas most of individuals with WS and DS included in our study had attended school and been exposed to this kind of teaching for several years. Therefore we do not know whether the apparent dissociation between mental age and phonological fluency in the participants with WS is a true dissociation or an effect of many years of school experience that the TD normal controls simply do not have. However, the comparison with DS suggests that the ability of WS participants in FAS may be specific of this second group. We can also hypothesize that the apparently spared linguistic abilities of children with WS may be, at least in part, an artifact of comparisons made with individuals with DS, whose phonological and morphosyntactic production and abilities are usually very poor, below their nonverbal mental age (Karmiloff-Smith et al., 1997; Vicari et al., 2002; Volterra et al., 1999).
To summarize, when IQ is controlled, people with WS perform better than TD children in lexical comprehension and phonological verbal fluency but are poorer in lexical and in morphosyntax production. Since DS participants show a quite different profile (always poorer than TD except for lexical comprehension and verbal fluency, where a floor effect does not allow us to see eventual differences), what we observe in WS participants does not seem to be a general effect of their intellectual disability. These findings are consistent with those reported by other authors who have highlighted how language produced by WS children is unusual from several points of view. Volterra et al. (1996), for example, demonstrated that speech in WS is fluent (at or above the utterance length expected for their mental age) and that they appear to be good conversationalists, but that the content of their speech is often odd or out of place in a particular social context. Vicari et al. (2002), demonstrated expressive morphosyntax deficits in young children with WS and, specially, difficulties in the use of content words.
Results for short-term memory demonstrated an advantage only for the WS but not for the DS group in memory for verbal material. This finding is consistent with previous reports (Jarrold et al., 1999; Vicari et al., 1996a, 1996b; Wang & Bellugi, 1994) and confirms the relative preservation of phonological processing in WS. More recent work by Majerus et al. (in press) shows that, contrary to common assumptions, different aspects of phonological processing are not preserved in WS children, and suggest that phonological representations could be overly specific and organized in unusual ways in individuals with WS. Although more studies are needed to better understand the real efficiency of phonological abilities in WS, the data presented seem to confirm the presence of some dissociations within the linguistic domain, that is, preserved lexical comprehension and phonological fluency but severe impairment in aspects of production, including morphosyntax.
Participants with WS included in this study demonstrate a remarkable impairment in spatial construction tasks (Visual Motor Integration test and Block Design test). Participants with WS seem to be especially compromised relative to TD children and individuals with DS in visual–spatial tasks in which constructional components are more involved. These results are consistent with other reports (Bellugi et al., 1999a, 1999b; Karmiloff-Smith et al., 2003).
A second goal of this research was to verify whether the neuropsychological profile obtained in individuals with WS may be different when examined at different ages during development. Here we were interested in determining whether the profile which characterizes adults with WS is already evident at younger ages or, alternatively, whether the behavioral phenotype looks different at different point of development. In other words, we can ask whether or not the initial cognitive and linguistic abilities of children with WS are directly predicted just on the basis of their final state. To this aim, we conducted a second study comparing these same abilities in language, memory and visual–spatial abilities in children with WS and children with DS divided in two sub-groups: younger (under 8 years of age) and older (over 12 years of age).
STUDY 2
Materials and Methods
Research participants
In this study, participants with WS and DS included in Experiment 1 were selected on the basis of their chronological ages to form two new groups for each syndrome. The first two groups (WS1, n = 16 and DS1, n = 9) included children with a chronological age equal or under 8 years, and the second two groups (WS2, n = 25 and DS2, n = 25) were formed by participants with a chronological age equal or above 12 years.
Instruments
The tests are the same as used in Experiment 1 (see above for a description).
Results
Demographic characteristics are summarized in Table 2. Differences between WS1 and DS1 in chronological age [F(1,23) = 3.1, p = .1], and mental age [F(1,23) = 0.9, p = .4], were not significant. However, a significant difference between groups was observed at the IQ level [F(1,23) = 4.2, p = .05]. Similarly, differences between WS2 and DS2 in chronological age [F(1,48) = 1.3, p = .3], and mental age [F(1,48) = 1.2, p = .3], were not significant. As for the younger groups, a significant difference was observed at the IQ level [F(1,48) = 6.7, p = .01]. Since we were interested in comparing linguistic and cognitive profiles in Groups 1 and 2, several MANCOVAs were performed with diagnosis (WS vs. DS) and age level (younger vs. older) as the independent variables, tests as dependent variables and IQ as a covariate. Post-hoc comparisons (Tukey HSD test) were computed to assist in the interpretation of MANCOVA results. Normalized z scores already calculated in Experiment 1 for each participant were analyzed with the Statistical Package for Windows, Version 5.0 (StatSoft, Inc., Tulsa, Oklahoma).
Demographic characteristics of “young” and “old” individuals with WS, DS and typically developing controls

Linguistic profile
Performance scores of WS1, DS1, WS2, and DS2 groups on the linguistic tasks (Figure 6) were analyzed by means of a Group × Age × Test (PPVT, BNT, GCT, PRT, CAT, FAS) multiple ANCOVAs with IQ as covariate. The main effect of group was significant [F(1,39) = 11.5, p = .002], as well as age [F(1,39) = 15.8, p = .0003] and test [F(5,200) = 66.2, p < .00001], suggesting variability of task difficulty. Post-hoc analyses revealed, in particular, that WS performed better than DS (p = .0002) and older participants scored higher performance than younger (p = .0004). The Group × Test interaction also showed a significant result [F(5,200) = 5.7, p = .00006], as well as the Group × Age interaction [F(1,39) = 4.4, p = .04], the latter suggesting, in the two groups, a different improvement in linguistic abilities across age (Figure 7). Post-hoc analyses performed to explore this interaction revealed that while the two groups did not differ in the younger ages (p = .4), WS performed significantly better than DS at older ages (p = .0003).

Performances obtained on linguistic tasks by the younger (left) and older (right) WS and DS participants.

Developmental trajectories of linguistic abilities in WS and DS groups.
The triple interaction (Group × Age × Task) was not significant, however [F(5,200) = 1.3, p = .3]. Since the lack of significance of the triple interaction could be due to the small sample size in some cells of the experimental design and to better interpret the linguistic ability profiles exhibited by WS and DS participants at the different age levels investigated, we performed a two-way ANOVA for each age group. In both of the analyses, diagnostic group (WS, DS) was the independent variable, tests the dependent variables and IQ the covariate. Post-hoc comparisons (Tukey HSD test) were computed to assist in the interpretation of ANCOVA results. Looking at the younger-ages interval (Figure 6, left), the group effect was not significant [F(1,23) = 1.1, p = .3]. The main effect of test was significant [F(5,122) = 19.3, p < .00001]. However, the Group × Test interaction was not significant [F(5,122) = 1.0, p = .4], thus suggesting a similar profile exhibited by the groups across language tasks. A similar analysis was performed comparing the WS2 and DS2 groups (Figure 6, right). In this case, group was significant [F(1,46) = 14.2, p = .001], as well as test [F(5,240) = 56.4, p < .00001]. The Group × Test interaction was also significant [F(5,240) = 6.3, p < .0001]. Post-hoc analyses performed to explore this interaction revealed that participants with WS performed better than DS participants in the PPVT (p = .01) and in the PRT (p = .0001). In other words, a selective WS/DS difference in language abilities emerged in the older children that was not apparent in the younger group.
Short-term memory profile
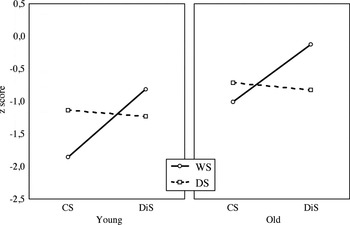
Performance scores of WS1, DS1, WS2 and DS2 groups on the CS and on the DiS (Figure 8) were analyzed by means of a Group × Age × Test multiple ANCOVA. The group effect was not significant [F(1,57) = 0.9, p = .3]. In contrast, the age and test effects showed significance [F(1,57) = 20.0, p < .00001; and F(1,58) = 11.3, p = .001 respectively]. Interestingly, the interaction between Group (WS, DS) × Test (CS, DiS) was also significant [F(1,58) = 17.5, p < .0001]. Post-hoc analyses, performed to explore this interaction, revealed that the two groups differed in the CS task (p = .02), with WS performing lower than DS, and in the DiS task (p = .007), with WS performing better than DS. The triple interaction, instead, was not significant [F(1,58) = 0.1, p = .7].

Performances obtained on short-term memory tasks by the younger (left) and older (right) WS and DS participants.
Since the lack of significance of the triple interaction could be due to the small sample size in some cells of the experimental design, and to better interpret the short-term memory profiles exhibited by WS and DS participants at the different age levels investigated, we performed a two-way ANOVA for each age group. In both of the analyses, diagnostic group (WS, DS) was the independent variable, tests the dependent variables and IQ the covariate. Post-hoc comparisons (Tukey HSD test) were computed to assist in the interpretation of ANCOVA results. Looking at the younger-age intervals (Figure 8, left), group was not significant [F(1,23) = 0.9, p = .4] nor was test [F(1,24) = 3.1, p < .00001]. The Group × Test interaction was, on the other hand, significant [F(1,24) = 4.5, p = .05], thus suggesting a different profile exhibited by the groups across short-term memory tasks. Indeed, post-hoc analyses revealed that while individuals with DS performed at the same level on the two memory tasks, the WS group performed significantly better on DiS than on CS (p = .04). A similar analysis was performed comparing the WS2 and DS2 groups (Figure 8, right). Also in this case, group was not significant [F(1,46) = 0.2, p = .7]. In contrast, the effect of test [F(1,47) = 9.7, p = .003], as well as the Group × Test interaction [F(1,47) = 16.7, p = .0002], were significant. Post-hoc analyses revealed that participants with WS performed significantly better than DS participants in the Digit Span (p = .0001). No differences were found in the CS group (p = .4). Interestingly, only the WS group showed a significant difference between CS (worse) and DiS (better; p = .0002). Thus, although WS participants perform better on verbal than in visual–spatial short-term memory task than when they were younger, the advantage on the digit span became significant also in comparison with DS group only among the older groups.
Visual–spatial profile
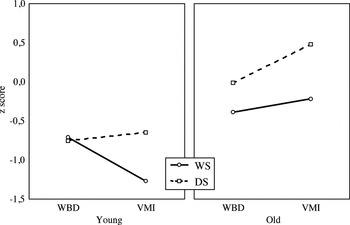
Performance scores of WS1, DS1, WS2, and DS2 groups on the WBD and on the VMI (Figure 9) were analyzed by means of a Group × Age × Test multiple ANCOVA. The group effect was significant [F(1,57) = 15.8, p = .0002; WS < DS] as well as the age effect [F(1,57) = 38.2, p < .00001]. The main effect of test was, instead, not significant [F(1,58) = 0.3, p = .6]. The interaction between Group (WS, DS) × Test (WBD, VMI) was also significant [F(1,58) = 5.8, p < .05]. Post-hoc analyses, performed to explore this interaction, revealed that the two groups differed in the VMI (p = .0003), with WS performing lower than DS, but they did not differ in the WBD test (p = .6). The triple interaction (Group × Age × Test), on the other hand, was not significant [F(1,58) = 0.7, p = .4].

Performances obtained on visual–spatial tasks by the younger (left) and older (right) WS and DS participants.
Since the lack of significance of the triple interaction could be due to the small sample size in some cells of the experimental design, and to better interpret the visual–spatial profiles exhibited by WS and DS participants at the different age levels investigated, we performed a two-way ANOVA for each age group. In both of the analyses, diagnostic group (WS, DS) was the independent variable, tests the dependent variables and IQ the covariate. Post-hoc comparisons (Tukey HSD test) were computed to assist in the interpretation of ANCOVA results. Concerning the younger-ages interval (Figure 9, left) group was significant [WS < DS; F(1,23) = 9.9, p = .006], as well as the test effect [F(1,24) = 5.9, p = .03], and the Group × Test interaction [F(1,24) = 12.3, p = .003]. Post-hoc analyses, performed to explore this interaction revealed that children with WS performed worse than children with DS on the VMI (p = .001). No significant differences emerged between groups on the WBD (p = .99). Similar analyses were conducted comparing WS2 and DS2 groups (Figure 9, right). The group effect was significant [F(1,46) = 11.5, p = .002] with WS performing worse than DS. The main effect of test was also significant [F(1,47) = 5.2, p = .03], with the WBD eliciting lower performance than the VMI. However, the Group × Test interaction was not significant [F(1,47) = 1.2, p = .3]. Hence, in this case, the younger children revealed a selective disadvantage in WS on the VMI that appears to have turned into a more global WS disadvantage in visual–spatial functions that shows up on both tasks for the older children.
Discussion
In the second study, we directly analyzed the effect of chronological age on cognitive and linguistic acquisition in participants with intellectual disability. With this aim we compared the performance of the children, adolescents and young adults with DS and WS included in the first study whose age was below 8 years (WS1 and DS1) to those older than 12 years (WS2 and DS2). Although it is important to stress that these are cross-sectional rather than longitudinal data, results in the linguistic tasks highlight a significantly different profile across age for the respective WS and DS groups. Indeed, while the profile exhibited by younger WS1 and DS1 subjects in these tasks is quite similar (Figure 6, left), significant differences emerged by comparing the two older groups (Figure 6, right). The linguistic profile exhibited by WS2 and DS2 participants offers a new perspective on our findings in the first study, suggesting that the differences in linguistic abilities may be related to on the age explored by the authors, as has been reported in other studies. The profile apparent in the two syndromes, in other words, may vary with development.
In the short-term memory domain, a different pattern was observed. In this case there was a selective WS advantage on the digit span (verbal memory span) task among the older groups. However, younger as well as older participants with WS obtained a higher score manipulating verbal rather than visual–spatial material. In contrast, participants with DS did not show significant differences between these two measures at either age. We find this result of some interest because it points to a different developmental trajectory at least of verbal spans in both the groups we considered.
Considering visual–spatial and constructive abilities, individuals with WS obtained consistently lower scores than people with DS. However, in the younger ages this result depended on the difference in VMI performance (Figure 9, left); in the older ages, performance in the two tasks was quite parallel in the two groups, as demonstrated by the nonsignificant Group × Task interaction. Similarly to the other tasks we considered, the performance profile observed for the two syndromes and their relation to typical development is different in the two age ranges considered, and what is observed in younger ages is not always confirmed in adolescence and adulthood.
GENERAL DISCUSSION AND CONCLUSION
We agree with the developmental perspective that more emphasis should be placed on determining cognitive profiles in infancy, as this may have critical implications for cognitive remediation (Paterson et al., 1999). At the same time, our results suggest that the profiles of strengths and impairments that distinguish individuals with WS and with DS continue to change well beyond infancy, with some strengths (e.g., receptive vocabulary and sentence repetition in WS) emerging in late childhood and adolescence, while other differences are more pronounced at the early stages and flatten out later on. We cannot determine at this point whether these variable trajectories are caused by maturational factors, or by cumulative experience with skills that are relevant to the tests employed here. We also caution that our developmental findings are based on a cross-sectional sample (albeit an unusually large one for these populations). It will ultimately be important to confirm these findings within a longitudinal design. For present purposes, however, we may conclude (in agreement with Karmiloff-Smith, 1998; Karmiloff-Smith et al., 2003; and Paterson et al., 1999) that cognitive phenotypes are not stable over time in individuals with WS or DS, and that one cannot reliably predict the middle or adult states of the system from the profiles observed in the earliest stages of development. From a neurobiological perspective, the cognitive profile we have described in participants with WS as well as with DS presumably result from some specific characteristics of their anomalous brain development. Concerning the present study, any attempt to identify which neuroanatomical structures are specifically involved in the cognitive impairment displayed by people with WS and DS is speculative, and it must necessarily be based on qualitative comparisons of their deficit with that displayed by patients with acquired brain lesions.
In the above regard, it is worth noting that WS children's brain development is characterized by a remarkable atrophy of the posterior region of the brain as well as of the basal ganglia (Bellugi et al., 1999a; Jernigan et al., 1993). Albeit cerebellar volume is relatively preserved (Bellugi et al., 1999a; Jernigan et al., 1993) a neurochemical alteration (reduction of the neurotransmitter N-acetylaspartate) has been demonstrated in the cerebellum (Rae et al., 1998).
By contrast, in people with DS, the frontal cortex is disproportionately reduced in volume; also reduced are the limbic structures of the temporal lobe (including uncus, amygdala, hippocampus, and parahippocampal gyrus) and the cerebellum size. In contrast, brains from individuals with DS usually exhibit a relatively preserved volume of subcortical areas, such as lenticular nuclei (Bellugi et al., 1999a; Jernigan et al., 1993). The different neuropsychological profiles we described between WS and DS might rely upon the difference within cortical and subcortical structures observed in these syndromes. For example, in agreement with Fabbro et al. (2002), the lower performance of WS in a subset of the linguistic tasks may be related to a dysfunction of the basal ganglia involved in expressive language processing, while the lower performances of DS may be partially explained in terms of impairment of the frontocerebellar structures involved in articulation and working memory, and the often reported hearing loss. Moreover, several recent observations made with the MRI technique suggest a possible impairment of the dorsal cortical stream in participants with WS. For example, Reiss et al. (2000) documented reduced representation of the posterior areas (parietal and occipital) in persons with WS compared with age-matched controls. The dorsal areas of the parietal cortex (besides the frontal ones) are markedly involved in the mediation of spatial processing; in contrast, the temporal ventral (and perhaps frontal) areas intervene in working memory for objects and faces and, more generally, in the processing of visual material (Courtney et al., 1996; Nelson et al., 2000). Therefore, a deficit of the dorsal stream in children with WS may play an important role in the reduced spatial abilities that they demonstrate, including their reduced spatial span.
A further characteristic of the WS brain, more recently described, is a reduced volume in the posterior regions of the corpus callosum (Tomaiuolo et al., 2002). This hypoplasia of the corpus callosum may determine a defective callosal transfer of information, thus effecting an insufficient integration and coordination of the activity of both cerebral hemispheres. On the basis of all these observations, the possible role played by the reduced posterior regions of brain and corpus callosum in the visual–spatial difficulties in individuals with WS is, although speculative, very suggestive.
Finally, any theory of the neural substrates of people with WS and DS must take into consideration the fact that profiles of deficit change from infancy to adolescence in these populations. There are at least two possible explanations. First, the neural differences between the populations may be established at birth, but respond differentially to the various linguistic and nonlinguistic tasks that we have described here. This would occur because developmental changes in task difficulty require the recruitment of different neural systems (e.g., different substrates are required for less challenging items passed by younger children vs. the more difficult items passed by older children). Second, behavior and brain may change together dynamically across the course of development, reflected in a making up of deficits in some domains, increasing deficits in others, or flattening out at a developmental ceiling that children with severe learning disabilities cannot surpass. To choose between these possibilities, developmental studies of behavior in these populations will need to be supplemented by developmental studies of the brain activity associated with the same tasks.
ACKNOWLEDGMENTS
The financial support of Telethon-Italy (grant no. E.C. 685), of CNR (Grant CNRC002D39_001 “Clinical tools for the identification and the early diagnosis of language disorders in infancy”) and FIRB/MIUR (Grant no. RBNE01SZB4) are gratefully acknowledged. We thank Meiti Opie for her valuable assistance in the final editing of this paper. We especially thank the children who participated in the study and their parents. And we will always remember and treasure Elizabeth Bates, our beloved and admired colleague and valuable coauthor, who passed away last December.
References
REFERENCES
Arnold, R.,
Yule, W., &
Martin, N.
(1985).
The psychological characteristics of infantile hypercalcaemia: A
preliminary investigation.
Developmental Medicine and Child Neurology,
27,
49–59.Google Scholar
Atkinson, J.,
Braddick, O.,
Anker, S.,
Curran, W.,
Andrew, R.,
Wattam-Bell, J., &
Braddick, F.
(2003).
Neurobiological models of visuospatial cognition in children with
Williams syndrome: Measures of dorsal-stream and frontal function.
Developmental Neuropsychology,
23,
139–172.Google Scholar
Atkinson, J.,
King, J.,
Braddick, O.,
Nokes, L.,
Anker, S., &
Braddick, F.
(1997).
A specific deficit of dorsal stream function in Williams Syndrome.
Neuroreport,
8,
1919–1922.Google Scholar
Atkinson, J.,
Shirley, L.,
Braddick, O.,
Mason, A., &
Braddick, F.
(2001).
Visual and visuospatial development in young children with Williams
syndrome.
Developmental Medicine and Child Neurology,
43,
330–337.Google Scholar
Baddeley, A D.
(1986).
Working memory.
Oxford, UK:
Oxford University Press.
Baddeley, A.D. &
Hitch, G.
(1974).
Working memory. In
G.H. Bower (Ed.),
The psychology of learning and motivation (pp.
47–90).
New York:
Academic Press.
Beery, K.
(1997).
Developmental tests of visual–motor integration.
Parsippany, NJ:
Modern Curriculum Press.
Bellugi, U.,
Bihrle, A.,
Jernigan, T.,
Trauner, D., &
Doherty S.
(1990).
Neuropsychological, neurological and neuroanatomical profile of
Williams Syndrome.
American Journal of Medical Genetics
(Suppl. 6),
115–125.Google Scholar
Bellugi, U.,
Bihrle, A.,
Neville, H.,
Jernigan, T., &
Doherty, S.
(1996).
Language, cognition and brain organization in a neurodevelopmental
disorder. In
M. Gunnar &
C. Nelson (Eds.),
Developmental behavioral neuroscience.
Hillsdale, NJ:
Erlbaum.
Bellugi, U.,
Koremberg, J.R., &
Klima, E.S.
(2001).
Williams syndrome: An exploration of neurocognitive and genetic
features.
Clinical Neuroscience Research,
1,
217–229.Google Scholar
Bellugi, U.,
Lichtenberger, L.,
Mills, D.,
Galaburda, A., &
Koremberg, J.R.
(1999a).
Bridging cognition, the brain and molecular genetics: Evidence from
Williams syndrome.
Trends in Neuroscience,
22,
197–207.Google Scholar
Bellugi, U.,
Mills, D.,
Jernigan, T.,
Hickok, G., &
Galaburda, A.
(1999b).
Linking cognition, brain structure, and brain function in Williams
syndrome. In
H. Tager-Flusberg (Ed.),
Neurodevelopmental disorders (pp.
111–136).
Cambridge, MA:
MIT Press.
Bellugi, U. &
St. George, M. (Eds).
(2001).
Journey from cognition to brain to gene. Perspectives from Williams
syndrome.
Cambridge MA:
MIT Press.
Botta, A.,
Sangiuolo, F.,
Calza, L.,
Giardino, L.,
Potenza, S.,
Novelli, G., &
Dallapiccola, B.
(1999).
Expression analysis and protein localization of the human
HPC–1/syntaxin 1A, a gene deleted in Williams syndrome.
Genomics,
15,
525–528.Google Scholar
Bozzo, M.T. &
Mansueto Zecca, G.
(1993).
Adattamento italiano della Scala d'Intelligenza Stanford-Binet
Forma L-M nella revisione Terman-Merill [Italian adaptation of
the Stanford-Binet Intelligence Scale, Form L-M in the Terman-Merill
revision].
Firenze, Italy:
Organizzazioni Speciali.
Chapman, R.S.
(1995).
Language development in children and adolescents with Down
syndrome. In
P. Fletcher &
B. MacWhinney (Eds.),
Handbook of child language (pp.
641–663).
Oxford, UK:
Blackwell.
Courtney, S.M.,
Ungerleider, L.G.,
Keil, K., &
Haxby, J.V.
(1996).
Object and visual working memory activate separate neural systems
in human cortex.
Cerebral Cortex,
6,
39–49.Google Scholar
Devescovi, A. &
Caselli, M.C.
(2001).
Una prova di ripetizione di frasi per la valutazione del primo
sviluppo grammaticale [A test of phrase repetition to
evaluate the early development of grammar].
Psicologia Clinica dello Sviluppo,
3,
341–364.Google Scholar
Devescovi, A.,
Caselli, M.C.,
Ossella, T., &
Alviggi, F.G.
(1992).
Strumenti di indagine sulle prime fasi dello sviluppo
linguistico: Risultati di una prova di ripetizione di frasi con bambini
fra i due e i tre anni e mezzo [Methods of enquiry into the
early phases in linguistic development: Results of a sentence
repetition test in 2–3.5-year-old children].
Rassegna di Psicologia,
2,
29–54.Google Scholar
Dunn, Lloyd M. &
Dunn, Leota M.
(1981).
Peabody Picture Vocabulary Test–Revised.
Circle Pines, MN:
American Guidance Service.
Ewart, A.K.,
Morris, C.A.,
Atkinson, D.,
Jin, W.,
Sternes, K.,
Spallone, P.,
Stock, A.D.,
Leppert, M., &
Keating, M.T.
(1993).
Hemizygosity at the elastin locus in a developmental disorder,
Williams syndrome.
Nature Genetics,
5,
11–16.Google Scholar
Fabbretti, D.,
Pizzuto, E.,
Vicari, S., &
Volterra, V.
(1997).
A story description task in children with Down syndrome: Lexical
and morphosyntactic abilities.
Journal of Intellectual Disabilities Research,
41,
165–179.Google Scholar
Fabbro, F.,
Alberti, A.,
Gagliardi, C., &
Borgatti, R.
(2002).
Differences in native and foreign language repetition task between
subjects with Williams and Down syndromes.
Journal of Neurolinguistics,
15,
1–10.Google Scholar
Frangiskakis, J.M.,
Ewart, A.K.,
Morris, C.A.,
Mervis, C.B.,
Bertrand, J.,
Robinson, B.F.,
Klein, B.P.,
Ensing, G.J.,
Everett, L.A., &
Green, E.D.
(1996).
LIM-Kinase-1 hemizygosity implicated in impaired visuospatial
constructive cognition.
Cell,
86,
59–69.Google Scholar
Gosh, A.,
Stading, G., &
Pankau, R.
(1994).
Linguistic abilities in children with Williams-Beuren syndrome.
American Journal of Medical Genetics,
52,
291–296.Google Scholar
Grant, J.,
Karmiloff-Smith, A.,
Gathercole, S.E.,
Paterson, S.,
Howlin, P.,
Davies, M., &
Udwin, O.
(1997).
Phonological short-term memory and its relationship to language in
Williams Syndrome.
Journal of Cognitive Neuropsychiatry,
2,
81–99.Google Scholar
Jarrold, C.,
Baddeley, A.D., &
Hewes, A.K.
(1999).
Genetically dissociated components of working memory: Evidence from
Down and Williams syndrome.
Neuropsychologia,
37,
637–651.Google Scholar
Jernigan, T.L.,
Bellugi, U.,
Sowell, E.,
Doherty, S., &
Hesselink, J.R.
(1993).
Cerebral morphologic distinction between Williams and Down
syndromes.
Archives of Neurology,
50,
186–191.Google Scholar
Karmiloff-Smith, A.
(1998).
Development itself is the key to understanding developmental
disorders.
Trends in Cognitive Sciences,
2,
289–298.Google Scholar
Karmiloff-Smith, A.,
Brown, J.H.,
Grice, S., &
Paterson, S.
(2003).
Dethroning the myth: Cognitive dissociations and innate modularity
in Williams syndrome.
Developmental Neuropsychology,
23,
227–242.Google Scholar
Karmiloff-Smith, A.,
Grant, J.,
Berthoud, I.,
Davis, M.,
Howlin, P., &
Udwin, O.
(1997).
Language and Williams syndrome: How intact is
“intact”?
Child Development,
68,
246–262.Google Scholar
Karmiloff-Smith, A.,
Tyler, L.K.,
Voice, K.,
Sims, K.,
Udwin, O.,
Howlin, P., &
Davis, M.
(1998).
Linguistic dissociations in Williams syndrome: Evaluating receptive
syntax in on-line and off-line tasks.
Neuropsychologia,
36,
343–351.Google Scholar
Klein, B.P. &
Mervis, C.B.
(1999).
Cognitive strength and weaknesses of 9- and 10-year-olds with
Williams syndrome or Down syndrome.
Developmental Neuropsychology,
16,
177–196.Google Scholar
Majerus, S.,
Barisnikov, K.,
Vuillemin, I.,
Poncelet, M., &
Van der Linden, M.
(in press).
An investigation of verbal short-term memory and phonological processing
in four children with Williams syndrome.
Neurocase.
Mervis, C.B.,
Morris, C.A.,
Bertrand, J., &
Robinson, B.F.
(1999).
Williams syndrome: Findings from an integrated program of
research. In
H. Tager-Flusberg (Ed.),
Neurodevelopmental disorders (pp.
65–110).
Cambridge, MA:
MIT Press.
Mervis, C.B. &
Robinson, B.R.
(2000).
Cognitive strength and weaknesses of 9- and 10-year-olds with
Williams syndrome or Down syndrome.
Developmental Neuropsychology,
16,
177–196.Google Scholar
Miller, J.F.
(1988).
The developmental asynchrony of language development in children
with Down syndrome. In
L. Nadel (Ed.),
Psychobiology of Down syndrome (pp.
167–198).
Cambridge, MA:
MIT Press.
Miller, J.F.
(1992).
Development of speech and language in children with Down
syndrome. In
I.T. Lott &
E.E. McLoy (Eds.),
Down syndrome (pp.
39–50).
New York:
Wiley-Liss.
Nelson, C.A.,
Monk, C.S.,
Lin, J.,
Carver, L.J.,
Thomas, K.M., &
Truwit, C.L.
(2000).
Functional neuroanatomy of spatial working memory in children.
Developmental Psychology,
36,
109–116.Google Scholar
Nicholas, L.,
Brookshire, R.,
Mc Lennan, D.,
Schumacher, J., &
Porrazzo, S.
(1989).
Revised administration and scoring procedures for the Boston Naming
Test and norms for non-brain-damaged adults.
Aphasiology,
3,
569–580.Google Scholar
Orsini, A.,
Grossi, D.,
Capitani, E.,
Laiacona, M.,
Papagno, C., &
Vallar, G.
(1987).
Verbal and spatial immediate memory span: Normative data from 1355
adults and 1112 children.
Italian Journal of Neurological Sciences,
6,
539–548.Google Scholar
Papagno, C. &
Vallar, G.
(2001).
Understanding metaphors and idioms: A single-case
neuropsychological study in a person with Down syndrome.
Journal of the International Neuropsychological Society,
7,
516–528.Google Scholar
Paterson, S.,
Brown, J.H.,
Gsodl, M.K.,
Johnson, M.C., &
Karmiloff-Smith, A.
(1999, December).
Cognitive modularity and genetic disorders.
Science,
286,
2355–2358.Google Scholar
Pezzini, G.,
Vicari S., Volterra V.,
Milani L., &Ossella M.T.
(1999).
Children with Williams syndrome: Is there a unique
neuropsychological profile?
Developmental Neuropsychology,
15,
141–155.Google Scholar
Rae, C.,
Karmiloff-Smith, A.,
Lee, M.A.,
Dixon, R.M,
Grant, J.,
Blamire, A.M.,
Thompson, C.H.,
Styles, P., &
Radda, G.K.
(1998).
Brain biochemistry in Williams syndrome: Evidence for a role of the
cerebellum in cognition.
Neurology,
51,
33–40.Google Scholar
Reilly, J.,
Klima, E.S., &
Bellugi, U.
(1990).
Once more with feeling: Affect and language in atypical
populations.
Development and Psychopathology,
2,
367–391.Google Scholar
Reiss, A.L.,
Eliez, S.,
Schmitt, J.E., &
Straus, E.
(2000).
Neuroanatomy of Williams syndrome: A high-resolution MRI study.
Journal of Cognitive Neuroscience,
12,
65–73.Google Scholar
Riva, D.,
Nichelli, F., &
Devoti, M.
(2000).
Developmental aspects of verbal fluency and confrontation naming in
children.
Brain and Language,
71,
267–284.Google Scholar
Rondal, J.A.
(1995).
Exceptional language development in Down syndrome.
Cambridge, UK:
Cambridge University Press.
Rondal, J.A.,
Ghiotto, M.,
Brédart, S., &
Bachelet, J.F.
(1988).
Mean length of utterance of children with Down syndrome.
American Journal on Mental Retardation,
93,
64–66.Google Scholar
Rubba, J. &
Klima, E.S.
(1991).
Preposition use in a speaker with Williams Syndrome: Some cognitive
grammar proposals.
Center for Research in Language Newsletter,
3,
3–12.Google Scholar
Rustioni, D.
(1994).
Sviluppo della comprensione linguistica nei bambini italiani.
Presentazione di una scala evolutiva [Development of grammar
comprehension in Italian children. Presentation of an evolutionary
scale]. In
C. Cornoldi &
R. Vianello (Eds.),
Handicap e apprendimento (pp.
35–53).
Bergamo, Italy:
Junior Ed.
Singer-Harris, N.G.,
Bellugi, U.,
Bates, E.,
Jones, W., &
Rossen, M.
(1997).
Contrasting profiles of language in children with Williams and Down
syndromes.
Developmental Neuropsychology,
13,
345–370.Google Scholar
Tomaiuolo, F.,
Di Paola, M.,
Caravale, B.,
Vicari, S.,
Petrides, M., &
Caltagirone C.
(2002).
Morphology and morphometry of the corpus callosum in Williams
syndrome: A magnetic resonance imaging analysis.
Neuroreport,
13,
1–5.Google Scholar
Udwin, O. &
Yule, W.
(1990).
Expressive language of children with Williams syndrome.
American Journal of Medical Genetics
(Suppl. 6),
108–114.Google Scholar
Vallar, G. &
Papagno, C.
(1993).
Preserved vocabulary acquisition in Down syndrome children: The
role of phonological short-term memory.
Cortex,
29,
467–483.Google Scholar
Vender, C.,
Borgia, R.,
Bruno, S.,
Freo, P., &
Zardini, G.
(1981).
Un test di ripetizione di frasi. Analisi delle performances in
bambini normali [A test of sentence repetition. Analysis of
performance in normal children].
Giornale di Neuropsichiatria Infantile,
243–244,
819–831.Google Scholar
Vicari, S.,
Bellucci, S., &
Carlesimo, G.A.
(2001).
Procedural learning deficit in children with Williams syndrome.
Neuropsychologia,
39,
665–677.Google Scholar
Vicari, S.,
Bellucci, S., &
Carlesimo, G.A.
(2003).
Visual and spatial working memory dissociation: Evidence from a
genetic syndrome.
Developmental Medicine and Child Neurology,
45,
269–273.Google Scholar
Vicari, S.,
Brizzolara, D.,
Carlesimo, A.,
Pezzini, G., &
Volterra, V.
(1996a).
Memory abilities in children with Williams syndrome.
Cortex,
32,
503–514.Google Scholar
Vicari, S.,
Carlesimo, A.,
Brizzolara, D., &
Pezzini, G.
(1996b).
Short-term memory in children with Williams syndrome: A reduced
contribution of lexical–semantic knowledge to word span.
Neuropsychologia,
34,
919–925.Google Scholar
Vicari, S.,
Caselli, M.C.,
Gagliardi, C.,
Tonucci, F., &
Volterra, V.
(2002).
Language acquisition in special populations: A comparison between
Down and Williams syndromes.
Neuropsychologia,
40,
2461–2470.Google Scholar
Vicari, S.,
Caselli, M.C., &
Tonucci, F.
(2000).
Asynchrony of lexical and morphosyntactic development in children
with Down syndrome.
Neuropsychologia,
38,
634–644.Google Scholar
Volterra, V.,
Capirci, O.,
Pezzini, G.,
Sabbadini, L., &
Vicari, S.
(1996).
Linguistic abilities in Italian children with Williams syndrome.
Cortex,
32,
663–677.Google Scholar
Volterra, V.,
Longobardi, E.,
Pezzini, G.,
Vicari, S., &
Antenore, C.
(1999).
Visuo–spatial and linguistic abilities in a twin with
Williams syndrome.
Journal of Intellectual Disability Research,
43,
294–305.Google Scholar
Wang, P.P. &
Bellugi, U.
(1994).
Evidence from two genetic syndromes for dissociation between verbal
and visual–spatial short-term memory.
Journal of Clinical Experimental Neuropsychology,
16,
317–322.Google Scholar
Wechsler, D.
(1986).
WISC–R–Scala di intelligenza Wechsler per bambini,
riveduta [WISC–R–Wechsler Intelligence Scale for
Children, revised].
Florence, Italy:
Organizzazioni Speciali.
Demographic characteristics of individuals with WS, DS and typically developing controls
Performances obtained by the three groups in the receptive (PPVT) and expressive (BNT) lexical tests.
Performances obtained by the three groups in the receptive (GCT) and expressive (PRT) grammar tests.
Performances obtained by the three groups in the semantic fluency (CAT) and phonological fluency (FAS) tests.
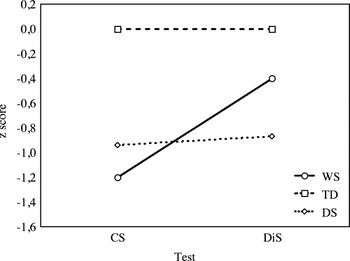
Performances obtained by the three groups in the nonverbal Corsi span (CS) and in the verbal Digit Span (DiS).
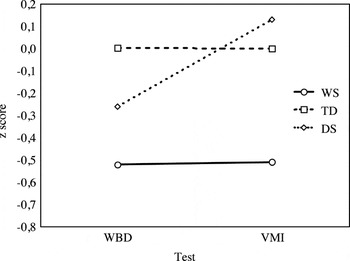
Performances obtained by the three groups in the Wechsler Block Design test (WBD) and in the Visual Motor Integration test (VMI).

Demographic characteristics of “young” and “old” individuals with WS, DS and typically developing controls
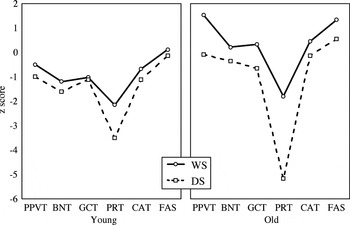
Performances obtained on linguistic tasks by the younger (left) and older (right) WS and DS participants.
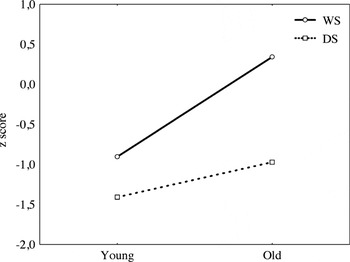
Developmental trajectories of linguistic abilities in WS and DS groups.
Performances obtained on short-term memory tasks by the younger (left) and older (right) WS and DS participants.
Performances obtained on visual–spatial tasks by the younger (left) and older (right) WS and DS participants.
 You have
Access
- 80
- Cited by