



1 Introduction
Transonic buffet is a complex aerodynamic instability which can occur on an aircraft flying at transonic speed. This phenomenon appears for a Mach number
 $M$
or an angle-of-attack
 $\unicode[STIX]{x1D6FC}$
above critical values and consists of a self-sustained shock-wave oscillation synchronized with the thickening/thinning of the detached boundary. Buffet results in lift and drag variations that greatly affect the aircraft aerodynamics and, as such, limit the aircraft flight envelope since a margin of 30 % on the lift coefficient at cruise conditions must be respected by design standards. Moreover, the low value of the frequency of the shock oscillation can interact with the structural modes of the wing. Transonic buffet was first observed by Hilton & Fowler (Reference Hilton and Fowler1947) together with the achievement of transonic speeds by aircraft, and even if several studies have been published since then, a complete understanding of the physics is still lacking. More recently, two journal papers have reviewed the developments and achievements in the understanding of this phenomenon: Lee (Reference Lee2001) and Giannelis, Vio & Levinski (Reference Giannelis, Vio and Levinski2017). Lee concluded his paper with a possible explanation of the transonic buffet phenomenon, presented in the next paragraph, while Giannelis concluded that a unique mechanism explaining the phenomenon is still lacking but also that several studies contradict each other.
Transonic buffet is characterized by a low frequency of the shock oscillation, i.e. the characteristic time scale of the unsteadiness is much larger than the turbulent ones. This is the reason why simulations based on unsteady Reynolds-averaged Navier–Stokes (URANS) equations succeeded in the reproduction of the phenomenon (Barakos & Drikakis Reference Barakos and Drikakis2000; Brunet Reference Brunet2003; Deck Reference Deck2005; Thierry & Coustols Reference Thierry and Coustols2006; Xiao, Tsai & Liu Reference Xiao, Tsai and Liu2006; Grossi, Braza & Hoarau Reference Grossi, Braza and Hoarau2014; Sartor, Mettot & Sipp Reference Sartor, Mettot and Sipp2015; Memmolo, Bernardini & Pirozzoli Reference Memmolo, Bernardini and Pirozzoli2018). Nevertheless, a turbulence model is necessary to close the Reynolds-averaged Navier–Stokes (RANS) equations and Thierry & Coustols (Reference Thierry and Coustols2006) have demonstrated the high sensitivity of the results to these models. Some authors (Deck Reference Deck2005; Garnier & Deck Reference Garnier, Deck, Armenio, Geurts and Fröhlich2010; Grossi et al. Reference Grossi, Braza and Hoarau2014; Memmolo et al. Reference Memmolo, Bernardini and Pirozzoli2018) have compared results from URANS calculations to high-fidelity simulations (hybrid RANS/large eddy simulation (LES), LES) to show that the results are consistent with each other even if the URANS approach does not resolve medium and high-frequency unsteadiness and can have some delay in the prediction of the buffet onset. The first model proposed to explain transonic buffet is the bubble bursting model by Pearcey (Reference Pearcey1958) and Pearcey & Holder (Reference Pearcey and Holder1962). In this model buffet onset appears during the burst of a separation bubble when its expansion reaches the trailing edge (TE). Several recent studies contradict this model. Nitzsche (Reference Nitzsche2009), Crouch et al. (Reference Crouch, Garbaruk, Magidov and Travin2009b ) and Sartor et al. (Reference Sartor, Mettot and Sipp2015) did not find any relation between buffet onset and the separation bubble dynamics in their numerical results. Another physical model explaining two-dimensional (2-D) transonic buffet is Lee’s one (Lee Reference Lee1990, figure 1a). It is the most cited self-sustained loop model in the literature on buffet. It is based on the coupling between the shock and the TE through pressure waves. Pressure waves are generated at the shock foot and propagate downstream, inside the boundary layer, up to the TE where they are diffracted, travelling back upstream to the shock outside the boundary layer. The waves impacting the shock create new pressure waves starting again the self-sustained closed-loop. Lee, Murty & Jiang (Reference Lee, Murty and Jiang1994) performed an analysis of the disturbance’s propagation through the nonlinear transonic small disturbance equation. Lee et al. (Reference Lee, Murty and Jiang1994) were able to reconstruct the wavefronts and rays generated by an impulse source at the TE (see figure 1 b); the paths are coherent with the earlier Lee model. Previous investigation by Spee (Reference Spee1966) with a graphical method showed that the waves generated downstream can penetrate the supersonic region upstream. Deck (Reference Deck2005) validated numerically the buffet period from Lee’s model and found numerically that the downstream pressure waves are hydrodynamic in nature while upstream waves are acoustic. Jacquin et al. (Reference Jacquin, Molton, Deck, Maury and Soulevant2009) experimentally found the presence of upstream traveling waves on the lower side of the airfoil and linked these fluctuations with a possible alternative path of a self-sustained closed-loop.
(a) Lee’s model of self-sustained shock oscillation (Lee Reference Lee1990); (b) the schematic of wavefronts and rays emanating from source disturbances at TE of airfoil (Lee et al. Reference Lee, Murty and Jiang1994).

More recently, in a numerical study, Garnier & Deck (Reference Garnier, Deck, Armenio, Geurts and Fröhlich2010) pointed out that the buffet period computed using Lee’s model was not in agreement with their simulation. Hartmann, Feldhusen & Schröder (Reference Hartmann, Feldhusen and Schröder2013) and Feldhusen et al. (Reference Feldhusen, Hartmann, Klaas and Schröder2014) proposed another model which can be considered as an extension of Lee’s one. It suggests that the shock movement is totally driven by the change of the sound pressure level of the waves at the TE, which are in turn linked to the strength of the vortical structures convected from the shock foot to the TE. Memmolo et al. (Reference Memmolo, Bernardini and Pirozzoli2018) studied the link between the propagation of acoustic waves (both on the pressure and the suction sides) and the low-frequency dynamics. They concluded that the buffet mechanism is strongly localized around the shock or linked to the separation bubble dynamics.
Further explanation of the transonic buffet phenomenon comes from linear stability analysis. Crouch, Garbaruk & Magidov (Reference Crouch, Garbaruk and Magidov2007) were the first to perform a global linear stability analysis of the transonic buffet phenomenon. They demonstrated that transonic buffet is an unstable global mode and, furthermore, showed that the perturbations are travelling upward downstream of the shock (Crouch et al.
Reference Crouch, Garbaruk, Magidov and Jacquin2009a
,Reference Crouch, Garbaruk, Magidov and Travin
b
). This finding appears to be in contrast with Lee’s model where the loop is closed by the waves impacting the shock and moving down towards the shock foot. Crouch et al. (Reference Crouch, Garbaruk, Magidov and Travin2009b
) considered an NACA0012 airfoil at fixed Mach and Reynolds numbers (
 $M=0.76$
and
 $Re=10^{7}$
). The buffet onset was found in the range
 $\unicode[STIX]{x1D6FC}=3.1{-}3.2^{\circ }$
. Figure 2 shows the pressure fluctuation during a limit cycle of the lift oscillation. The linear stability analysis was then considered again by Iorio, Gonzalez & Ferrer (Reference Iorio, Gonzalez and Ferrer2014), Guiho (Reference Guiho2015) and Sartor et al. (Reference Sartor, Mettot and Sipp2015). Sartor et al. (Reference Sartor, Mettot and Sipp2015) was the first to show a complete spectra of the global buffet mode from onset to exit. Iorio (Reference Iorio2015) furthermore performed a stability analysis of an NACA0012 in buffet conditions over a computational domain of reduced size. She showed that a reduction of the domain up to a radius of two chords around the airfoil does not have a significant impact on the unstable buffet mode. This result suggests a local behaviour of the buffet mode.
Contours of the pressure fluctuation at eight steps during the oscillation cycle for the conditions
 $M=0.76$
,
 $\unicode[STIX]{x1D6FC}=3.2^{\circ }$
,
 $Re=10^{7}$
(Crouch et al.
Reference Crouch, Garbaruk, Magidov and Travin2009b
).

An important question in the framework of global stability analysis is the definition of a method to find the regions in space where the instability develops. The first to introduce this idea were Huerre & Monkewitz (Reference Huerre and Monkewitz1990). They introduced the concept of a wavemaker as the region where the instability waves are intrinsically generated for globally unstable flows. The interpretation by Koch (Reference Koch1985) of global instability uses a similar idea. Today, the most accepted definition of the wavemaker comes from Giannetti & Luchini (Reference Giannetti and Luchini2007): it is a structural sensitivity that quantifies how an eigenvalue is affected by the introduction of localized forcing. Then the concept was extended to nonlinear global modes by way of Floquet theory (Luchini, Giannetti & Pralits Reference Luchini, Giannetti and Pralits2008). Marquet, Sipp & Jacquin (Reference Marquet, Sipp and Jacquin2008) investigated the sensitivity with respect to localized modifications of the base flow which is more relevant for flow control.
The global stability analysis is useful for determining the temporal stability of non-parallel flows, i.e. flows exhibiting large variations in several directions of space (Theofilis Reference Theofilis2003, Reference Theofilis2011). However, it does not provide further information for understanding the feedback mechanisms at the origin of self-sustained (global) instability. Two feedback mechanisms are often invoked to explain global instabilities arising in hydrodynamic flows: a local hydrodynamic-feedback and a non-local pressure-feedback (Chomaz, Huerre & Redekopp Reference Chomaz, Huerre and Redekopp1988). The local hydrodynamic feedback is responsible for the global instability in wake flows behind bluff bodies, for instance circular cylinder flow (Jackson Reference Jackson1987), while the non-local pressure feedback is responsible for the global instability in cavity flows (Sipp & Lebedev Reference Sipp and Lebedev2007). The existence of local hydrodynamics feedback in cylinder flow has first been identified with local stability analysis and was connected to the appearance of an absolute instability in the wake flow. Giannetti & Luchini (Reference Giannetti and Luchini2007) first proposed identifying local feedback mechanisms in global eigenmodes using a structural sensitivity analysis of the eigenvalue problem.
In summary, several authors studied the problem of the instability localisation but always in the context of a sensitivity analysis. Here an alternative technique is used, which does not target the eigenvalue variation but the eigenvalue itself. This technique, introduced by Marquet & Lesshafft (Reference Marquet and Lesshafft2015), allows in particular distinguishing between the contribution to the growth rate and to the angular frequency.
The paper is organized as follows: § 2 presents the various concepts (base flows, direct and adjoint global modes) and the various approaches made to analyse the importance of various regions in the dynamics of an unstable global mode. In § 3, the different concepts of additive and multiplicative localized damping sensitivities are applied to the case of the cylinder. In § 4, the same methodology is applied to the transonic buffet case. The selective frequency damping (SFD) algorithm is then used to confirm the localization of the areas contributing to the global instability. In § 5, all the physical models presented in the introduction are discussed in light of the results from §§ 2 and 4. Section 6 concludes the paper with a summary of the main findings.
2 Identification of active regions in unstable global modes
After briefly recalling the concepts of base flow and global stability analysis (§ 2.1), the various concepts used to identify active regions in unstable global modes are presented: firstly (§ 2.2) the classical structural sensitivity analysis and the wavemaker region introduced in Giannetti & Luchini (Reference Giannetti and Luchini2007), secondly (§ 2.3) a localized additive perturbation analysis, thirdly (§ 2.4) a localized multiplicative sensitivity analysis introduced by Marquet & Lesshafft (Reference Marquet and Lesshafft2015) and lastly (§ 2.5) a discretized version of Marquet & Lesshafft (Reference Marquet and Lesshafft2015) technique which we interpret as a decomposition of the unstable eigenvalue
 $\unicode[STIX]{x1D706}$
into a sum of local contributions. A final section (§ 2.6) provides a summary of the various approaches and how they relate to each other.
2.1 Governing equations, base flow, direct and adjoint global modes
The governing equations are considered in a general way as
 $$\begin{eqnarray}\frac{\text{d}\boldsymbol{q}}{\text{d}t}=\boldsymbol{R}(\boldsymbol{q}),\end{eqnarray}$$
where
 $\boldsymbol{R}$
is the spatially discretized residual and
 $\boldsymbol{q}$
the state variable containing, for example in the case of compressible equations the velocity components, the density and temperature fields. In the following, it is considered to have
 $p$
variables at all points of the mesh. For example, in the case of two-dimensional flows,
 $p=3$
in the case of incompressible flow fields,
 $p=4$
if the flow is compressible and
 $p=5$
if the flow is compressible and a Spalart–Allmaras model used to define an eddy-viscosity.
The steady solution
 $\boldsymbol{q}_{0}$
of the equations, also called base flow, is a solution of
 $$\begin{eqnarray}\boldsymbol{R}(\boldsymbol{q}_{0})=0.\end{eqnarray}$$
The dynamics of small amplitude perturbations
 $\boldsymbol{q}^{\prime }(t)=\hat{\boldsymbol{q}}\exp (\unicode[STIX]{x1D706}t)$
is analysed in the vicinity of
 $\boldsymbol{q}_{0}$
by considering the eigenproblem associated with the Jacobian matrix
 $$\begin{eqnarray}\unicode[STIX]{x1D645}\hat{\boldsymbol{q}}=\unicode[STIX]{x1D706}\hat{\boldsymbol{q}},\quad J_{kl}=\left.\frac{\unicode[STIX]{x2202}R_{k}}{\unicode[STIX]{x2202}q_{l}}\right|_{\boldsymbol{q}=\boldsymbol{q}_{0}},\end{eqnarray}$$
where
 $\unicode[STIX]{x1D645}$
is the Jacobian matrix associated with
 $\boldsymbol{R}$
around the base flow,
 $R_{k}$
the
 $k$
th component of the residual and
 $q_{l}$
the state variable at a given location. The quantity
 $\unicode[STIX]{x1D706}$
describes the temporal behaviour of the perturbation; its real part
 $\unicode[STIX]{x1D70E}$
is the growth rate and its imaginary part
 $\unicode[STIX]{x1D714}$
the angular frequency.
The adjoint eigenvalue problem associated with (2.3) is introduced in the following. Let us consider an inner product based on a real symmetric positive definite matrix
 $\unicode[STIX]{x1D651}$
such that
 $\langle \boldsymbol{a},\boldsymbol{b}\rangle _{\unicode[STIX]{x1D651}}=\boldsymbol{a}^{\ast }\unicode[STIX]{x1D651}\boldsymbol{b}$
, where
 $\boldsymbol{a}$
and
 $\boldsymbol{b}$
are arbitrary vectors and the superscript
 $^{\ast }$
refers to the transconjugate. In the following, the matrix
 $\unicode[STIX]{x1D651}$
is chosen so that
 $\langle \boldsymbol{a},\boldsymbol{a}\rangle _{\unicode[STIX]{x1D651}}$
represents the square of the function
 $L_{2}$
norm. Also in the following,
 $\unicode[STIX]{x1D651}$
is a diagonal matrix for which the terms
 $V_{k}$
correspond to the volume of each cell, as is the case in a finite-volume discretization. The adjoint matrix
 $\tilde{\unicode[STIX]{x1D645}}$
is defined as
 $$\begin{eqnarray}\langle \boldsymbol{a},\unicode[STIX]{x1D645}\boldsymbol{b}\rangle _{\unicode[STIX]{x1D651}}=\langle \tilde{\unicode[STIX]{x1D645}}\boldsymbol{a},\boldsymbol{b}\rangle _{\unicode[STIX]{x1D651}}.\end{eqnarray}$$
It is straightforward to show that
 $$\begin{eqnarray}\tilde{\unicode[STIX]{x1D645}}=\unicode[STIX]{x1D651}^{-1}\unicode[STIX]{x1D645}^{\ast }\unicode[STIX]{x1D651}.\end{eqnarray}$$
It follows that the eigenvalues of
 $\tilde{\unicode[STIX]{x1D645}}$
are the complex conjugates of those of
 $\unicode[STIX]{x1D645}$
. Given an eigenvalue/eigenvector pair
 $(\unicode[STIX]{x1D706},\hat{\boldsymbol{q}})$
, the associated adjoint global mode
 $\tilde{\boldsymbol{q}}$
is solution of the eigenproblem
 $$\begin{eqnarray}\tilde{\unicode[STIX]{x1D645}}\tilde{\boldsymbol{q}}=\unicode[STIX]{x1D706}^{\ast }\tilde{\boldsymbol{q}}.\end{eqnarray}$$
An important property used in the following is the bi-orthogonality of the two bases composed by the entire sets of eigenvectors of
 $\unicode[STIX]{x1D645}$
and
 $\tilde{\unicode[STIX]{x1D645}}$
with respect to the defined inner product
 $$\begin{eqnarray}\langle \tilde{\boldsymbol{q}}_{n},\hat{\boldsymbol{q}}_{j}\rangle _{\unicode[STIX]{x1D651}}=\tilde{\boldsymbol{q}}_{n}^{\ast }\unicode[STIX]{x1D651}\hat{\boldsymbol{q}}_{j}=\unicode[STIX]{x1D6FF}_{nj},\end{eqnarray}$$
where
 $\unicode[STIX]{x1D6FF}_{nj}$
is the Kronecker symbol. It means also that the inner product of a direct eigenvector with its adjoint is normalized to be equal to one.
2.2 Structural sensitivity and wavemaker analysis
The classical way to identify flow regions responsible for a global instability is to perform the wavemaker analysis introduced by Giannetti & Luchini (Reference Giannetti and Luchini2007). This analysis is derived from a structural sensitivity analysis. The Jacobian is perturbed by an arbitrary matrix
 $\unicode[STIX]{x1D6FF}\unicode[STIX]{x1D645}$
and the eigenproblem (2.3) is modified to (Schmid & Brandt Reference Schmid and Brandt2014)
 $$\begin{eqnarray}\displaystyle (\unicode[STIX]{x1D645}+\unicode[STIX]{x1D6FF}\unicode[STIX]{x1D645})(\hat{\boldsymbol{q}}+\unicode[STIX]{x1D6FF}\hat{\boldsymbol{q}})=(\unicode[STIX]{x1D706}+\unicode[STIX]{x1D6FF}\unicode[STIX]{x1D706})(\hat{\boldsymbol{q}}+\unicode[STIX]{x1D6FF}\hat{\boldsymbol{q}}), & & \displaystyle\end{eqnarray}$$
where
 $\unicode[STIX]{x1D6FF}\unicode[STIX]{x1D706}$
and
 $\unicode[STIX]{x1D6FF}\hat{\boldsymbol{q}}$
denote the eigenvalue and eigenvector variations, respectively. Assuming these variations are small, the eigenvalue variation is straightforwardly obtained through
 $$\begin{eqnarray}\displaystyle \unicode[STIX]{x1D6FF}\unicode[STIX]{x1D706}=\tilde{\boldsymbol{q}}^{\ast }\unicode[STIX]{x1D651}\unicode[STIX]{x1D6FF}\unicode[STIX]{x1D645}\hat{\boldsymbol{q}}. & & \displaystyle\end{eqnarray}$$
To identify spatial regions of the flow where local feedback is at play in the instability, Giannetti & Luchini (Reference Giannetti and Luchini2007) considered an arbitrary matrix in the form
 $$\begin{eqnarray}\displaystyle \unicode[STIX]{x1D6FF}\unicode[STIX]{x1D645}=\unicode[STIX]{x1D644}_{k}, & & \displaystyle\end{eqnarray}$$
where
 $\unicode[STIX]{x1D644}_{k}$
is a diagonal block matrix with all diagonal blocks equal to zero except for the
 $k$
th cell where it is equal to
 $\unicode[STIX]{x1D644}_{p,p}$
, the
 $p\times p$
identity matrix. This choice induces the eigenvalue variation
 $$\begin{eqnarray}\displaystyle \unicode[STIX]{x1D6FF}\unicode[STIX]{x1D706}_{k}=\tilde{\boldsymbol{q}}_{k}^{\ast }V_{k}\hat{\boldsymbol{q}}_{k}, & & \displaystyle\end{eqnarray}$$
where
 $V_{k}$
is the volume of cell
 $k$
,
 $\hat{\boldsymbol{q}}_{k}$
and
 $\tilde{\boldsymbol{q}}_{k}$
are
 $(p,1)$
vectors equal to
 $\hat{\boldsymbol{q}}$
and
 $\tilde{\boldsymbol{q}}$
at cell
 $k$
. The magnitude of the eigenvalue variation is bounded by
 $$\begin{eqnarray}\displaystyle |\unicode[STIX]{x1D6FF}\unicode[STIX]{x1D706}_{k}|\leqslant V_{k}w_{k}\quad \text{where }w_{k}=\Vert \tilde{\boldsymbol{q}}_{k}\Vert \,\Vert \hat{\boldsymbol{q}}_{k}\Vert . & & \displaystyle\end{eqnarray}$$
The notation
 $\Vert \cdot \Vert$
designates the
 $p$
-Euclidian vector norm and
 $w_{k}$
is the so-called wavemaker function. The wavemaker allows us to identify regions where local feedback gives the largest eigenvalue variations.
2.3 Additive localized damping perturbation analysis
In order to better identify active regions of a global mode in terms of growth-rate and frequency contribution, Sipp et al. (Reference Sipp, Marquet, Meliga and Barbagallo2010) proposed perturbing the Jacobian matrix by a localized damping term
 $-\unicode[STIX]{x1D712}\unicode[STIX]{x1D644}_{S}$
where
 $\unicode[STIX]{x1D712}$
is a positive real specifying the strength of the damping and
 $\unicode[STIX]{x1D644}_{S}$
a diagonal matrix that allows us to select the damping region. Its diagonal coefficients are equal to
 $1$
(respectively
 $0$
) if the corresponding variable is inside (respectively outside) the damping region. The modified eigenproblem is
 $$\begin{eqnarray}(\unicode[STIX]{x1D645}-\unicode[STIX]{x1D712}\unicode[STIX]{x1D644}_{S})\hat{\boldsymbol{q}}_{\unicode[STIX]{x1D712}}^{a}=\unicode[STIX]{x1D706}_{\unicode[STIX]{x1D712}}^{a}\hat{\boldsymbol{q}}_{\unicode[STIX]{x1D712}}^{a},\end{eqnarray}$$
where the perturbed eigenvalue and eigenmode are respectively denoted by
 $\unicode[STIX]{x1D706}_{\unicode[STIX]{x1D712}}^{a}$
and
 $\hat{\boldsymbol{q}}_{\unicode[STIX]{x1D712}}^{a}$
, the superscript
 $a$
refers to the additive perturbation of the matrix,
 $\unicode[STIX]{x1D739}\unicode[STIX]{x1D645}=-\unicode[STIX]{x1D712}\unicode[STIX]{x1D644}_{S}$
. In the present additive case, the perturbation corresponds to a damping term proportional to the eigenmode, which can be thought of as a localized sponge region.
In the following, the case of small damping (
 $\unicode[STIX]{x1D712}\ll 1$
) is first considered (§ 2.3.1). Then (§ 2.3.2), for a given region
 $\unicode[STIX]{x1D644}_{S}$
the critical value of the damping term
 $\unicode[STIX]{x1D712}_{c}$
that may lead to marginal stability of the perturbed problem is introduced, and finally § 2.3.3 provides a convenient way to obtain
 $\unicode[STIX]{x1D712}_{c}$
from a slightly modified SFD algorithm. From a physical point of view, the activity of region
 $\unicode[STIX]{x1D644}_{S}$
will be related to the value of
 $\unicode[STIX]{x1D712}_{c}$
: if
 $\unicode[STIX]{x1D712}_{c}$
is finite, then the region is active (the instability survives to a freezing of the mode in the damping region); if
 $\unicode[STIX]{x1D712}_{c}$
is infinite, then it is inactive (the perturbed system remains unstable if the perturbation is fully frozen in the damping region).
2.3.1 Sensitivity study
For small values of the damping coefficient
 $\unicode[STIX]{x1D712}$
, the expression (2.9) can again be used to obtain the eigenvalue variation
 $$\begin{eqnarray}\unicode[STIX]{x1D6FF}\unicode[STIX]{x1D706}_{\unicode[STIX]{x1D712}}^{a}=-\unicode[STIX]{x1D712}\tilde{\boldsymbol{q}}^{\ast }\unicode[STIX]{x1D651}\unicode[STIX]{x1D644}_{S}\hat{\boldsymbol{q}}.\end{eqnarray}$$
When the damping is restricted to the
 $k$
th cell, the diagonal matrix reduces to
 $\unicode[STIX]{x1D644}_{S}=\unicode[STIX]{x1D644}_{k}$
and the eigenvalue variation may be expressed as
 $$\begin{eqnarray}\frac{(\unicode[STIX]{x1D6FF}\unicode[STIX]{x1D706}_{\unicode[STIX]{x1D712}}^{a})_{k}}{V_{k}}=-\unicode[STIX]{x1D712}(\tilde{\boldsymbol{q}}_{k}^{\ast }\hat{\boldsymbol{q}}_{k})\end{eqnarray}$$
where the eigenvalue variation has been divided by the cell volume
 $V_{k}$
in order to have a quantity that is independent of the chosen mesh. The resulting quantity corresponds to the local contribution to the eigenvalue variation. The additive growth rate and frequency variations are then obtained by taking the real and imaginary parts of the above expression, yielding
 $$\begin{eqnarray}\displaystyle \frac{(\unicode[STIX]{x1D6FF}\unicode[STIX]{x1D70E}_{\unicode[STIX]{x1D712}}^{a})_{k}}{V_{k}}=-\unicode[STIX]{x1D712}\,Re(\tilde{\boldsymbol{q}}_{k}^{\ast }\hat{\boldsymbol{q}}_{k})\quad \text{and}\quad \frac{(\unicode[STIX]{x1D6FF}\unicode[STIX]{x1D714}_{\unicode[STIX]{x1D712}}^{a})_{k}}{V_{k}}=-\unicode[STIX]{x1D712}\,Im(\tilde{\boldsymbol{q}}_{k}^{\ast }\hat{\boldsymbol{q}}_{k}). & & \displaystyle\end{eqnarray}$$
2.3.2 Additive localized perturbation analysis and activity of a given damping region
 $\unicode[STIX]{x1D644}_{S}$

Given a damping region
 $\unicode[STIX]{x1D644}_{S}$
, an additive perturbation of the form
 $-\unicode[STIX]{x1D712}\unicode[STIX]{x1D644}_{S}$
generally leads to a decrease of the growth rate
 $\unicode[STIX]{x1D70E}_{\unicode[STIX]{x1D712}}^{a}$
, since freezing perturbations in some regions usually leads to damping. Hence, if the global mode is initially unstable, that is
 $\unicode[STIX]{x1D70E}=\unicode[STIX]{x1D70E}_{\unicode[STIX]{x1D712}=0}^{a}>0$
, then there may (or may not) exist a critical value of
 $\unicode[STIX]{x1D712}_{c}$
such that
 $$\begin{eqnarray}\unicode[STIX]{x1D70E}_{\unicode[STIX]{x1D712}_{c}}^{a}=0.\end{eqnarray}$$
If this critical value exists, then it can be stated that the chosen damping region
 $\unicode[STIX]{x1D644}_{S}$
is a dynamically important region of the unstable global mode since the unstable global does not survive a freezing of the perturbation in the damping region. On the other hand, if zero amplification rate is never achieved for any
 $\unicode[STIX]{x1D712}>0$
(
 $\unicode[STIX]{x1D712}_{c}=\infty$
), then it can be concluded that
 $\unicode[STIX]{x1D644}_{S}$
is not a dynamically important region, since the unstable global mode survives with frozen perturbations in the region
 $\unicode[STIX]{x1D644}_{S}$
.
The expression (2.14) can be used to obtain a linear approximation of the critical damping value
 $\unicode[STIX]{x1D712}_{c}$
. By setting
 $\unicode[STIX]{x1D6FF}\unicode[STIX]{x1D70E}_{\unicode[STIX]{x1D712}}^{a}=-\unicode[STIX]{x1D70E}$
, the linear approximation of the critical damping coefficient is obtained
 $$\begin{eqnarray}\unicode[STIX]{x1D712}_{c}=\frac{\unicode[STIX]{x1D70E}}{Re(\tilde{\boldsymbol{q}}^{\ast }\unicode[STIX]{x1D651}\unicode[STIX]{x1D644}_{S}\hat{\boldsymbol{q}})}.\end{eqnarray}$$
Yet, one has to keep in mind that the growth-rate
 $\unicode[STIX]{x1D70E}_{\unicode[STIX]{x1D712}}^{a}$
may be a strongly nonlinear function of
 $\unicode[STIX]{x1D712}$
so that linear approximations may not be valid. Note that, when the damping region is the whole domain (
 $\unicode[STIX]{x1D644}_{S}=\unicode[STIX]{x1D644}$
), the critical coefficient is the growth rate of the eigenmode
 $\unicode[STIX]{x1D712}_{c}=\unicode[STIX]{x1D70E}$
.
2.3.3 Selective frequency damping methods
The additive damping approach introduced above requires solving eigenvalue problems. It is proposed here to adapt the SFD algorithm introduced by Åkervik et al. (Reference Åkervik, Brandt, Henningson, Hœpffner, Marxen and Schlatter2006) in order to determine
 $\unicode[STIX]{x1D712}_{c}$
for a given damping region
 $\unicode[STIX]{x1D644}_{S}$
and therefore avoid the resolution of eigenvalue problems.
The following modified version of the SFD algorithm is proposed:
 $$\begin{eqnarray}\left\{\begin{array}{@{}l@{}}\displaystyle \frac{\text{d}\boldsymbol{q}}{\text{d}t}=\boldsymbol{R}(\boldsymbol{q})-\unicode[STIX]{x1D712}\unicode[STIX]{x1D644}_{S}(\boldsymbol{q}-\boldsymbol{q}_{f})\\ \displaystyle \frac{\text{d}\boldsymbol{q}_{f}}{\text{d}t}=\displaystyle \frac{\boldsymbol{q}-\boldsymbol{q}_{f}}{\unicode[STIX]{x1D6E5}}\end{array}\right.,\end{eqnarray}$$
where the second equation is the low-pass filter with a cutoff angular frequency
 $1/\unicode[STIX]{x1D6E5}$
and the second equation the initial governing equations with an additional damping term. This damping term is proportional to the difference between the solution
 $\boldsymbol{q}$
and the filtered solution
 $\boldsymbol{q}_{f}$
: if applied on the full domain
 $\unicode[STIX]{x1D644}_{S}=\unicode[STIX]{x1D644}$
, the initial SFD algorithm is recovered, it forces the solution to converge towards the steady state. If
 $\unicode[STIX]{x1D644}_{S}\neq \unicode[STIX]{x1D644}$
, the damping term
 $-\unicode[STIX]{x1D712}\unicode[STIX]{x1D644}_{S}(\boldsymbol{q}-\boldsymbol{q}_{f})$
is only active in the region defined by
 $\unicode[STIX]{x1D644}_{S}$
and will only freeze the perturbations in this region.
It is now shown that applying this algorithm enables us to retrieve the critical values
 $\unicode[STIX]{x1D712}_{c}$
defined in equation (2.17). For this, let us consider the linear dynamics of perturbations around the fixed point
 $(\boldsymbol{q},\boldsymbol{q}_{f})=(\boldsymbol{q}_{0},\boldsymbol{q}_{0})+(\boldsymbol{q}^{\prime },\boldsymbol{q}_{f}^{\prime })$
in the modified SFD equations
 $$\begin{eqnarray}\displaystyle \frac{\text{d}}{\text{d}t}\left(\begin{array}{@{}c@{}}\boldsymbol{q}^{\prime }\\ \boldsymbol{q}_{f}^{\prime }\end{array}\right)=\left(\begin{array}{@{}cc@{}}J-\unicode[STIX]{x1D712}\unicode[STIX]{x1D644}_{S} & \unicode[STIX]{x1D712}\unicode[STIX]{x1D644}_{S}\\ I/\unicode[STIX]{x1D6E5} & -I/\unicode[STIX]{x1D6E5}\end{array}\right)\left(\begin{array}{@{}c@{}}\boldsymbol{q}^{\prime }\\ \boldsymbol{q}_{f}^{\prime }\end{array}\right). & & \displaystyle\end{eqnarray}$$
In the case where
 $\unicode[STIX]{x1D6E5}\rightarrow \infty$
, the eigenvalues of the coupled system therefore correspond to those of
 $\unicode[STIX]{x1D645}-\unicode[STIX]{x1D712}\unicode[STIX]{x1D644}_{S}$
and additional zero eigenvalues stemming from the filter. The modified SFD algorithm therefore enables us to recover the critical values
 $\unicode[STIX]{x1D712}_{c}$
of (2.17); for a given region
 $\unicode[STIX]{x1D644}_{S}$
and a given damping term
 $\unicode[STIX]{x1D712}$
, if solving for the coupled system results in a steady (respectively unsteady) solution, then
 $\unicode[STIX]{x1D712}_{c}<\unicode[STIX]{x1D712}$
(respectively
 $\unicode[STIX]{x1D712}_{c}>\unicode[STIX]{x1D712}$
).
Note that in practice, the SFD algorithm becomes inefficient if
 $\unicode[STIX]{x1D6E5}$
is too large, so that a compromise needs to be found between very large values of
 $\unicode[STIX]{x1D6E5}$
, which are required for the SFD algorithm to retrieve the critical values
 $\unicode[STIX]{x1D712}_{c}$
, and lower values of
 $\unicode[STIX]{x1D6E5}$
, which are required for the SFD algorithm to converge efficiently.
2.4 Multiplicative localized damping perturbation analysis
In addition to the additive perturbation considered in §§ 2.2 and 2.3, Marquet & Lesshafft (Reference Marquet and Lesshafft2015) proposed perturbing the Jacobian matrix by retaining the local structure of the Jacobian matrix, that is a multiplicative perturbation matrix of the form
 $$\begin{eqnarray}(\unicode[STIX]{x1D644}-\unicode[STIX]{x1D712}\unicode[STIX]{x1D644}_{S})\unicode[STIX]{x1D645}\hat{\boldsymbol{q}}_{\unicode[STIX]{x1D712}}^{m}=\unicode[STIX]{x1D706}_{\unicode[STIX]{x1D712}}^{m}\hat{\boldsymbol{q}}_{\unicode[STIX]{x1D712}}^{m},\end{eqnarray}$$
where the perturbed eigenvalue/eigenvector respectively denoted
 $\unicode[STIX]{x1D706}_{\unicode[STIX]{x1D712}}^{m}$
and
 $\hat{\boldsymbol{q}}_{\unicode[STIX]{x1D712}}^{m}$
, depends on the (real) damping coefficient
 $\unicode[STIX]{x1D712}$
. The diagonal matrix
 $\unicode[STIX]{x1D644}_{S}$
is defined as for the additive case, while the damping coefficient lies in the range
 $0\leqslant \unicode[STIX]{x1D712}\leqslant 1$
. The superscript
 $m$
refers to the multiplicative perturbation
 $(\unicode[STIX]{x1D644}-\unicode[STIX]{x1D712}\unicode[STIX]{x1D644}_{S})$
. Inside this region, the Jacobian matrix is damped by the factor
 $(1-\unicode[STIX]{x1D712})$
. The modified operator can be rewritten as
 $(\unicode[STIX]{x1D644}-\unicode[STIX]{x1D712}\unicode[STIX]{x1D644}_{S})\unicode[STIX]{x1D645}=(\unicode[STIX]{x1D645}-\unicode[STIX]{x1D712}\unicode[STIX]{x1D644}_{S}\unicode[STIX]{x1D645})$
showing that it corresponds to the additive matrix perturbation
 $\unicode[STIX]{x1D6FF}\unicode[STIX]{x1D645}=-\unicode[STIX]{x1D712}\unicode[STIX]{x1D644}_{S}\,\unicode[STIX]{x1D645}$
. This form is convenient for determining the eigenvalue variation for small values of the damping coefficient
 $\unicode[STIX]{x1D712}$
. Using (2.9), it gives
 $$\begin{eqnarray}\displaystyle \unicode[STIX]{x1D6FF}\unicode[STIX]{x1D706}_{\unicode[STIX]{x1D712}}^{m}=-\unicode[STIX]{x1D712}\tilde{\boldsymbol{q}}^{\ast }\unicode[STIX]{x1D651}\unicode[STIX]{x1D644}_{S}\unicode[STIX]{x1D645}\hat{\boldsymbol{q}}=-\unicode[STIX]{x1D712}\unicode[STIX]{x1D706}\tilde{\boldsymbol{q}}^{\ast }\unicode[STIX]{x1D651}\unicode[STIX]{x1D644}_{S}\hat{\boldsymbol{q}}. & & \displaystyle\end{eqnarray}$$
When the damping is restricted to the
 $k$
th cell, the diagonal matrix reduces to
 $\unicode[STIX]{x1D644}_{S}=\unicode[STIX]{x1D644}_{k}$
and the eigenvalue variation divided by the cell volume may be expressed in the form
 $$\begin{eqnarray}\displaystyle \frac{(\unicode[STIX]{x1D6FF}\unicode[STIX]{x1D706}_{\unicode[STIX]{x1D712}}^{m})_{k}}{V_{k}}=-\unicode[STIX]{x1D712}\,d_{k} & & \displaystyle\end{eqnarray}$$
with
 $$\begin{eqnarray}d_{k}=\unicode[STIX]{x1D706}(\tilde{\boldsymbol{q}}_{k}^{\ast }\hat{\boldsymbol{q}}_{k}).\end{eqnarray}$$
The density
 $d_{k}$
, defined in (2.24), is the discrete counterpart of the so-called endogeneity field introduced in Marquet & Lesshafft (Reference Marquet and Lesshafft2015). The multiplicative growth rate and frequency variations are then obtained by taking the real and imaginary parts of the above expression, yielding
 $$\begin{eqnarray}\displaystyle \frac{(\unicode[STIX]{x1D6FF}\unicode[STIX]{x1D70E}_{\unicode[STIX]{x1D712}}^{m})_{k}}{V_{k}}=-\unicode[STIX]{x1D712}Re(d_{k}),\quad \frac{(\unicode[STIX]{x1D6FF}\unicode[STIX]{x1D714}_{\unicode[STIX]{x1D712}}^{m})_{k}}{V_{k}}=-\unicode[STIX]{x1D712}Im(d_{k}). & & \displaystyle\end{eqnarray}$$
The expressions (2.23) and (2.15) of the multiplicative and additive eigenvalue variations are very similar and related to the local density contribution as
 $$\begin{eqnarray}\displaystyle -\unicode[STIX]{x1D712}\,d_{k}=\frac{(\unicode[STIX]{x1D6FF}\unicode[STIX]{x1D706}_{\unicode[STIX]{x1D712}}^{m})_{k}}{V_{k}}=\unicode[STIX]{x1D706}\frac{(\unicode[STIX]{x1D6FF}\unicode[STIX]{x1D706}_{\unicode[STIX]{x1D712}}^{a})_{k}}{V_{k}}. & & \displaystyle\end{eqnarray}$$
Introducing the polar decomposition of the eigenvalue
 $\unicode[STIX]{x1D706}=|\unicode[STIX]{x1D706}|\text{e}^{\text{i}\unicode[STIX]{x1D719}}$
shows that the additive and multiplicative growth rate and frequency variations are related by
 $$\begin{eqnarray}(\unicode[STIX]{x1D6FF}\unicode[STIX]{x1D70E}_{\unicode[STIX]{x1D712}}^{m})_{k}=|\unicode[STIX]{x1D706}|\,Re(\text{e}^{\text{i}\unicode[STIX]{x1D719}}(\unicode[STIX]{x1D6FF}\unicode[STIX]{x1D706}_{\unicode[STIX]{x1D712}}^{a})_{k})\quad \text{and}\quad (\unicode[STIX]{x1D6FF}\unicode[STIX]{x1D714}_{\unicode[STIX]{x1D712}}^{m})_{k}=|\unicode[STIX]{x1D706}|\,Im(\text{e}^{\text{i}\unicode[STIX]{x1D719}}(\unicode[STIX]{x1D6FF}\unicode[STIX]{x1D706}_{\unicode[STIX]{x1D712}}^{a})_{k}).\end{eqnarray}$$
Close to a bifurcation threshold, the growth rate is nearly equal to zero, and thus
 $|\unicode[STIX]{x1D706}|\approx Im(\unicode[STIX]{x1D706})$
and
 $\unicode[STIX]{x1D719}\approx \unicode[STIX]{x03C0}/2$
. The above relation then simplifies to
 $$\begin{eqnarray}(\unicode[STIX]{x1D6FF}\unicode[STIX]{x1D70E}_{\unicode[STIX]{x1D712}}^{m})_{k}\approx -|\unicode[STIX]{x1D706}|\,(\unicode[STIX]{x1D6FF}\unicode[STIX]{x1D714}_{\unicode[STIX]{x1D712}}^{a})_{k}\quad \text{and}\quad (\unicode[STIX]{x1D6FF}\unicode[STIX]{x1D714}_{\unicode[STIX]{x1D712}}^{m})_{k}\approx |\unicode[STIX]{x1D706}|\,(\unicode[STIX]{x1D6FF}\unicode[STIX]{x1D70E}_{\unicode[STIX]{x1D712}}^{a})_{k},\end{eqnarray}$$
which shows that the multiplicative growth rate variation is proportional to the additive frequency variation, and conversely the multiplicative frequency variation is proportional to the additive growth rate variation.
2.5 Local contribution to an eigenvalue based on operator’s decompositions
The analysis developed here aims at identifying contributions to an eigenvalue of non-overlapping regions localized in space (cells in the discrete framework chosen here), and whose sum over all these non-overlapping regions (cells) results in the eigenvalue of interest. We therefore reformulate at the discretized level the previous analyses of Giannetti & Luchini (Reference Giannetti and Luchini2007), Marquet et al. (Reference Marquet, Sipp and Jacquin2008) and Marquet & Lesshafft (Reference Marquet and Lesshafft2015), which were based on a structural sensitivity of the eigenvalue problem and aimed at identifying regions in space yielding the largest eigenvalue variation, and interpret them in terms of decompositions of the Jacobian matrix, either into column- or row-matrices. This approach shows how to compute the contributions from these sub-matrices and provides a unified (simplified) expression for the two decompositions. This expression is identical to the eigenvalue variation given in § 2.4 when considering a multiplicative perturbation of the Jacobian matrix.
The Jacobian matrix
 $\unicode[STIX]{x1D645}$
is first decomposed into
 $$\begin{eqnarray}\displaystyle \unicode[STIX]{x1D645}=\left(\mathop{\sum }_{k=1}^{N_{c}}\unicode[STIX]{x1D63E}_{k}\right), & & \displaystyle\end{eqnarray}$$
where
 $N_{c}$
is the total number of cells in the mesh and
 $\unicode[STIX]{x1D63E}_{k}$
is the column-matrix composed of the
 $k$
th column of the full Jacobian
 $$\begin{eqnarray}\unicode[STIX]{x1D63E}_{\boldsymbol{k}}=\left[\begin{array}{@{}ccccccc@{}}0 & \cdots \, & 0 & \displaystyle \frac{\unicode[STIX]{x2202}\boldsymbol{R}_{1}}{\unicode[STIX]{x2202}\boldsymbol{q}_{k}} & 0 & \cdots \, & 0\\ \displaystyle \vdots & \cdots \, & \cdots \, & \vdots & \cdots \, & \cdots \, & \vdots \\ \vdots & \cdots \, & \cdots \, & \vdots & \cdots \, & \cdots \, & \vdots \\ 0 & \cdots \, & 0 & \displaystyle \frac{\unicode[STIX]{x2202}\boldsymbol{R}_{l}}{\unicode[STIX]{x2202}\boldsymbol{q}_{k}} & 0 & \cdots \, & 0\\ \displaystyle \vdots & \cdots \, & \cdots \, & \vdots & \cdots \, & \cdots \, & \vdots \\ \vdots & \cdots \, & \cdots \, & \vdots & \cdots \, & \cdots \, & \vdots \\ \displaystyle 0 & \cdots \, & 0 & \displaystyle \frac{\unicode[STIX]{x2202}\boldsymbol{R}_{N_{c}}}{\unicode[STIX]{x2202}\boldsymbol{q}_{k}} & 0 & \cdots \, & 0\end{array}\right],\end{eqnarray}$$
where
 $\unicode[STIX]{x2202}\boldsymbol{R}_{l}/\unicode[STIX]{x2202}\boldsymbol{q}_{k}$
is a
 $p\times p$
matrix representing the
 $p$
governing equations at cell
 $l$
and linearized with respect to the
 $p$
state variables at cell
 $k$
. The column-matrix decomposition (2.29) is introduced into the eigenvalue problem (2.3), yielding
 $$\begin{eqnarray}\displaystyle \unicode[STIX]{x1D706}\hat{\boldsymbol{q}}=\left(\mathop{\sum }_{k=1}^{N_{c}}\unicode[STIX]{x1D63E}_{\boldsymbol{k}}\right)\hat{\boldsymbol{q}}=\mathop{\sum }_{k=1}^{N_{c}}(\unicode[STIX]{x1D63E}_{\boldsymbol{k}}\hat{\boldsymbol{q}}). & & \displaystyle\end{eqnarray}$$
The objective of the method is to quantify the contribution of the column-matrices
 $\unicode[STIX]{x1D63E}_{\boldsymbol{k}}$
to the eigenvalue
 $\unicode[STIX]{x1D706}$
associated with the eigenmode
 $\hat{\boldsymbol{q}}$
. To that aim, the matrix-vector product of the column-matrix with the eigenmode is expanded onto the non-orthogonal basis of the eigenmodes following
 $$\begin{eqnarray}\unicode[STIX]{x1D63E}_{\boldsymbol{k}}\hat{\boldsymbol{q}}=\unicode[STIX]{x1D706}_{k}\hat{\boldsymbol{q}}+\boldsymbol{r}_{k},\end{eqnarray}$$
where
 $\unicode[STIX]{x1D706}_{k}$
is the projection coefficient of
 $\unicode[STIX]{x1D63E}_{\boldsymbol{k}}\hat{\boldsymbol{q}}$
along the eigenmode
 $\hat{\boldsymbol{q}}$
and the residual
 $\boldsymbol{r}_{k}$
is non-zero (since
 $\hat{\boldsymbol{q}}$
is not an eigenvector of
 $\unicode[STIX]{x1D63E}_{\boldsymbol{k}}$
) and belongs to the subspace spanned by all eigenmodes except the eigenmode of interest
 $\hat{\boldsymbol{q}}$
. In other words, the projection coefficient
 $\unicode[STIX]{x1D706}_{k}$
gives the contribution of the matrix-vector product
 $\unicode[STIX]{x1D63E}_{\boldsymbol{k}}\hat{\boldsymbol{q}}$
in the direction of the eigenmode. It may straightforwardly be determined from the expression
 $$\begin{eqnarray}\unicode[STIX]{x1D706}_{k}=\tilde{\boldsymbol{q}}^{\ast }\,\unicode[STIX]{x1D651}\unicode[STIX]{x1D63E}_{\boldsymbol{k}}\,\hat{\boldsymbol{q}}.\end{eqnarray}$$
obtained by using the bi-orthogonality condition between direct and adjoint global modes. These projection coefficients can be further interpreted as a contribution localized to the cell
 $k$
. Although the vector
 $\unicode[STIX]{x1D63E}_{k}\hat{\boldsymbol{q}}$
may have non-zero coefficients for cells
 $l\neq k$
, these coefficients only depend on the values of the eigenmode at cell
 $k$
. For that reason, the projection coefficient
 $\unicode[STIX]{x1D706}_{k}$
can be viewed as the contribution of the cell
 $k$
to the eigenvalue. Moreover, it is easy to verify that
 $$\begin{eqnarray}\mathop{\sum }_{k=1}^{N_{c}}\unicode[STIX]{x1D706}_{k}=\tilde{\boldsymbol{q}}^{\ast }\,\unicode[STIX]{x1D651}\left(\mathop{\sum }_{k=1}^{N_{c}}\unicode[STIX]{x1D63E}_{k}\right)\hat{\boldsymbol{q}}=\tilde{\boldsymbol{q}}^{\ast }\,\unicode[STIX]{x1D651}\unicode[STIX]{x1D645}\hat{\boldsymbol{q}}=\tilde{\boldsymbol{q}}^{\ast }\,\unicode[STIX]{x1D651}\unicode[STIX]{x1D706}\hat{\boldsymbol{q}}=\unicode[STIX]{x1D706}.\end{eqnarray}$$
This relation clearly shows that the eigenvalue
 $\unicode[STIX]{x1D706}$
is the sum of local contributions
 $\unicode[STIX]{x1D706}_{k}$
originating from cells
 $k$
. The expression (2.33) requires extracting the column-matrices
 $\unicode[STIX]{x1D63E}_{k}$
to compute the local contributions. As shown in appendix A, this expression may be further simplified to
 $$\begin{eqnarray}\displaystyle \unicode[STIX]{x1D706}_{k}=V_{k}\unicode[STIX]{x1D706}(\tilde{\boldsymbol{q}}_{k}^{\ast }\hat{\boldsymbol{q}}_{k})=V_{k}d_{k}, & & \displaystyle\end{eqnarray}$$
remembering that
 $d_{k}$
has been defined in (2.24). Compared to (2.33), this new expression is easier to compute since it only involves the local product between the direct and adjoint eigenmodes. Moreover, it also suggests that the local contribution
 $\unicode[STIX]{x1D706}_{k}$
is not specifically related to the column decomposition (2.29) of the Jacobian matrix. The latter could also be decomposed as
 $$\begin{eqnarray}\displaystyle \unicode[STIX]{x1D645}=\left(\mathop{\sum }_{k=1}^{N_{c}}\unicode[STIX]{x1D647}_{k}\right), & & \displaystyle\end{eqnarray}$$
where
 $\boldsymbol{L}_{k}$
denotes the row-matrix composed of the
 $k$
th row of the Jacobian
 $\unicode[STIX]{x1D645}$
. In appendix B, it is shown that
 $$\begin{eqnarray}\unicode[STIX]{x1D706}_{k}=\tilde{\boldsymbol{q}}^{\ast }\unicode[STIX]{x1D651}\boldsymbol{L}_{k}\hat{\boldsymbol{q}}=V_{k}\unicode[STIX]{x1D706}(\tilde{\boldsymbol{q}}_{k}^{\ast }\hat{\boldsymbol{q}}_{k})=V_{k}d_{k},\end{eqnarray}$$
which is the row counterpart of (2.33) and (2.35). The coefficient
 $\unicode[STIX]{x1D706}_{k}$
may therefore be interpreted in a different and complementary way: it also corresponds to the contribution of the
 $p$
governing equations written at point
 $k$
to the eigenvalue
 $\unicode[STIX]{x1D706}$
since
 $\boldsymbol{L}_{k}\hat{\boldsymbol{q}}$
is non-zero only at the
 $k$
th point. The local contribution
 $\unicode[STIX]{x1D706}_{k}$
is a quantity that depends on the volume
 $V_{k}$
of the
 $k$
th cell (2.33). It is therefore considered that
 $$\begin{eqnarray}\frac{\unicode[STIX]{x1D706}_{k}}{V_{k}}=d_{k}\end{eqnarray}$$
so that the integral of the continuous density field
 $d(\boldsymbol{x})$
over the computational domain
 $\unicode[STIX]{x1D6FA}$
is equal to the eigenvalue, i.e.
 $$\begin{eqnarray}\unicode[STIX]{x1D706}=\mathop{\sum }_{k=1}^{N_{c}}\unicode[STIX]{x1D706}_{k}=\mathop{\sum }_{k=1}^{N_{c}}d_{k}V_{k}\simeq \int _{\unicode[STIX]{x1D6FA}}\text{d}(x)\,\text{d}\unicode[STIX]{x1D6FA}.\end{eqnarray}$$
The real
 $Re$
and imaginary
 $Im$
parts of the complex density
 $d_{k}$
define the growth rate and angular frequency densities as
 $$\begin{eqnarray}\unicode[STIX]{x1D70E}=\mathop{\sum }_{k=1}^{N_{c}}Re(d_{k})V_{k}\quad \text{and}\quad \unicode[STIX]{x1D714}=\mathop{\sum }_{k=1}^{N_{c}}Im(d_{k})V_{k}.\end{eqnarray}$$
2.6 Summary
All approaches described above (except the wavemaker) rely on the analysis of two quantities, the real and imaginary parts of
 $d_{k}$
defined in (2.24). Following equation (2.40), these correspond respectively to the growth rate and frequency densities of the eigenvalue
 $\unicode[STIX]{x1D706}=\unicode[STIX]{x1D70E}+\text{i}\unicode[STIX]{x1D714}$
. From (2.26) and (2.28), they are also related to the additive and multiplicative localized sensitivities following
 $$\begin{eqnarray}\displaystyle & \displaystyle -\unicode[STIX]{x1D712}Re(d_{k})=\frac{(\unicode[STIX]{x1D6FF}\unicode[STIX]{x1D70E}_{\unicode[STIX]{x1D712}}^{m})_{k}}{V_{k}}\approx -|\unicode[STIX]{x1D706}|\frac{(\unicode[STIX]{x1D6FF}\unicode[STIX]{x1D714}_{\unicode[STIX]{x1D712}}^{a})_{k}}{V_{k}}, & \displaystyle\end{eqnarray}$$
 $$\begin{eqnarray}\displaystyle & \displaystyle -\unicode[STIX]{x1D712}Im(d_{k})=\frac{(\unicode[STIX]{x1D6FF}\unicode[STIX]{x1D714}_{\unicode[STIX]{x1D712}}^{m})_{k}}{V_{k}}\approx |\unicode[STIX]{x1D706}|\frac{(\unicode[STIX]{x1D6FF}\unicode[STIX]{x1D70E}_{\unicode[STIX]{x1D712}}^{a})_{k}}{V_{k}}. & \displaystyle\end{eqnarray}$$
Note that the approximation symbol used here reminds us that the relations are only valid for nearly marginal systems (
 $\unicode[STIX]{x1D70E}\approx 0$
,
 $\unicode[STIX]{x1D714}>0$
).
Finally, following § 2.3.2, to determine whether a given region
 $\unicode[STIX]{x1D644}_{S}$
is active or not, one may look for damping values
 $\unicode[STIX]{x1D712}$
that render the additively perturbed Jacobian
 $\unicode[STIX]{x1D645}-\unicode[STIX]{x1D712}\unicode[STIX]{x1D644}_{S}$
stable. This may be achieved in an easy way by time stepping the modified SFD algorithm, as presented in § 2.3.3.
3 Application to the vortex-shedding cylinder mode
Results of the various analyses introduced in the previous section are first shown for the circular cylinder flow configuration. A cylinder of diameter
 $D$
is immersed in an incompressible flow of uniform upstream velocity
 $U_{\infty }$
; in this section, all the variables are made non-dimensional using these two quantities. The Reynolds number is thus defined as
 $Re=U_{\infty }D/\unicode[STIX]{x1D708}$
, where
 $\unicode[STIX]{x1D708}$
is the kinematic viscosity. In the governing equations (2.1), the residual
 $\boldsymbol{R}$
corresponds to the incompressible Navier–Stokes equations and the flow variable is defined as
 $\boldsymbol{q}=(\boldsymbol{U},p)$
, where
 $\boldsymbol{U}$
is the flow velocity and
 $p$
is the pressure field. For this case, the free software FreeFem++ (Hecht Reference Hecht2012), better adapted for this type of configuration, is used. These equations are discretized with a finite-element approach onto a triangular mesh composed of approximately
 $40\,000$
triangles in a domain of spatial extent
 $30$
in the cross-stream direction (
 $y$
) and
 $40$
in the streamwise direction (
 $x$
).
For the Reynolds number
 $Re=60$
considered in the following, the base flow
 $\boldsymbol{q}_{0}$
solution of (2.2) is unstable, since the leading complex eigenvalue
 $\unicode[STIX]{x1D706}=0.052+0.787\,\text{i}$
obtained by solving (2.3) has a positive real part (growth rate). The spatial structure of the eigenmode associated with this eigenvalue is displayed in figure 3(a) with the real part of the streamwise velocity component. The symmetry of the base flow in the cross-stream direction is broken and the oscillating pattern in the streamwise direction explains the vortex-shedding observed in the wake of the circular cylinder. The largest magnitude of the velocity is obtained in the far wake, as a result of a spatial amplification of the perturbation. As explained by Chomaz (Reference Chomaz2005), the region of maximal velocity amplitude does not correspond to the region of largest local feedback. The latter is rather identified by considering the wavemaker function
 $w_{k}$
defined in (2.12) and shown in figure 3(b) for the vortex-shedding eigenmode. This figure exactly reproduces the wavemaker function first shown by Giannetti & Luchini (Reference Giannetti and Luchini2007) for the circular cylinder. The isocontours correspond to the magnitudes of the largest eigenvalue variation
 $|\unicode[STIX]{x1D706}|$
that can be achieved by any local modification of the Jacobian matrix. The spatial region identified by the wavemaker function is clearly not in the far wake, but much closer to the recirculation regions of the base flow, delimited by the black curves in the figures.
Circular cylinder flow at
 $\mathit{Re}=60$
. (a) Streamwise velocity of the vortex-shedding eigenmode associated with the most unstable eigenvalue and (b) wavemaker function
 $w_{k}$
defined in (2.12). The black curves delimit the recirculation regions in the base flow.

Unlike the wavemaker function
 $w_{k}$
, the local contribution to the eigenvalue
 $\unicode[STIX]{x1D706}_{k}$
defined in (2.35) allows us to distinguish the contributions to the growth rate and frequency. The density contributions to the growth rate
 $Re(d_{k})$
and frequency
 $Im(d_{k})$
are displayed in figure 4(a,b) for the vortex-shedding eigenmode. In the growth rate density map, positive values (in red) indicate regions contributing to the destabilization of the eigenmode, while negative values (in blue) indicate regions contributing to the stabilization of the eigenmode. The sum over the computational domain of all these local contributions gives the positive growth rate of the eigenmode
 $Re(\unicode[STIX]{x1D70E})=0.052$
. Regions close to the two separation points of the base flow contribute to the destabilization of the eigenmode. On the other hand, the region immediately downstream of the cylinder, that is located inside the recirculation region of the base flow, has a stabilizing contribution to the vortex-shedding eigenmode. Interestingly, these two regions are not identified by the wavemaker function, that is larger further downstream, in the region of the base flow shear-layer. The growth rate density map shows that the upper part of the shear-layer has a stabilizing effect, unlike the lower part that is destabilizing. The contribution to the frequency, displayed in figure 4(b), is very similar to the wavemaker map shown in figure 3(b). Unlike for the growth rate, all positions have a positive contribution to the frequency, in agreement with the positivity of the frequency.
Local contributions to the unstable eigenvalue corresponding to the vortex-shedding eigenmode shown in figure 3(a). Density contribution to (a) the growth rate
 $Re(d_{k})$
and (b) the angular frequency
 $Im(d_{k})$
defined in (2.24). The black curves delimit the recirculation regions in the base flow.

Additive localized damping approach. (a) Real and (b) imaginary parts of (2.14), the additive growth rate and frequency variation (weighted by the local area and divided by
 $\unicode[STIX]{x1D712}$
) for the vortex-shedding eigenmode.

The attention now turns to the multiplicative perturbation approach presented in § 2.4. For a damping region restricted to the
 $k$
th triangle, the multiplicative growth rate and frequency variations are defined in (2.25). They are straightforwardly deduced from the localized contributions displayed in figure 4. Considering the growth rate, the red (respectively blue) regions seen in figure 4(a) are stabilizing (respectively destabilizing) and the growth rate variation is given the iso-contour value, multiplied by the damping coefficient
 $\unicode[STIX]{x1D712}$
. On the other hand, the map shown in figure 4(b) indicates that a multiplicative localized damping decreases the frequency, for all positions.
For the additive localized damping approach presented in § 2.3, the growth rate and frequency variations are defined in (2.16) and plotted in figure 5 for the vortex-shedding eigenmode. In figure 5(a), it is observed that the additive growth rate variation is negative for all positions, unlike for the multiplicative approach. This map is strikingly similar to the multiplicative frequency map displayed in figure 4(b). The additive frequency map is displayed in figure 5(b), showing that the frequency increases and decreases in the red and blue regions, respectively. This frequency map is now very similar to the multiplicative growth rate map shown in figure 4(a). Close to a bifurcation threshold, the phase
 $\unicode[STIX]{x1D719}$
of an eigenvalue in the polar decomposition
 $\unicode[STIX]{x1D706}=|\unicode[STIX]{x1D706}|\text{e}^{\text{i}\unicode[STIX]{x1D719}}$
, is close to
 $\unicode[STIX]{x1D719}=\unicode[STIX]{x03C0}/2$
. For the vortex-shedding eigenmode at
 $Re=60$
, the phase is indeed
 $\unicode[STIX]{x1D719}=0.98\unicode[STIX]{x03C0}/2$
. Then, as explained in § 2.4, the additive growth rate variation is proportional to the multiplicative frequency variation, and vice versa.
The link existing between the local contribution to the eigenvalue, the multiplicative and the additive eigenvalue variations is thus established. The two first approaches identify the same spatial regions for the growth rate and frequency, while the latter exchanges the growth rate and frequency maps. The growth rate map in the additive perturbation approach corresponds to the frequency map in the multiplicative perturbation approach.
The above results of the multiplicative and additive damping approaches are valid for damping regions restricted to the size of the cell/triangle and for small values of the damping coefficient
 $\unicode[STIX]{x1D712}$
. The influence of the damping region’s size and values of the damping coefficient on the results obtained with the additive approach is now investigated. The leading eigenvalues
 $\unicode[STIX]{x1D706}_{\unicode[STIX]{x1D712}}^{m}$
and
 $\unicode[STIX]{x1D706}_{\unicode[STIX]{x1D712}}^{a}$
of the eigenvalue problem (2.21) and (2.13) are computed for increasing values of the damping coefficient
 $\unicode[STIX]{x1D712}$
and for the diagonal matrix
 $\unicode[STIX]{x1D644}_{s}$
with diagonal coefficients being non-zero inside circles centred on
 $(x_{s},y_{s})$
of radius
 $r_{s}$
.
Growth rate as a function of the damping coefficient
 $\unicode[STIX]{x1D712}$
obtained for (a) multiplicative and (b) additive perturbations of the Jacobian matrix with circular damping regions centred around
 $(x_{s},y_{s})=(2.0,0.9)$
of radius
 $r_{s}=0.05$
(black curve),
 $r_{s}=0.10$
(blue),
 $r_{s}=0.15$
(red) and
 $r_{s}=0.20$
(green).

The investigation is first performed for the specific location
 $(x_{s},y_{s})=(2.0,0.9)$
, for which the linear localized analysis predicts a large destabilization (respectively stabilization) of the eigenvalue by a multiplicative (respectively additive) perturbation of the operator, as seen in figure 4 (respectively figure 5). The growth rates are depicted as a function of the damping coefficient, in figure 6(a,b) for the multiplicative and additive damping approach, respectively. The dashed lines correspond to the linear predictions (
 $\unicode[STIX]{x1D706}_{\unicode[STIX]{x1D712}}=\unicode[STIX]{x1D706}+\unicode[STIX]{x1D6FF}\unicode[STIX]{x1D706}_{\unicode[STIX]{x1D712}}^{m}$
or
 $\unicode[STIX]{x1D706}_{\unicode[STIX]{x1D712}}=\unicode[STIX]{x1D706}+\unicode[STIX]{x1D6FF}\unicode[STIX]{x1D706}_{\unicode[STIX]{x1D712}}^{a}$
) where the multiplicative and additive variations are given by (2.41). In both cases, for small values of
 $\unicode[STIX]{x1D712}$
, identical growth rates to those predicted by the linear approach are obtained, confirming the validity of the latter. Increasing the radius of the damping region yields an increase (respectively decrease) of the growth rate for a multiplicative (respectively additive) damping approach. For larger values of
 $\unicode[STIX]{x1D712}$
, it is observed that the growth rates are not as increased (respectively decreased) as were predicted by the linear approximations. Let us examine in more detail results of the additive damping approach in figure 6(b). For the smaller radius explored here (black curve), the larger value
 $\unicode[STIX]{x1D712}=90$
does not allow stabilization of the eigenvalue. As proposed in § 2.3.2, it could be concluded that this damping region is not a dynamically important region, since the global mode is still unstable even for very large values of the damping coefficient. On the other hand, increasing its size clearly increases its dynamical activity, since for larger values of the radius, finite values of the damping coefficient allow stabilization of the eigenvalue (red and green curves). In addition to the position of the damping region, its size is a crucial parameter in determining the dynamical activity of a region.
The influence of finite values of the damping coefficient is now investigated for other spatial regions. For the multiplicative approach, figure 7(a,b) depicts the growth rate and frequency variations, respectively, obtained for the damping coefficient
 $\unicode[STIX]{x1D712}=0.5$
and by varying the positions of the damping regions centred around
 $(x_{s},y_{s})$
with a fixed radius
 $r_{s}=0.1$
. Both maps are very similar to the local contribution maps, displayed in figure 4. In red regions, a multiplicative perturbation gives an increase of the growth rate, i.e. a destabilisation of the eigenmode. For the additive approach, figures 8(a,b) and 8(c,d) depict the growth rate and frequency variations obtained for
 $\unicode[STIX]{x1D712}=1$
and
 $\unicode[STIX]{x1D712}=10$
, respectively. Results obtained for the smallest value are very similar to the maps shown in figure 5 and obtained with the linear localized approach. When the damping coefficient is larger (
 $\unicode[STIX]{x1D712}=10$
), those maps are modified as shown in figure 8(c,d). Note that the ratio
 $10$
between the small and large values of the damping coefficient is conserved in the isocontour values shown in the figures. It is possible to see that the growth rate map is barely modified. The same spatial regions are identified for the two values of the damping coefficient. As noted before for a single damping position, the growth rate variation is slightly smaller than the linear prediction. The frequency map is also barely affected. The frequency increase for
 $\unicode[STIX]{x1D712}=10$
(red regions) is also slightly smaller than predicted by the linear variation.
(a) Growth rate and (b) frequency variations induced by multiplicative perturbations of the Jacobian matrix with the damping coefficient
 $\unicode[STIX]{x1D712}=0.5$
. The damping regions are circles of radius
 $r_{s}=0.1$
centred around positions
 $(x_{s},y_{s})$
that vary with spatial steps
 $\unicode[STIX]{x0394}x_{s}=0.2$
and
 $\unicode[STIX]{x0394}y_{s}=0.2$
.

Eigenvalue variations induced by additive localized perturbations of the Jacobian matrix with damping coefficients (a,b)
 $\unicode[STIX]{x1D712}=1$
and (c,d)
 $\unicode[STIX]{x1D712}=10$
. The growth rate and frequency variations are displayed in (a,c) and (b,d), respectively. The damping regions are circles of radius
 $r_{s}=0.1$
centred around positions
 $(x_{s},y_{s})$
that vary with spatial steps
 $\unicode[STIX]{x0394}x_{s}=0.2$
and
 $\unicode[STIX]{x0394}y_{s}=0.2$
.

4 Transonic buffet mode
4.1 Configuration and numerical modelling
The second and main application of the paper is the transonic buffet phenomenon. The airfoil geometry is ONERA’s OAT15A transonic airfoil with a chord length equal to 0.23 m. The Reynolds number based on the chord length is equal to
 $Rey_{c}=3.2\times 10^{6}$
. The Mach number is fixed at
 $M_{\infty }=0.73$
in all simulations while the angle-of-attack
 $\unicode[STIX]{x1D6FC}$
ranges from
 $3$
to
 $6.5^{\circ }$
.
 $\boldsymbol{R}$
is the compressible Reynolds-averaged Navier–Stokes operator. The two-dimensional reference frame
 $(x,y)$
is relative to the airfoil. The origin of the reference frame is at the airfoil leading edge,
 $x$
is parallel and
 $y$
perpendicular to the airfoil chord axis. The vector
 $\boldsymbol{q}$
represents the set of state variables of the flow
 $$\begin{eqnarray}\boldsymbol{q}=(\unicode[STIX]{x1D746},\unicode[STIX]{x1D746}\boldsymbol{U},\unicode[STIX]{x1D746}\unicode[STIX]{x1D651},\unicode[STIX]{x1D746}\boldsymbol{E},\unicode[STIX]{x1D746}\tilde{\unicode[STIX]{x1D742}})^{\text{T}},\end{eqnarray}$$
where
 $\unicode[STIX]{x1D746}$
is the density,
 $(\unicode[STIX]{x1D70C}U,\unicode[STIX]{x1D70C}V)$
the two components of the velocity,
 $\boldsymbol{E}$
the total energy of the flow and
 $\tilde{\unicode[STIX]{x1D742}}$
the eddy viscosity. These equations are closed using the Spalart–Allmaras (SA) turbulence model (Spalart & Allmaras Reference Spalart and Allmaras1992) with the correction of Edwards & Chandra (Reference Edwards and Chandra1996). The effect of this correction is a reduction of the eddy viscosity
 $\unicode[STIX]{x1D707}_{t}$
in the near-wall regions. It has been shown by Grossi et al. (Reference Grossi, Braza and Hoarau2014) that the agreement between URANS simulations and the experimental data from Jacquin et al. (Reference Jacquin, Molton, Deck, Maury and Soulevant2009) was improved using the Edwards–Chandra correction of the SA turbulence model. The airfoil surface is modelled using an adiabatic no-slip condition.
The computational domain is a C-type structured grid. The mesh contains
 $72\,000$
cells with a refinement around the time-averaged shock location. The first mesh point in the boundary layer is below
 $y^{+}=0.9$
. In the far-stream, a non-reflective boundary condition is applied.
The governing equations are spatially discretized using a second-order accurate AUSM+(P) upwind scheme (Edwards & Liou Reference Edwards and Liou1998) except for the turbulent equation for which a first-order Roe scheme with Harten’s correction (Harten & Hyman Reference Harten and Hyman1983) is used. For the unsteady simulations, a dual-time stepping method with a non-dimensional time step
 $\unicode[STIX]{x0394}t(U_{\infty }/c)=1.08\times 10^{-3}$
is used (14 285 time steps per buffet period), achieving a second-order accuracy. The value of the time step yields a maximum Courant–Friedrichs–Lewy number of approximately
 $25$
in the attached boundary layer,
 $50$
in the wake and less than
 $1$
in most of the domain.
Numerical simulations are performed using the compressible CFD finite-volume elsA solver (Cambier, Heib & Plot Reference Cambier, Heib and Plot2013) owned by ONERA, Safran and Airbus. The 2-D Reynolds-averaged Navier–Stokes equations are solved on multiblock structured grids.
4.2 Validation of URANS against experimental results
The buffet phenomenon appears inside the range of
 $\unicode[STIX]{x1D6FC}$
between
 $3$
and
 $6.5^{\circ }$
with an angular frequency which increases with
 $\unicode[STIX]{x1D6FC}$
from
 $75$
to 81 Hz. The largest lift amplitude is found in the middle of the unstable range at
 $\unicode[STIX]{x1D6FC}=5^{\circ }$
for which the buffet frequency is equal to 79 Hz. Figure 9(b,c) shows two Mach number fields of a URANS simulation, more precisely the fields with the most downstream (figure 9
b) and the most upstream position (figure 9
c) of the shock for
 $\unicode[STIX]{x1D6FC}=5^{\circ }$
. For this angle-of-attack, buffet is well established and the shock oscillation amplitude is approximately
 $35\,\%$
of the chord.
Mach number field at
 $\unicode[STIX]{x1D6FC}=5^{\circ }$
. (a) The RANS steady-state solution, (b) most downstream and (c) upstream shock position during one buffet period of the URANS solution.

As already mentioned, the numerical results from URANS simulations are validated by comparison with an experimental database. Figure 10 shows the comparison of the numerical results with the experimental investigation of Jacquin et al. (Reference Jacquin, Molton, Deck, Maury and Soulevant2009) for two cases: before buffet onset at
 $\unicode[STIX]{x1D6FC}=3^{\circ }$
and in a buffet case at
 $\unicode[STIX]{x1D6FC}=3.5^{\circ }$
. Figure 10(a) shows a steady flow, while figure 10(b) shows the time-averaged pressure coefficient. Both cases are in good agreement on the pressure side of the airfoil, the supersonic zone and close to the TE while a difference is found for the shock position. The numerical simulations, both RANS and URANS, predict a shock position approximately
 $5\,\%$
chord downstream of the experimental one. This difference in the shock position is common and typical of RANS simulations with the SA turbulence model (Brunet Reference Brunet2003; Deck Reference Deck2005; Grossi et al.
Reference Grossi, Braza and Hoarau2014; Sartor et al.
Reference Sartor, Mettot and Sipp2015). The results are satisfying and an improvement in the simulations in comparison with Sartor et al. (Reference Sartor, Mettot and Sipp2015) is found thanks to the Edwards–Chandra correction in the SA model.
Comparison of CFD results (lines) with experimental (points) investigation of Jacquin et al. (Reference Jacquin, Molton, Deck, Maury and Soulevant2009). (a) Pressure coefficient for the steady state solution at
 $\unicode[STIX]{x1D6FC}=3^{\circ }$
, (b) time-averaged pressure coefficient for the unsteady state at
 $\unicode[STIX]{x1D6FC}=3.5^{\circ }$
.

4.3 Global stability analysis
The base flow solution may be obtained by a local time-stepping method, for which a first-order backward-Euler scheme is used. In our computations, it was possible to obtain residuals close to zero machine precision even when the base flow was unstable. Figure 9(a) shows the RANS unstable steady-state solution for
 $\unicode[STIX]{x1D6FC}=5^{\circ }$
.
The details of the numerical computation of the eigenvalues and eigenvectors of the direct and adjoint Jacobian matrices are omitted here and just the results are presented in the following. More details can be found in Beneddine et al. (Reference Beneddine, Sipp, Arnault, Dandois and Lesshafft2016). It is interesting to underline that all the state variables in equation (2.1) are perturbed, including the turbulent variable. Crouch et al. (Reference Crouch, Garbaruk, Magidov and Travin2009b
) already showed that without perturbations on the turbulent variable (frozen
 $\unicode[STIX]{x1D707}_{t}$
model, Reynolds & Hussain (Reference Reynolds and Hussain1972)), the unstable buffet mode does not appear in the spectrum. This result underlines the key role of turbulence in transonic buffet.
Results of the global stability analysis are presented below with an emphasis on the evolution of the most unstable mode as a function of the angle-of-attack
 $\unicode[STIX]{x1D6FC}$
for a fixed value of the Mach number
 $M=0.73$
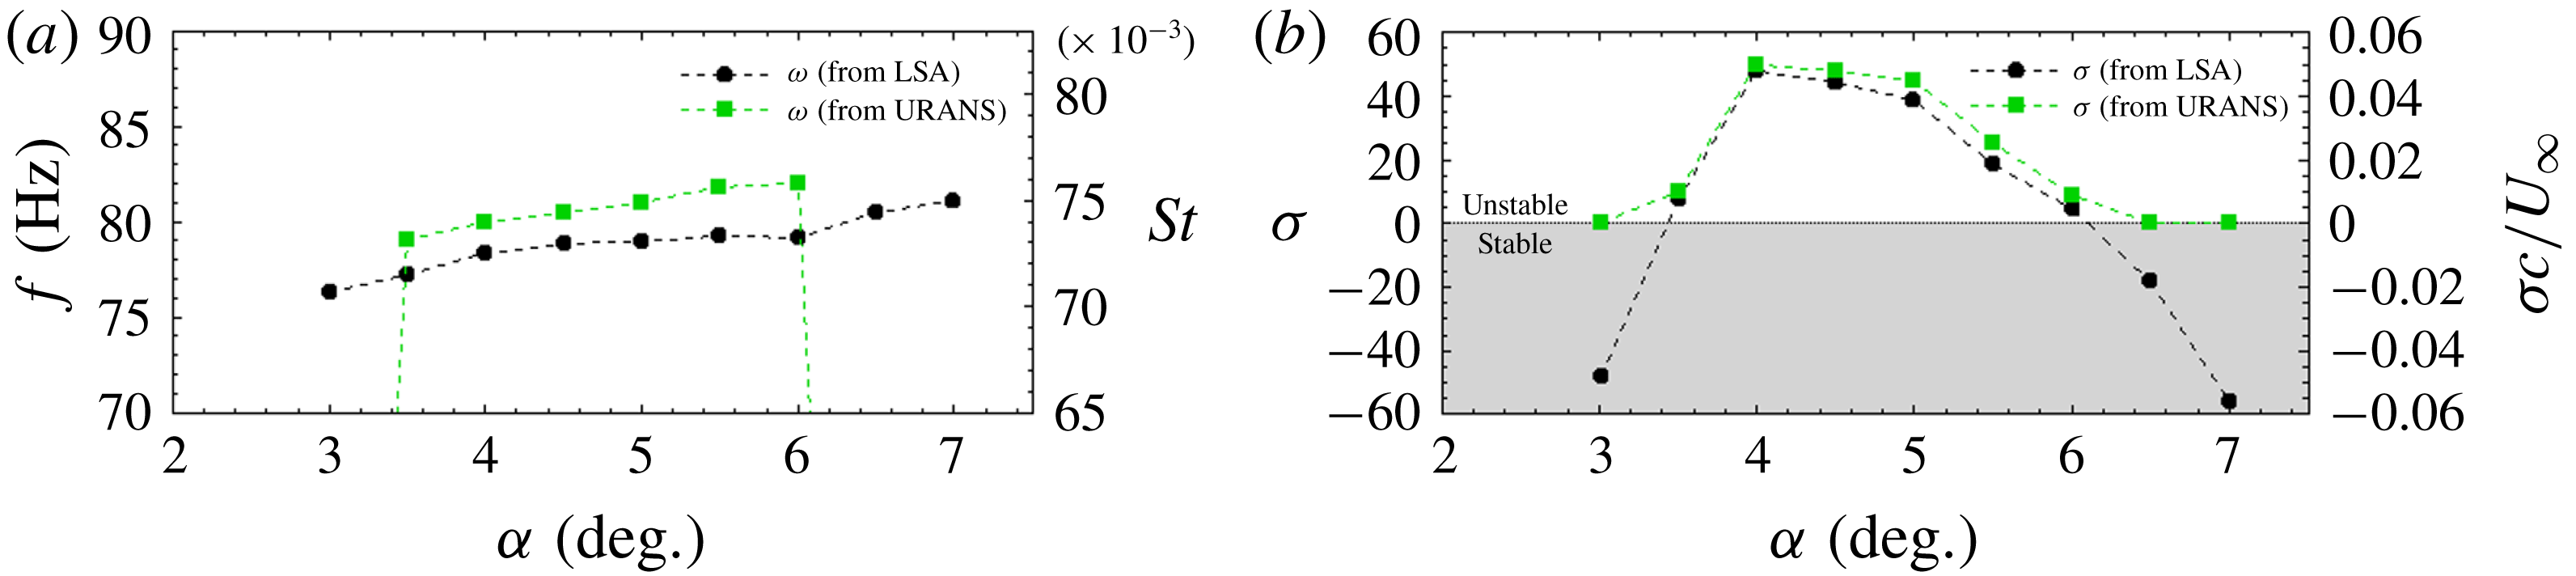
. The buffet mode is the only unstable global mode in the considered hypothesis and range of parameters. Figure 11 compares angular frequencies and growth rates from URANS simulations and linear stability analysis from buffet onset to buffet exit and shows a good agreement. The frequency increases with
 $\unicode[STIX]{x1D6FC}$
in the range of frequencies 75-82 Hz, or in the range of non-dimensional frequencies (Strouhal number
 $St=fL/U$
) 0.07–0.075, where
 $f$
is the frequency of the phenomenon and
 $U$
and
 $L$
, the reference velocity and length – here the free-stream velocity and the chord of the airfoil, respectively. Figure 11(b) highlights the angle of attacks where the buffet mode is marginally stable:
 $\unicode[STIX]{x1D6FC}=3.5^{\circ }$
and
 $\unicode[STIX]{x1D6FC}=6.0^{\circ }$
.
Interesting information comes from the structure of the buffet mode. Both direct and adjoint modes have been computed. Figure 12 shows the real and imaginary parts of both direct and adjoint modes for the
 $\unicode[STIX]{x1D70C}E$
component. Direct modes exhibit high values at the shock position and in the detached boundary layer; while adjoint modes have high values along the descending characteristic line to the shock foot and the boundary layer upstream of the shock. The present results of global stability analysis agree with Crouch et al. (Reference Crouch, Garbaruk and Magidov2007, Reference Crouch, Garbaruk, Magidov and Jacquin2009a
,Reference Crouch, Garbaruk, Magidov and Travin
b
) and Sartor et al. (Reference Sartor, Mettot and Sipp2015).
Evolution of angular frequency (a) and temporal growth rate (b) with the angle-of-attack for
 $M=0.73$
for both results of URANS simulations and stability analysis.
The
 $\unicode[STIX]{x1D70C}E$
component of the buffet mode at
 $\unicode[STIX]{x1D6FC}=5^{\circ }$
and
 $M=0.73$
. (a) Real and (b) imaginary parts of the direct buffet mode. (c) Real and (d) imaginary parts of the adjoint buffet mode. Solid and dashed lines are, respectively, the supersonic region and the boundary layer thickness of the steady state solution.

4.4 Structural sensitivity and decomposition results
The approaches presented above are now applied to the transonic buffet unstable mode. Figure 13(a,b) shows the density maps of the angular frequency and growth rate for buffet mode at
 $\unicode[STIX]{x1D6FC}=5^{\circ }$
and Mach number
 $0.73$
. For these values of
 $\unicode[STIX]{x1D6FC}$
and
 $M$
, the flow field is in a regime of well-established buffet. The supersonic zone (solid line) and the detached boundary layer (dashed line) of the steady-state solution are also shown in order to compare these density maps with the physics of the flow field. Both growth rate and angular frequency exhibit maximum values around
 $10^{7}$
at the shock foot (note that the colour maps are exponential). The zoom in figure 13 shows that the region of maximum value is inside the lambda shape of the shock foot where the boundary layer detaches. Lower values of the density maps, around
 $10^{5}$
, are found along the shock and in the boundary layer. The zone near the shock, above the detached boundary layer and in the wake, exhibits values of growth rate and frequency density of approximately
 $10^{3}$
. All the other zones have values lower than
 $10^{2}$
, i.e.
 $4$
to
 $6$
orders of magnitude lower than the values at the shock foot. In summary buffet instability appears strongly localized at the shock foot with a smaller contribution of the shock and the separated boundary layer. These results suggest the existence of several zones, even close to the airfoil (for example, the pressure side), that do not impact the physical mechanism at the origin of the transonic buffet. Further investigations are presented here for the density maps of the growth rate. Indeed positive values contribute to the unstable behaviour of the mode while negative values are stabilising. The shock foot always appears with a strongly unstable behaviour while the shock always exhibits a stable behaviour. The detached boundary layer may have either a stable or an unstable behaviour depending on the location in space and the values of the angle-of-attack.
(a) Growth rate and (b) angular frequency density maps for the buffet mode at
 $M=0.73$
and
 $\unicode[STIX]{x1D6FC}=5^{\circ }$
, with a zoom on the shock foot. Solid and dashed lines respectively depict the supersonic region and the boundary layer of the steady state solution.

Growth rate density maps for the buffet mode at
 $M=0.73$
and (a)
 $\unicode[STIX]{x1D6FC}=3^{\circ }$
, (b)
 $4.5^{\circ }$
and (c)
 $7^{\circ }$
. Solid and dashed lines are, respectively, the supersonic region and the boundary layer of the steady state solution.

Figures 14(a)–14(c) show the growth rate density maps before buffet onset at
 $\unicode[STIX]{x1D6FC}=3^{\circ }$
, in a well-established buffet regime at
 $\unicode[STIX]{x1D6FC}=4.5^{\circ }$
and after buffet exit at
 $\unicode[STIX]{x1D6FC}=7^{\circ }$
. These three maps show three different regimes of the flow but the summation of all the contributions to the growth rate for figure 14(a,c) is close. Figure 14(b) gives the opposite, strong values of total growth rate. It is now interesting to analyse locally the space distribution of the growth rate for figure 14(a,c). They both show a detached boundary layer with negative values of the density growth rate while figures 14(b) and 13(a), in a condition of well-established buffet, show an area with positive values completely inside the detached boundary layer. In a certain way if the summation of the local contribution is performed by considering only the values inside the detached boundary layer, the result is a negative value for the case in figure 14(a,c) while it is positive for figures 14(b) and 13(a). The analysis of the density maps of the growth rate at different angles of attack suggest that the detached boundary layer has an important role on the buffet instability scenario. At buffet onset the behaviour, in terms of contribution to the growth rate, of the detached boundary layer changes with the appearance of destabilising zones (which disappear at buffet exit) and it can be explained as the active key of buffet instability.
Once the local contributions to the unstable eigenvalue are defined, the other decomposition are now analysed. The multiplicative perturbation approach presented in § 2.4 is straightforwardly deduced from the localized contributions, as for the vortex shedding mode. The multiplicative localized damping maps are deduced from the local contribution by multiplying both maps by the negative scalar
 $-\unicode[STIX]{x1D712}$
. The result for the growth rate is a strong stabilising damping effect at the shock foot, destabilising on the shock and both effects in the boundary layer. The frequency, as for the vortex shedding mode, is mainly reduced by the multiplicative localized damping.
The attention is now focused on the additive localized damping approach, which could also be deduced from the localized contributions but it will be independently computed and then the link discussed. Figure 15 shows the additive localized damping maps for the buffet mode. As already seen on the vortex shedding mode, these maps are very similar to the local contribution maps, and consequently to the multiplicative localized damping maps as well. The reason could be found in the rate between real and imaginary parts of the eigenvalue, respectively, the growth rate and the frequency. Indeed, near the threshold the frequency of an unstable mode is much higher than its growth rate and the phase of the mode in polar coordinate is close to
 $\unicode[STIX]{x03C0}/2$
. This is true in the full range of instability for the buffet mode: the lowest value of the phase of the mode in polar coordinates is
 $0.94\unicode[STIX]{x03C0}/2$
(which corresponds to the highest growth rate). Consequently there is a shift of the maps’ density between the local contribution and the multiplicative localized damping in comparison with the additive localized damping.
The analysis of these maps from the linear stability results in some important contributions to the final definition of the scenario of the physical mechanism behind transonic buffet. The shock foot appears to be the core of the instability and the zone where the unsteadiness arises. The shock has a stabilising behaviour during the unstable phenomenon which can be interpreted as a stiffness (a section of the field that is sustained by, and tends to damp, the shock foot motion). Finally, the detached boundary layer changes its stabilising/destabilising/stabilising behaviour during the stable/unstable/stable phenomenon and consequently it appears to be linked with the onset and exit of buffet. In order to confirm the influence of the different zones in the buffet phenomenon resulting from stability density maps, the local selective filtering method is used in the following.
Additive localized damping approach on (a) the growth rate and on (b) the frequency for the buffet mode at
 $M=0.73$
and
 $\unicode[STIX]{x1D6FC}=5^{\circ }$
, with a zoom on the shock foot. Solid and dashed lines respectively depict the supersonic region and the boundary layer of the steady state solution.

Zones of the computational domain where SFD is locally activated. Solid and dashed lines are respectively the supersonic zone and the separated boundary layer of the steady state solution. Black points are the probe positions, (a) zone 1, (b) zone 2, (c) zone 3, (d) zone 4, (e) zone
 $4^{\prime }$
, (f) zone 5, (g) zone 6, (h) zone 7.

4.5 Selective frequency damping
Based on the results obtained in the previous section, eight flow regions are investigated in applying the damping term. They are depicted in figure 16: the suction side of the airfoil (zone 1), the shock foot excursion and beginning of the separated boundary layer (zone 2), the suction side TE area and wake (zone 3), from the superior half of the supersonic zone to the end of the domain (zone 4) above the supersonic zone (zone
 $4^{\prime }$
), the airfoil wake (zone
 $5$
), the path between the TE and the shock above the boundary layer (zone 6) and finally the pressure side of the airfoil (zone
 $7$
). Lift fluctuation amplitudes are used as global criteria for the persistence of the buffet instability. Steady state is defined by zero machine levels of residuals while probes are used locally to verify that unsteady signals are well damped. When lift continues to oscillate and the standard deviations of the signals in the filtered zone tend to zero it is possible to state that the related zone is not necessary for the buffet instability to develop, consequently there is not a critical value of
 $\unicode[STIX]{x1D712}$
. To choose the SFD parameters, Åkervik et al. (Reference Åkervik, Brandt, Henningson, Hœpffner, Marxen and Schlatter2006) state that large
 $\unicode[STIX]{x1D712}$
and
 $\unicode[STIX]{x1D6E5}$
would make the evolution of the system very slow but the SFD would in every case converge to a steady-state. Furthermore, the SFD parameter values are linked to the flow dynamics. The temporal cutoff frequency
 $1/\unicode[STIX]{x1D6E5}$
should be lower than the frequency of the unstable dynamics by at least a factor two. The control parameter
 $\unicode[STIX]{x1D712}$
usually has a value close or higher than the growth rate of the unstable flow dynamics but can take higher values in order to increase the convergence rate of the simulation towards the steady-state. In most cases the unstable dynamics is unknown a priori and several studies proposed different techniques to choose suitable parameters (Jordi, Cotter & Sherwin Reference Jordi, Cotter and Sherwin2015; Cunha, Passaggia & Lazareff Reference Cunha, Passaggia and Lazareff2015). In the present work the unstable dynamics is well known and the analysis procedure is the following: eight URANS simulations are performed with SFD for each filtered zone in figure 16, the value of the cutoff frequency is fixed at
 $13~\text{rad}\cdot \text{s}^{-1}$
, which ensures an efficient convergence for the SFD algorithm and
 $\unicode[STIX]{x1D712}_{c}\approx \unicode[STIX]{x1D70E}$
when
 $\unicode[STIX]{x1D644}_{S}=\unicode[STIX]{x1D644}$
. The dependence of
 $\unicode[STIX]{x1D712}_{c}$
with respect to the choice of
 $\unicode[STIX]{x1D6E5}$
has also been investigated but is not presented here since only small effects on
 $\unicode[STIX]{x1D712}_{c}$
have been observed.
As for the implementation of the modified SFD algorithm, the ‘encapsulated’ formulation, described in Jordi, Cotter & Sherwin (Reference Jordi, Cotter and Sherwin2014), is used. It is based on the splitting of the system (2.19) to cope with the industrial CFD solver elsA.
4.5.1 Results
The results from the application of SFD in the different zones are presented in this section. The numerical parameters of the URANS simulations have been described in § 2.1. The configuration analysed is the same as in § 4.4:
 $(Re,M,\unicode[STIX]{x1D6FC})=(3.2\times 10^{6},0.73,5^{\circ })$
. As already said, the effect of a particular zone on the global instability is assessed through two criteria: a global one based on the lift oscillation amplitude and a local one based on the standard deviation of signals from probes which quantifies how much unsteady signals are damped in the zones where SFD is locally activated.
Once the local SFD is activated, there are two types of results. In the first case a steady-state is reached, residuals decrease towards zero machine values. In the second case a steady-state is not reached. It is then possible to force the convergence towards the steady-state solution by increasing the control parameter
 $\unicode[STIX]{x1D712}$
, but the achievement of the converged solution depends on the zone where the SFD is activated. Figure 17(a) shows the lift oscillation amplitude for increasing values of the control parameter
 $\unicode[STIX]{x1D712}$
, for the application of SFD in the entire computational domain and three cases of local application (zones 2, 3 and 4). When
 $\unicode[STIX]{x1D712}=0$
, the lift oscillation amplitude corresponds to the URANS one without SFD. For increasing values of
 $\unicode[STIX]{x1D712}$
, the lift oscillation amplitude decreases towards zero, with a slope depending on the zone where SFD is activated. When
 $\unicode[STIX]{x0394}C_{l}=0$
(corresponding to
 $\unicode[STIX]{x1D712}_{c}$
) the residuals’ values tend to zero machine levels while intermediate points, in the range
 $0<\unicode[STIX]{x1D712}<\unicode[STIX]{x1D712}_{c}$
, correspond to non-physical solutions of the URANS dynamical system coupled with SFD that did not reach convergence. The application of the SFD on the full domain results in a value of
 $\unicode[STIX]{x1D712}_{c}=55$
, while
 $\unicode[STIX]{x1D712}_{c}$
is always higher when SFD is applied on a limited zone of the domain. Figure 17(a) shows the regions in which the application of a local SFD allows it to reach a steady-state, for a certain value of
 $\unicode[STIX]{x1D712}$
. Table 1 shows the
 $\unicode[STIX]{x1D712}_{c}$
values for the configurations in figure 16. Here ‘N/A’ is used when a value of
 $\unicode[STIX]{x1D712}_{c}$
is not found, i.e. when SFD damps the entire unsteady signals of the zone where it is activated but the lift still oscillates. A steady-state is reached by application of local SFD only for three zones: shock (zone 4), suction side TE area and wake (zone 3) and shock foot with the beginning of the boundary layer (zone 2) which is the most efficient area to damp. These zones correspond exactly to the higher values of the maps presented in figures 13 and 15. It is interesting to note the low value of
 $\unicode[STIX]{x1D712}_{c}$
for zone 2 even though the application area of the SFD is very small and that
 $\unicode[STIX]{x1D712}_{c}$
for zone 1 is very close to the value found when SFD is applied on the entire computational domain.
(a) Amplitude of lift coefficient oscillation as a function of the control parameter
 $\unicode[STIX]{x1D712}$
for SFD activated on the entire domain and three local applications, (b) the standard deviation of the streamwise momentum
 $\unicode[STIX]{x1D70C}u$
as function of the control parameter
 $\unicode[STIX]{x1D712}$
for the SFD activated on zone 4; for the probes’ location see figure 16(d).

Minimal value of the control parameter
 $\unicode[STIX]{x1D712}$
to reach a steady state for the different zones where SFD is activated.

The local criterion based on the standard deviation,
 $sd$
, for the streamwise momentum,
 $\unicode[STIX]{x1D70C}u$
, is presented for zone 4 in figure 17(b). The same slope is found for all other state variables. For zones 1, 2 and 3, the standard deviation of the state variables decreases constantly while increasing
 $\unicode[STIX]{x1D712}$
, until
 $\unicode[STIX]{x1D712}_{c}$
(figure omitted). Four different probes are used in zone 4, two above the supersonic zone and two inside the area swept by the shock. Figure 16(d) shows the location of all the probes. Figure 17(b) shows that the standard deviation of
 $\unicode[STIX]{x1D70C}u$
drastically decreases when SFD is activated for the probes outside the supersonic zone (probes C and D) while remaining on a plateau and then strongly decreasing to zero for the probes inside the supersonic zone (probes A and B). The results in figure 17(b) suggest that the flow field converges towards a steady state as soon as SFD is activated, except for the shock which continues to oscillate. Damping the perturbations around the shock does not suppress the oscillation. Consequently, the perturbations around the supersonic zone are considered more a consequence than a cause of the buffet. Now, by considering the low value of
 $\unicode[STIX]{x1D712}_{c}$
for the shock foot, it is possible to give an explanation of the behaviour of the shock in the global instability. It is in a certain way entrained by the core of the instability, the shock foot, but at the same time it has a role in the buffet scenario (it is indeed possible to suppress the instability with a high value of
 $\unicode[STIX]{x1D712}_{c}$
). To conclude, the shock is a slave zone but behaves as a stiffness on the instability phenomenon. If some part of the shock is prevented from moving, the rest of the shock, even if it is free to move, has a harder time doing it.
The analysis continues with zones where it is not possible to suppress buffet instability by local SFD. This is the case for zones
 $4^{\prime }$
, 5, 6 and 7. Figure 18(a) shows the global criterion based on the lift oscillation amplitude as a function of the control parameter
 $\unicode[STIX]{x1D712}$
for zone 7. For
 $\unicode[STIX]{x1D712}=6400$
the shock still oscillates even if the lift coefficient amplitude is reduced by approximately
 $25\,\%$
. At the same time, figure 18(b) shows the local criterion based on the standard deviation for the streamwise momentum,
 $\unicode[STIX]{x1D70C}u$
, at the point depicted in figure 16(h); it is decreased by
 $98\,\%$
for the same value of
 $\unicode[STIX]{x1D712}$
. This indicates that the SFD technique effectively suppresses fluctuations in the region where the filter is applied but the buffet instability is still present. The same conclusion was found in Memmolo et al. (Reference Memmolo, Bernardini and Pirozzoli2018) by freezing the URANS solution on the same zone. To freeze a solution is equivalent to using SFD with a control parameter
 $\unicode[STIX]{x1D712}=\infty$
. Results for the other zones are not presented because they are very similar to the ones of zone 7. For example zone 6 at
 $\unicode[STIX]{x1D712}=4000$
shows a reduction of
 $22\,\%$
in lift coefficient amplitude with a reduction of
 $98.5\,\%$
in the standard deviation of
 $\unicode[STIX]{x1D70C}u$
.
Amplitude of (a) the lift coefficient oscillation and (b) standard deviation of the state variable
 $\unicode[STIX]{x1D70C}u$
, as function of the control parameter
 $\unicode[STIX]{x1D712}$
for the SFD activated on zone 7; for the probes’ location see figure 16(h).

5 Discussion on the physical mechanism behind transonic buffet
The physical mechanisms presented in the introduction are now discussed in the light of the results from the present work and a model for the explanation of the global buffet instability is proposed. The topology of the active and passive zones is discussed looking at the different models of transonic buffet proposed in the literature.
The numerical results have shown that some zones close to the airfoil are not directly connected to the buffet instability: the pressure side of the airfoil (figure 16 h), the region above the supersonic zone (figure 16 e), the airfoil wake (figure 16 f) and the path between the TE and the shock above the boundary layer (figure 16 g). The unsteady signals found by Jacquin et al. (Reference Jacquin, Molton, Deck, Maury and Soulevant2009) on the lower surface of the airfoil are not at the origin of the buffet instability but can help to strengthen it. Some self-sustained mechanisms of transonic buffet are based on perturbations circumventing the supersonic zone, such as Crouch’s observation (figure 2) and the mechanism highly localized around the shock (Memmolo et al. Reference Memmolo, Bernardini and Pirozzoli2018) suggesting acoustic rays (Lee et al. Reference Lee, Murty and Jiang1994; Spee Reference Spee1966). Figure 17(b) suggests that the perturbations around the supersonic zone are more a consequence than a cause of the buffet phenomenon. Conclusions suggest that these models and observations do not focus on the origin of the buffet but rather on additional mechanisms that can intensify it. The last zone to look at is probably the most important one: the path between the TE and the shock above the boundary layer (figure 16 g). It is indeed the key zone involved in several models to close the self-sustained loop with backward acoustic waves impacting the shock. The present results show that the unsteady signals in this zone are not necessary for buffet instability. The unsteady signals in Lee’s model (Lee Reference Lee1990), in Hartmann’s model (Hartmann et al. Reference Hartmann, Feldhusen and Schröder2013) and in the model based on acoustic rays originating from TE and passing through zone 6 (Lee et al. Reference Lee, Murty and Jiang1994; Spee Reference Spee1966) contribute weakly to the buffet mechanism. However, the emission of acoustic waves resulting from the diffraction at the TE can be superimposed on the buffet phenomenon. Indeed, the flow is also the seat of convective instabilities (developing spatially but globally stable) in the shear layers from the separated zone and along the wake. These disturbances are unstable over a wide range of frequencies and can diffract with the trailing edge, generating acoustic waves that can interact with the shock wave. This is the reason why unsteady simulations (Deck Reference Deck2005) observe such acoustic emissions although they are not directly involved in the generation of the buffet phenomenon.
In view of our results, the identification of the shock foot as the origin of the unsteadiness seems confirmed. However, two other areas play a vital role in the development of buffet instability: the separated zone and the shock. These are necessary in the transmission of the disturbance but not in the generation of the phenomenon. This transmission mechanism is clearly observed in Deck (Reference Deck2005) where the presence of traveling waves is detected in the separated boundary layer. Despite this, the physical mechanism responsible for a self-sustained mode remains to be determined. A comparison can be done with other cases of shock-wave/boundary-layer interaction (Sartor et al. Reference Sartor, Mettot and Sipp2015; Guiho, Alizard & Robinet Reference Guiho, Alizard and Robinet2016). The latter do not have self-sustaining dynamics (globally stable) but have a comparable frequency selectivity when the flow is forced. These results show that the existence of a massive separation and/or a trailing edge can change the nature of the mode allowing the emergence of a self-sustained dynamic although the origin of the phenomenon is located at the shock foot in all these examples of interaction.
6 Conclusions
Transonic buffet is a phenomenon widely studied during the last 70 years but which is still not yet fully understood. Several studies have contributed to the understanding of this complex phenomenon. Experimental data, powerful modern CFD tools and techniques based on stability analysis have produced a lot of information on the physical mechanism behind transonic buffet. Today there are many different hypotheses and physical models to explain buffet. The purpose of the present work was to improve the understanding of the phenomenon by the definition of the regions in the flow field necessary for the persistence of the buffet instability. For this, a technique which aims at quantifying the local contributions in space to the stability quantities has been used. The results have been compared with URANS simulations locally filtered with an SFD technique, showing a good consistency of results. Conclusions have been compared with the literature trying to discuss and update the physical mechanisms proposed until now. It is possible to summarise the conclusions as follows:
(i) Zones which are not strictly necessary for the instability (not at the origin, at best a consequence): the zone on the lower side of the airfoil, on the upper side above the shock, downstream of the boundary layer and the path between the TE and the shock outside the boundary layer.
(ii) Zones which are absolutely necessary for the instability: the shock and the separated boundary-layer. More precisely, the shock wave appears as a slave zone with a stiffness effect while the separated boundary-layer has a more active role in the buffet mechanism scenario.
(iii) The core of the instability: the shock foot.
Finally, in light of these results a possible explanation of transonic buffet has been proposed: a modification of the self-sustained closed loop model from Lee with a feedback path inside the separated boundary layer.
The present work gives a contribution to the understanding of the mechanism behind the transonic buffet and opens at the same time the path for several analyses. First of all, further investigations are necessary to confirm the proposed mechanism. Experiments to better identify and quantify the down-stream and up-stream perturbations inside the boundary layer are suggested.
Appendix A. Simplification of the expression for
$\unicode[STIX]{x1D706}_{k}$

The column decomposition of the Jacobian matrix (2.28) is introduced into the
 $\unicode[STIX]{x1D651}$
-weighted adjoint eigenvalue problem (2.6)
 $$\begin{eqnarray}\displaystyle \unicode[STIX]{x1D706}^{\ast }\tilde{\boldsymbol{q}}=\unicode[STIX]{x1D651}^{-1}\left(\mathop{\sum }_{k=1}^{N_{c}}\unicode[STIX]{x1D63E}_{\boldsymbol{k}}\right)^{\ast }\unicode[STIX]{x1D651}\tilde{\boldsymbol{q}}=\mathop{\sum }_{k=1}^{N_{c}}(\unicode[STIX]{x1D651}\unicode[STIX]{x1D63E}_{\boldsymbol{ k}}\unicode[STIX]{x1D651}^{-1})^{\ast }\tilde{\boldsymbol{q}}, & & \displaystyle\end{eqnarray}$$
where the matrix-vector product
 $(\unicode[STIX]{x1D651}\unicode[STIX]{x1D63E}_{\boldsymbol{k}}\unicode[STIX]{x1D651}^{-1})^{\ast }\tilde{\boldsymbol{q}}$
is equal to
 $$\begin{eqnarray}\displaystyle (\unicode[STIX]{x1D651}\unicode[STIX]{x1D63E}_{\boldsymbol{k}}\unicode[STIX]{x1D651}^{-1})^{\ast }\tilde{\boldsymbol{q}}=\left[0,\ldots ,\mathop{\sum }_{l=1}^{N_{c}}\left[V_{l}\frac{\unicode[STIX]{x2202}\boldsymbol{R}_{l}}{\unicode[STIX]{x2202}\boldsymbol{q}_{k}}V_{k}^{-1}\right]^{\ast }\tilde{\boldsymbol{q}}_{l},0\ldots \right]^{\text{T}}. & & \displaystyle\end{eqnarray}$$
This is a vector of zeros except for the
 $k$
th component. Now, by identification of the left- and right-hand sides in the equality (A 1), it gives that
 $$\begin{eqnarray}\displaystyle (\unicode[STIX]{x1D651}\unicode[STIX]{x1D63E}_{\boldsymbol{k}}\unicode[STIX]{x1D651}^{-1})^{\ast }\tilde{\boldsymbol{q}}=\unicode[STIX]{x1D706}^{\ast }[0,\ldots ,\tilde{\boldsymbol{q}}_{k},0\ldots ]^{\text{T}}. & & \displaystyle\end{eqnarray}$$
Reformulating (2.33) as
 $\unicode[STIX]{x1D706}_{k}=((\unicode[STIX]{x1D651}\unicode[STIX]{x1D63E}_{\boldsymbol{k}}\unicode[STIX]{x1D651}^{-1})^{\ast }\tilde{\boldsymbol{q}})^{\ast }\,\unicode[STIX]{x1D651}\hat{\boldsymbol{q}}$
and inserting the above expression yields a simplified expression for
 $\unicode[STIX]{x1D706}_{k}$
in the form
 $$\begin{eqnarray}\displaystyle \unicode[STIX]{x1D706}_{k}=\unicode[STIX]{x1D706}V_{k}(\tilde{\boldsymbol{q}}_{k}^{\ast }\hat{\boldsymbol{q}}_{k}). & & \displaystyle\end{eqnarray}$$
Appendix B. Row-decomposition of the Jacobian matrix
The adjoint eigenvalue problem (2.6) is rewritten with a decomposition of the Jacobian matrix into rows
 $$\begin{eqnarray}\unicode[STIX]{x1D706}^{\ast }\tilde{\boldsymbol{q}}=\unicode[STIX]{x1D651}^{-1}\left(\mathop{\sum }_{k=1}^{N_{c}}\boldsymbol{L}_{k}\right)^{\ast }\unicode[STIX]{x1D651}\tilde{\boldsymbol{q}}=\mathop{\sum }_{k=1}^{N_{c}}(\unicode[STIX]{x1D651}\boldsymbol{L}_{k}\unicode[STIX]{x1D651}^{-1})^{\ast }\tilde{\boldsymbol{q}},\end{eqnarray}$$
where
 $\boldsymbol{L}_{k}$
denotes the row-matrix of the Jacobian at the
 $k$
th cell
 $$\begin{eqnarray}\boldsymbol{L}_{k}=\left[\begin{array}{@{}ccccccc@{}}0 & \cdots \, & \cdots \, & 0 & \cdots \, & \cdots \, & 0\\ \displaystyle \vdots & \cdots \, & \cdots \, & \vdots & \cdots \, & \cdots \, & \vdots \\ 0 & \cdots \, & \cdots \, & 0 & \cdots \, & \cdots \, & 0\\ \displaystyle \frac{\unicode[STIX]{x2202}\boldsymbol{R}_{k}}{\unicode[STIX]{x2202}\boldsymbol{q}_{1}} & \cdots \, & \cdots \, & \displaystyle \frac{\unicode[STIX]{x2202}\boldsymbol{R}_{k}}{\unicode[STIX]{x2202}\boldsymbol{q}_{l}} & \cdots \, & \cdots \, & \displaystyle \frac{\unicode[STIX]{x2202}\boldsymbol{R}_{k}}{\unicode[STIX]{x2202}\boldsymbol{q}_{N_{c}}}\\ \displaystyle 0 & \cdots \, & \cdots \, & 0 & \cdots \, & \cdots \, & 0\\ \vdots & \cdots \, & \cdots \, & \vdots & \cdots \, & \cdots \, & \vdots \\ \displaystyle 0 & \cdots \, & \cdots \, & 0 & \cdots \, & \cdots \, & 0\end{array}\right].\end{eqnarray}$$
The matrix-vector product
 $(\unicode[STIX]{x1D651}\boldsymbol{L}_{k}\unicode[STIX]{x1D651}^{-1})^{\ast }\tilde{\boldsymbol{q}}$
is now expanded onto the basis of non-orthogonal adjoint eigenmodes as
 $$\begin{eqnarray}(\unicode[STIX]{x1D651}\boldsymbol{L}_{k}\unicode[STIX]{x1D651}^{-1})^{\ast }\tilde{\boldsymbol{q}}=\unicode[STIX]{x1D711}_{k}^{\ast }\tilde{\boldsymbol{q}}+\tilde{\boldsymbol{r}}_{k},\end{eqnarray}$$
where
 $\unicode[STIX]{x1D711}_{k}^{\ast }$
is the coefficient along the unstable adjoint eigenmode
 $\tilde{\boldsymbol{q}}$
and
 $\tilde{\boldsymbol{r}}_{k}$
the residual vector. Multiplying this equation on the left by
 $\hat{\boldsymbol{q}}^{\ast }\unicode[STIX]{x1D651}$
and taking the conjugate, it gives
 $$\begin{eqnarray}\unicode[STIX]{x1D711}_{k}=\tilde{\boldsymbol{q}}^{\ast }\unicode[STIX]{x1D651}\boldsymbol{L}_{k}\hat{\boldsymbol{q}}.\end{eqnarray}$$
Summing all contributions
 $$\begin{eqnarray}\mathop{\sum }_{k=1}^{N_{c}}\unicode[STIX]{x1D711}_{k}=\mathop{\sum }_{k=1}^{N_{c}}\tilde{\boldsymbol{q}}^{\ast }\unicode[STIX]{x1D651}\boldsymbol{L}_{k}\hat{\boldsymbol{q}}=\tilde{\boldsymbol{q}}^{\ast }\unicode[STIX]{x1D651}\left(\mathop{\sum }_{k=1}^{N_{c}}\boldsymbol{L}_{k}\right)\hat{\boldsymbol{q}}=\tilde{\boldsymbol{q}}^{\ast }\unicode[STIX]{x1D651}\unicode[STIX]{x1D645}\hat{\boldsymbol{q}}=\unicode[STIX]{x1D706}.\end{eqnarray}$$
Now this equation is simplified to establish a link between
 $\unicode[STIX]{x1D711}_{k}$
and
 $\unicode[STIX]{x1D706}_{k}$
.
The direct eigenmode problem is considered
 $$\begin{eqnarray}\displaystyle \unicode[STIX]{x1D706}\hat{\boldsymbol{q}}=\left(\mathop{\sum }_{k=1}^{N_{c}}\boldsymbol{L}_{k}\right)\hat{\boldsymbol{q}}=\mathop{\sum }_{k=1}^{N_{c}}(\boldsymbol{L}_{k}\hat{\boldsymbol{q}}), & & \displaystyle\end{eqnarray}$$
where the matrix-vector product
 $\boldsymbol{L}_{k}\hat{\boldsymbol{q}}$
is equal to
 $$\begin{eqnarray}\displaystyle \boldsymbol{L}_{k}\hat{\boldsymbol{q}}=\left[0,\ldots ,\mathop{\sum }_{l=1}^{N_{c}}\left[\frac{\unicode[STIX]{x2202}\boldsymbol{R}_{k}}{\unicode[STIX]{x2202}\boldsymbol{q}_{l}}\right]\hat{\boldsymbol{q}}_{l},0\ldots \right]^{\text{T}}. & & \displaystyle\end{eqnarray}$$
Now, by identification of the left- and right-hand sides in the equality (B 6), it gives that
 $$\begin{eqnarray}\displaystyle \boldsymbol{L}_{k}\hat{\boldsymbol{q}}=\unicode[STIX]{x1D706}[0,\ldots ,\hat{\boldsymbol{q}}_{k},0,\ldots ]^{\text{T}}. & & \displaystyle\end{eqnarray}$$
Inserting this expression in (B 4) recovers (2.35)
 $$\begin{eqnarray}\displaystyle \unicode[STIX]{x1D711}_{k}=\unicode[STIX]{x1D706}V_{k}(\tilde{\boldsymbol{q}}_{k}^{\ast }\hat{\boldsymbol{q}}_{k}). & & \displaystyle\end{eqnarray}$$
Finally, row and column decompositions result in the same values of local coefficients of the eigenvalue
 $$\begin{eqnarray}\displaystyle \unicode[STIX]{x1D706}_{k}=\tilde{\boldsymbol{q}}^{\ast }\,\unicode[STIX]{x1D651}\unicode[STIX]{x1D63E}_{k}\,\hat{\boldsymbol{q}}=\tilde{\boldsymbol{q}}^{\ast }\unicode[STIX]{x1D651}\boldsymbol{L}_{k}\hat{\boldsymbol{q}}=\unicode[STIX]{x1D706}V_{k}(\tilde{\boldsymbol{q}}_{k}^{\ast }\hat{\boldsymbol{q}}_{k}). & & \displaystyle\end{eqnarray}$$



