I. INTRODUCTION
Reticulated porous ceramics are usually evaluated concerning their structure (e.g., pore size, strut diameter, and porosity) and their mechanical behavior. The measurement of the compression strength or so-called crushing strength is a widely used method to evaluate the mechanical properties. The measurement of the crushing strength is a relatively simple and fast test and so allows a statistical evaluation of a high number of samples. The compression load is a frequently occurring load for the application of reticulated porous ceramics. By now, there is no DIN standard for the determination of the crushing strength of reticulated porous ceramics. There are standards for measuring the cold compression strength of shaped insulating refractory products (DIN EN ISO 8895)1 and dense shaped refractory products (DIN EN 993-5).2 The former standard uses samples with a size of 114 × 114 × 76 mm or 114 × 114 × 64 mm. The DIN EN 993-5 demands cylinders with a diameter of 50 mm and a height of 50 mm or cubes with an edge length of 50 mm2. A review of the relevant literature reveals that the tested sample geometries have a broad scope.Reference Brezny and Green3–Reference Acchar, Souza, Ramalho and Torquato11 The producers of filters e.g., use the measurement of the crushing strength as an outgoing inspection criterion and so carry out the test at the produced specimen. The first aspect is the sample size. The second aspect is the geometry of the loading plates. The loading plates demanded in the two above mentioned standards are larger than the samples. On the contrary, it can be found that, e.g., producers of filters or institutes for scientific research use loading plates with a smaller area than the sample area (intender measurement). In the BDG guidelines for ceramic filters with foam structure for iron and steel casting,12 such an indenter measurement is described. In many papers the loading plates are often not specified. The rate of the applied load is mostly given and varies between 0.5 mm/min,Reference Meille, Lombardi, Chevalier and Montanaro10 1 mm/min,Reference Acchar, Souza, Ramalho and Torquato11 2.5 mm/min,Reference Orenstein and Green13 and 20 mm/min.12 Another point which has been taken by some studies is the usage of a compliant pad between the loading plates and the sample to obtain an improved uniformly loading.Reference Dam, Brezny and Green6,Reference Gibson and Ashby14
The present study aims to give an overview over the influence of the parameters of the crushing strength measurement such as the sample size, the size of the loading plates and the rate of the applied load. Furthermore, the influence of the cell size and inhomogeneity of the porosity in the sample should be determined.
II. MATERIALS AND METHODS
A. Tested parameters
For the evaluation of the influence of the different parameters for the measurement of the crushing strength, reticulated porous ceramics of three different producers of ceramic foam filters for the metal filtration were used. The industrially produced filters were chosen to have samples as homogenous as possible. Besides, reticulated porous ceramics made of aluminum dioxide were produced in the laboratory to vary the homogeneity of the porosity, respectively the strut diameter of the samples.
The following samples were tested:
- Silicon carbide—SiC (producer 1, Germany, 10 ppi, 50 × 50 × 22 mm and 75 × 75 × 22 mm)
- Fused silica—LD (producer 2, Germany, 10 ppi, 50 × 50 × 22 mm)
- Zirconium dioxide—ZrO2 (producer 2, Germany, 10 ppi, 50 × 50 × 22 mm)
- Aluminum dioxide—Al2O3 (producer 3, 10 ppi, 20 ppi and 30 ppi, 50 × 50 × 22 mm)
- Aluminum dioxide—Al2O3 (own laboratory, 10 ppi, 50 × 50 × 22 mm, homogeneous and inhomogeneous)
The crushing strength was tested with a Tiratest 2420 (TIRA GmbH, Schalkau, Germany). The machine consists mainly of two loading plates, a load cell (with 20 kN), a load frame, a lead screw, and devices for the recording of the data (force and displacement).
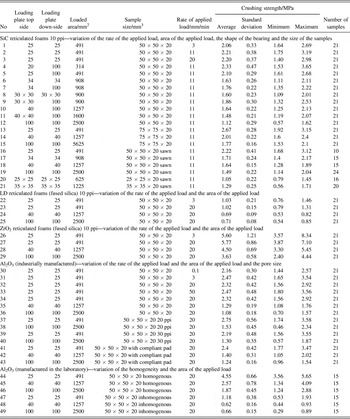
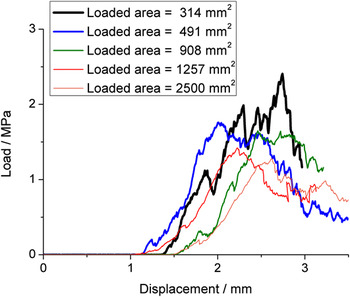
For the measurement, the filter was placed between the loading plates. After starting the measurement, the down-side loading plate moves upwards with the chosen displacement rate (see Table I). The measurement is aborted when a force loss of 70 % of the maximum force is reached. Some example load-displacement curves are plotted in Fig. 1. The crushing strength is calculated from the maximum force F max and the loaded area A, whereby the maximum force stands for the appearance of the global failure.
 $${\rm{\sigma }}_{fc} = {{F_{{\rm{max}}} } \over A}\quad,$$
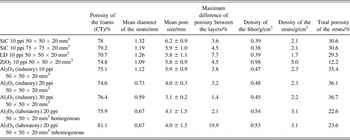
Overview of the used samples and parameters and the measured results.

Load displacement curves of SiC samples 50 × 50 × 20 mm, 10 ppi with varied areas of the applied load.

One of the key issues of the paper is to determine the influence of the size of the loading plates. For the variation of the loading plates different mostly cylindrical adapters with different sizes made of polished and tempered steel were used. For testing, they were stuck to the original loading plate. Following factors of influence were varied: the rate of loading, pore size, and the usage of a compliant pad. For the variation of the sample size, the SiC filters 75 × 75 × 20 mm were cut with a diamond saw. An overview of the used samples, the measurement parameters, and the number of tested samples can be found in Table I. To determine the influence of inhomogeneity of the ceramic foam, samples (Al2O3) were produced according to the experiments described in ref. Reference Voigt, Jäckel, Aneziris and Hubálková15. For the comparison of homogeneous and inhomogeneous samples, the centrifugation and the spraying route was used. The experiments described by Voigt et al.Reference Voigt, Jäckel, Aneziris and Hubálková15 showed that if the spraying technique with a spraying distance of 27 cm is used for the preparation of 20 ppi ceramic foams, the homogeneity of the whole foam is insufficient. The difference of porosity between the middle and the outer parts of the foam is up to 19%. The reason is the incomplete transport of the slip into the middle of the foam. The use of the centrifugation technique provides a better homogeneity of the porosity. This process starts with dipping the samples into the slurry. The excess slurry is then removed with a centrifuge. So a coating of the complete foam is nearly possible. The difference of porosity between the middle and the outer parts of the foam is only 2%.
For the statistical evaluation, the average, the standard deviation, minimum and maximum of the measured values were calculated. To determine whether the differences between the variants are significant an analysis of variance with one parameter having several levels (one-way ANOVA) was carried out. The null hypothesis H0 was that the changed parameters, for example, the area of the applied load, the rate of the applied load or the samples size have no effect on the crushing strength. The alternative hypothesis H1 implied a significant difference. A confidence level of 95% was used. Hence, H0 would be rejected if the P-value was less than 0.05.Reference Montgomery, Runger and Faris Hubele16 The analysis of variance was done by the aid of the software Minitab 14 (Minitab Inc., State College, PA).
B. Characterization of the samples
Before the compression test the dimensions and weight of every sample were measured. Based on the dimensions (length a, width b, and height h) and the weight m, the foam density ρfoam was calculated.
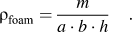 $${\rm{\rho }}_{{\rm{foam}}} = {m \over {a \cdot b \cdot h}}\quad.$$
The strut density ρS was measured on crushed foams with a mercury intrusion porosimeter Pascal 140 und 440 (Porotec, Hofheim, Germany). The ratio of the foam density to the strut density specifies the relative density ρrel.
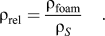 $${\rm{\rho }}_{{\rm{rel}}} = {{{\rm{\rho }}_{{\rm{foam}}} } \over {{\rm{\rho }}_S }}\quad.$$
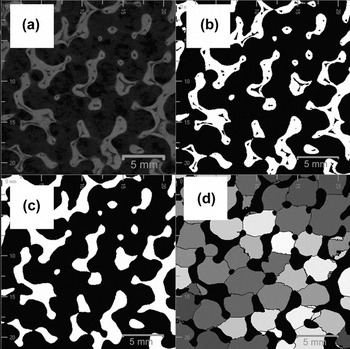
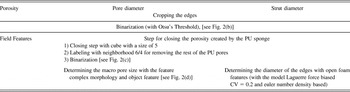
For the characterization of the structure of the filters one sample of each kind of ceramic foam was scanned with a micro focus x-ray computer tomograph CT-ALPHA (ProCon x-ray, Garbsen, Germany) equipped with a 160 kV x-ray tube and a Hamamatsu detector (79425K-05) with 2400 × 2400 active pixels. The reconstructed CT data were analyzed with the software modular algorithms for volume images (MAVI, Fraunhofer, Germany). The data processing started with a cropping step, see Fig. 2 and Table II. With the help of the following image processing steps which is e.g., a binarization step and a step for the elimination of the pores caused by the debinding of the polyurethane, the strut thickness, the macro pore size, and the porosity of the ceramic foams were analyzed. A further not to be neglected value of ceramic foams is the homogeneity, which gives a hint if the same amount of ceramic material is in the outer parts and the inner part of the ceramic foam. One possibility for the determination of the homogeneity is to analyze the porosity in dependence of the position (filter thickness coordinate) in the ceramic foam. So the ceramic foams were virtually cut into six layers (along the height of the sample) and the porosity of each layer was determined. For every variant, the maximum difference of the porosity between the six layers was calculated.
Image processing steps using MAVI (a) cropped part of the filter, (b) binarization with Otsu threshold, (c) filter structure with closed voids, and (d) applying the feature “complex morphology.”

Processing steps in MAVI for determining the porosity, the macro pore size and the strut diameter.

III. RESULTS
A. Characterization of the samples
Important features of cellular structures considered in this study are given in Table III, sharped edged voids inside the nodes caused by the debinding of the polyurethane were not directly taken into consideration. Although these triangular voids within the struts have an evident influence on the crushing strength, there are initial points of cracks.Reference Oliveria, Dias, Vaz and Fernandes5
Results of the structural characterization of the filters.

B. Influence of the sample size
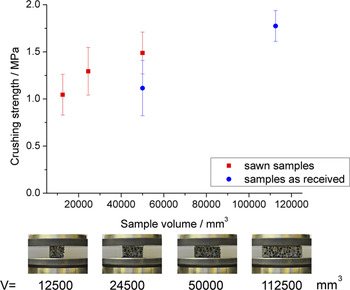
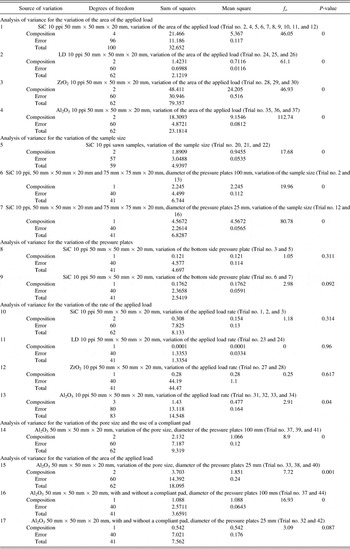
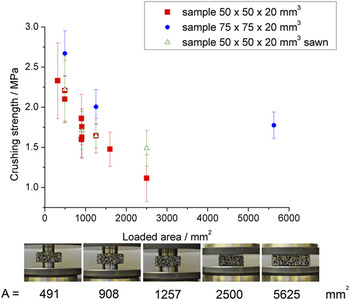
For the comparison of the crushing strengths listed in the literature, it is essential to know the influence of the sample size. Figure 3 shows an increasing crushing strength with a rise of the sample size. The analysis of variation proofs with a P-value of 0 that the difference is significant, see Table IV, no. 5. Testing of filters with two different sizes (50 × 50 × 20 and 75 × 75 × 20 mm) with different areas of applied load reveals a similar behavior, see Fig. 4. The crushing strength of the larger samples (75 × 75 × 20 mm) is higher. The analysis of variation confirms the influence; see Table IV, no. 6 and 7. Heness et al.Reference Heness, Booth and Ben-Nissan9 made similar observations but did not give an explanation.
Crushing strength in dependence of the sample volume (SiC, 10 ppi, diameter of the loading plate 100 mm).

Results of the analysis of variation.

Crushing strength in dependence of the sample size and the area of the applied load (SiC, 10 ppi).

The rise of strength with increasing sample volume in the special case of brittle foam ceramics contradicts the Weibull theory, which claims a decrease of the strength with increasing sample volume.Reference Salmang and Scholze17 The Weibull theory assumes that the global failure of the sample occurs when the applied load is larger than the resistance of the weakest point in the sample. On the contrary, the accumulation theory assumes the occurrence of a global failure when a certain proportion of the flaws fail.Reference Wolf, Walther, Langer and Stoyan4,Reference Ballani, Stoyan and Wolf18 This damage accumulation was described by Dam et al.Reference Dam, Brezny and Green6 and Brezny et al.Reference Brezny and Green3 The latter confirmed the appearance of damage before the occurrence of global failure with the help of acoustic emission measurements. This shows that the material theories have to use with caution here. The foam has to be described in two scales. Weibull theory still works in the material scale on the struts. But on foam structure scale the damage accumulation is used.
C. Influence of the size of the loading plate
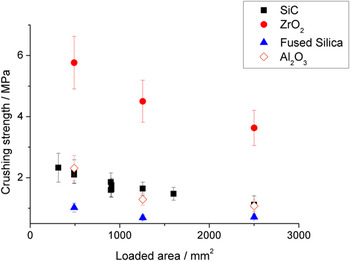
According to the standardization for refractory material DIN EN ISO 88951 and DIN EN 993-5,2 the loading plates for the measurement of the crushing strength need to have an area equal or larger than the loaded area of the sample. But for the ceramic foam, loading plates smaller than the samples were applied. The following tests will assess if comparable results are delivered. Fig. 5 shows the crushing strength in dependence of the loaded area of filters made of SiC, fused silica (LD), ZrO2, and Al2O3. The four materials feature different compression strengths, which are caused by the different material strength values of the dense materials, differences in the density, respectively, structural differences, see Table III. The crushing strength decreases with an increasing area of the applied load for all the different materials. The smallest value of the crushing strength is achieved when the complete sample surface is tested. The analysis of variance of the tests with area variation of the applied load shows P-values of 0, see Table IV, 1–4. In this case, the hypothesis H0, that there is no significant difference, has to be rejected.
Crushing strength in dependence of the loaded area of filters made of SiC, fused silica, ZrO2, and Al2O3.

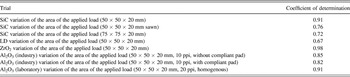
Gibson et al.Reference Gibson and Ashby14 have observed a comparable behavior and developed a failure mechanism for the explanation of the decrease in the crushing strength with the increase of the area of the applied load. Gibson et al. stated that the probability of a strut having contact to the loading plates is binomially distributed. They deduced a linear dependence between the crushing strength and  $\sqrt A$, where A denotes the loaded area. To test whether this interrelation is relevant for our results, the coefficient of determination R2 was determined, which is used to describe how well a regression line fits a set of data. The coefficient of determination of the crushing strength and the root of the area of the applied load are between 0.67 and 0.98, see Table V. Except the results of the fused silica filters, the results are in good agreement with the proposed
 $\sqrt A$ dependency. The explanation would suggest a similar behavior when the sample size changes, which did not occur according to the experiments.
Further explanations for the decrease of the crushing strength with increasing area of the applied load are discussed in Sec. IV.
Coefficient of determination of the crushing strength and the root of the area of the applied load.

Besides, it was tested whether there is a difference using a down-side loading plate with a diameter of 100 mm or the same diameter as the top side loading plate. The analysis of variance (Table IV, no. 8 and 9) yields P-values of 0.31 and 0.09, which implies no significant difference.
D. Influence of the rate of the applied load
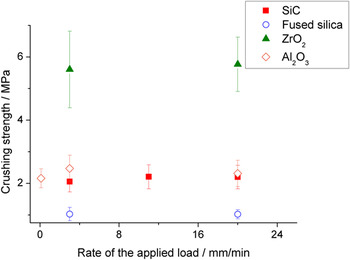
The rate of the applied load used according to the literature varies between 0.5 mm/min,Reference Meille, Lombardi, Chevalier and Montanaro10 1 mm/min,Reference Acchar, Souza, Ramalho and Torquato11 2.5 mm/min,Reference Orenstein and Green13 and 20 mm/min.12 The filters made of Al2O3, ZrO2, fused silica, and SiC were tested with loading rates of 3, 20 mm/min, and SiC additionally with 11 mm/min. To enhance the possible effect of the loading rate, two extreme values of 0.1 and 50 mm/min for Al2O3 filters were complementarily chosen. The rate has only a small impact on the crushing strength, see Fig. 6. The analysis of variation for SiC, fused silica and ZrO2 (Table IV, 10–12) results in P-values larger than 0.05, which means no influence. For Al2O3, the P-value is 0.04 (Table IV, 13), what implies a small correlation. The reason is that only for testing of the Al2O3 filter, a rate of 0.1 mm/min was applied, and this parameter decreased the standard deviation slightly.
Crushing strength in dependence of the rate of the applied load.

E. Influence of the pore size
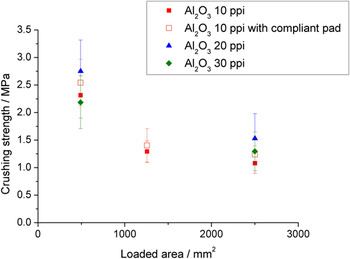
The ceramic foam filters of producer 3 made of Al2O3 were tested with 10, 20, and 30 ppi. The three filter types possess nearly the same foam density and the same relative density, see Table III. The crushing strength in dependence of the area of the applied load was measured, see Fig. 7. The differences between the three pore sizes are within the standard deviation but the analysis of variation shows that there are statistic differences. According to the model of Gibson and AshbyReference Gibson and Ashby14 the pore size has no influence on the crushing strength.
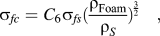 $${\rm{\sigma }}_{fc} = C_6 {\rm{\sigma }}_{fs} ({{{\rm{\rho }}_{{\rm{Foam}}} } \over {{\rm{\rho }}_S }})^{{3 \over 2}} \quad,$$
Crushing strength in dependence of the area of applied load, the pore size and the usage of a compliant pad.

Where σfc is the crushing strength of the foam, σfs is the strength of the struts, C 6 is a constant and  ${\textstyle{{{\rm{\rho }}_{{\rm{Foam}}} } \over {{\rm{\rho }}_S }}}$ is the relative density. Of particular note is the 20 ppi filters that possess the highest strength. According to the literature, there is no clear trend between pore size and crushing strength. Brezny et al.Reference Brezny and Green19 found a decrease of the crushing strength with an increase in pore size, whereby the results for cell sizes between 3 and 5 mm are relatively similar. Dam et al.Reference Dam, Brezny and Green6 observed an increase of the crushing strength with increasing cell size. These inconsistent results are caused mainly by changes in the structure, the material (or internal) porosity of the struts, the modification of the amount of closed pores and the tendency of the slurry to thicken the nodes more than the struts. The total porosities of the struts of the three different pore sizes, measured with the mercury intrusion porosimeter, are 35.4% for 10 ppi, 36.1% for 20 ppi, and 36.7% for 30 ppi. These values illustrate that the strut porosity is the same for the different pore sizes, and hence, there is no reason for the differences of the crushing strength.
Furthermore, it should be mentioned that the macroscopic observation of the global failure was difficult for the smaller pore sizes (30 ppi). Particularly, the application of loading plates with a diameter of 25 mm causes the intrusion of the loading plates into the foam, without the appearance of a global crack, comparable with the indentation behavior described by Gibson et al.Reference Gibson and Ashby14
F. Influence of the usage of a compliant pad
According to Gibson et al.,Reference Gibson and Ashby14 it is a key issue to load the foam ceramic uniformly, which is possible with the usage of a compliant pad between loading plates and filter. Dam et al.Reference Dam, Brezny and Green6 obtained a smaller scatter for the measurements and a better accordance to the model of Gibson and Ashby. Besides, the crack propagation event was more unstable. Fig. 7 shows the results of the determination of the crushing strength with and without a compliant pad. For the loading plates with a diameter of 100 and 40 mm, a smaller scatter was observed, therefore, the analysis of variance showed a P-value of 0 (Table IV, no. 16), which refers to a statistical difference of the crushing strength with and without a compliant pad. For the loading plates with a diameter of 25 mm, no difference was detectable (Table IV, no. 17).
G. Influence of the homogeneity of the porosity of the filters
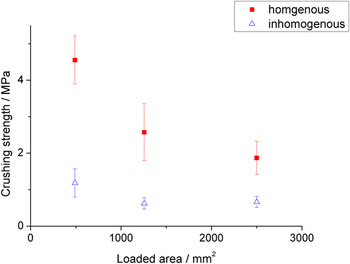
The two kinds of Al2O3 filters produced in the laboratory show a large difference in the maximum of porosity between the filter layers, see Table III, which indicates a difference in homogeneity of the porosity, respectively, the strut diameter. The filters were tested with different loading plate areas, see Fig. 8. The results show the strong influence of inhomogeneity of the porosity. The crushing strength is three to four times higher for the homogenous filters. The differences for the loading plate with a diameter of 25 mm are the largest.
Crushing strength in dependence of the homogeneity of the filter and the size of the loading plate.

IV. MECHANICAL ANALYSIS OF THE INFLUENCE OF THE TESTING ARRANGEMENT
The failure criterion for the crushing strength measurement is chosen as a force loss of 70% of the maximum force. This implies that a global failure (structural collapse) of the ceramic foam is evaluated. This assumption is supported by the fact that the filter breaks into several parts during failure. Before the onset of global failure, there occur local failures of struts, which do not initiate the global failure.Reference Brezny and Green3 Following the theory of damage accumulation, once a critical proportion of the structure has failed, the structure becomes unstable and the global failure occurs.
Gibson et al.Reference Gibson and Ashby14 evaluated the failure directly on the loading plate. They assumed that the failure occurs stepwise. When the filter layer on the loading plate fails, stress redistribution takes place and the next layer will be stressed by the loading plate. This implies that the probability of the rest of the filter to fail is significantly lower, which means that the highest stresses have to occur along the loading plate.
To understand the mechanics at the crushing strength measurement within the sample, the sample can be considered as a homogeneous block of material. This is a rough approximation but satisfies the basic considerations if the filter and loading plate geometries are much larger than the pore size. Using this assumption, a global stress distribution can be calculated with the finite element method (FEM). A common failure criterion for brittle ceramics is the maximum principal stress theory, where the material fails when a critical value is attained. The maximum is used because of the tension-compression anisotropy in many ceramic materials. In foam structures with low relative density, the dominating loading type for the struts is bending.Reference Gibson and Ashby14 It will be assumed that the local stresses at the struts correlate with the calculated principal stress distribution. Due to this stresses, struts can get critical tension loads, bending, and buckling. The calculated positive and negative principal stresses lead to bending loads of the struts. So, for the homogenized model, the maximum absolute principal stress has to be used as failure criterion. For such compression tests, the negative principal stresses (compression stresses) dominate.
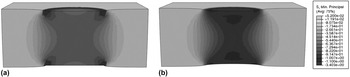
Fig. 9(a) shows the minimum principal stress distribution calculated with the commercial code Abaqus in the middle cross-section for a model (50 × 50 × 20 mm) with a rigid loading plate of size d = 20 mm and an applied mean pressure of 1 N/mm2. The region of highest load is at the edges of the loading plate. Because of the nonhomogeneous material distribution in the foam, this stress singularity does not appear like a homogeneous continuum. With increasing pore size, the stress peaks near the loading plate edges reduce and can be neglected. The area between the loading plates is loaded relatively homogeneous and significantly higher than the rest of the sample. This result leads to the assumption that the location with the highest probability for failure is the whole area between the loading plates, not only the layers close to the loading plates. The model in Fig. 9(b) shows a simulation with a compliant pad simulated by an applied surface pressure. Instead of a rigid loading plate, a homogeneous pressure of 1 N/mm2 is applied. Here, stress peaks can also be observed at the edges of the loading plate. Furthermore, the homogeneously loaded region between the loading plates is much more hourglass shaped. Below the loaded surface, an internal region of higher stresses can be found. This is typical for compression and supports the assumption that failure occurs inside the filter and not at the surface.
Minimum principal stress distribution for a model with 50 × 50 × 20 mm, diameter of the loading plate 20 mm and an applied pressure of 1 N/mm2 (a) without a compliant pad, (b) with a compliant pad from FEM simulation.

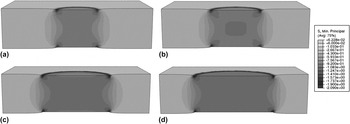
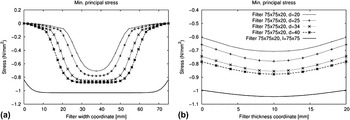
The next model varies the loading plate size (d = 20, 25, 34, 40 mm). The sample size is fixed as 75 × 75 × 20 mm and the applied load is again a constant distributed pressure 1 N/mm2 (see Fig. 10). With increasing size of the loading plate, the minimum principal stress distribution in between the plates becomes more homogeneous and the maximum absolute values increase (see Fig. 11). This leads to decreasing crushing strengths and is in accordance with the trend observed in the experiments (see Figs. 4 and 5). Another effect which may support this trend is the possibility of stress redistribution during failure. It is assumed that a local failure within the filter leads to a stress redistribution into the surrounding region. If the surrounding region is already at the load carrying capacity, stress redistribution leads to immediate failure of this region and the whole structure becomes unstable and fails. This explanation is in accordance with the damage accumulation hypothesis.Reference Ballani, Stoyan and Wolf18 With increasing size of loading plates, the possibility to redistribute stress decreases.
Minimum principal stress distribution for a model with 75 × 75 × 20 mm and an applied pressure of 1 N/mm2, diameter of the loading plate (a) 20 mm, (b) 25 mm, (c) 34 mm, and (d) 40 mm from FEM simulation.

Minimum principal stress distribution at the filter center lines in dependence of the diameter of the loading plates (a) in dependence of the width and (b) in dependence of the thickness.

For the case that the sizes of the loading plate and the filter are equal (see Fig. 12), the principal stress distribution is much more homogeneous. The maximum absolute values occur in the specimen center and increase for smaller specimen. This explains the lower crushing strength for small specimens. With increasing filter size and constant thickness, the principal stress distribution becomes more homogeneous. To create an entirely homogeneous stress distribution, the friction between loading plate and filter has to be avoided or transverse strains of the sample have to be restraint. Therefore, a clamp around the filter with a low friction coefficient may be used. It seems to be advantageous to use a compliant pad for the loading plate to prevent unwanted stress peaks at the filter surface. If the compliant pad does not restrain the transversal displacements at the filter surface, the homogeneity of principal stress distribution in the whole sample can be improved.
Minimum principal stress distribution for a model with (a) 50 × 50 × 20 mm, (b) 75 × 75 × 20 mm, loading plate size and filter size are equal and an applied pressure of 1 N/mm2.

The presented mechanical simulations of a crushing strength measurement show the same trends for loading plate size, sample size and the advantage of a compliant pad as observed in the experiments. A significant difference between a partly loaded or a fully loaded sample is the stressed volume within the sample and the homogeneity of the principal stress distribution. The crushing strength of a partly loaded sample depicts just a part of a filter, which can be an advantage when testing filters with an inhomogeneous geometry. An entirely loaded sample surface depicts a whole filter much better. This may be improved by using a compliant pad and/or a clamp around the filter. Furthermore, the stress singularities at the loading plate can be avoided by using entirely loaded specimens. Obviously, the sample and loading plate size have a significant influence on the measured crushing strength value. So, measurements with different parameters are not comparable.
The experiments show two different kinds of failure, which have to be clearly separated. For the material, filter properties and testing arrangement under consideration, the failure described by Gibson et al. seems to be an exceptional case. The presented simulations are just correlated with the complete failure of the filter and cannot be used for failure type of Gibson et al. Also the correlation between the chosen failure criterion and the complex failure process at the filter is undetermined. To understand the influence of the filter geometry and the difference between both kinds of failure, damage mechanic simulations have to be performed.
V. CONCLUSION
The influence of different measurement parameters on the crushing strength was studied. The results illustrate the difficulties, which arise when different crushing strength values should be compared. The results show that the different parameters have different impacts on the measurement. The sample size and the area of the applied load have large influence on the value of the crushing strength. The larger the area of the applied load the smaller is the crushing strength. On the contrary, an enhanced crushing strength can be observed for larger sample size. The presented mechanical simulations of a crushing strength measurement show the same trends for loading plate size, sample size and the advantage of a compliant pad as observed in the experiments. The results seem to be in accordance with the damage accumulation hypotheses.
The results clearly indicate that the comparison of crushing strength is only possible when the parameters are chosen uniformly. A standardization of the measurement of the crushing strength is necessary.
ACKNOWLEDGMENTS
The authors would like to thank the German Research Foundation (DFG) for supporting these investigations in terms of the Collaborative Research Center 920, Multi-Functional Filters for Metal Melt Filtration—A Contributions toward Zero Defect Materials.” The authors also would like to acknowledge the support of J. Höhne, R. Fricke, S. Soltysiak and N. Brachold. Finally, we would like to thank Drache GmbH and Foseco Foundry Division Vesuvius GmbH, Germany for their support.