Introduction
Direct democratic institutions change how political decisions are reached. A classic question is whether the presence of direct democratic institutions affects the extent of state intervention (e.g. Wagschal Reference Wagschal1997; Matsusaka Reference Matsusaka2004; Funk and Gathmann Reference Funk and Gathmann2013; Walter Reference Walter2019). In a recent comprehensive literature review, Matsusaka (Reference Matsusaka2018) shows that effects differ between direct democratic institutions and depend on features of the representative system. Most notably, while financial referendums are consistently observed to have a negative effect on state intervention, the evidence is more mixed in the case of popular initiatives. Finally, little is known about the effect of law referendums and earlier periods more generally (for the latter, an exception is Matsusaka Reference Matsusaka2000).
We add to this literature in two ways. First, echoing Hug (Reference Hug2009), we argue that to better understand how direct democratic institutions work, we need to analyse how they interact with the representative system. While the literature has shown the effect of direct democratic institutions to depend on features of the representative system (e.g. Gerber Reference Gerber1996b; Boehmke et al. Reference Boehmke, Osborn and Schilling2015; Matsusaka Reference Matsusaka2018), there has been little research focused specifically on understanding which features of the representative system matter. We explore an aspect of the representative system that is particularly important in shaping decision-making processes: the size of the governing coalition (Bawn and Rosenbluth Reference Bawn and Rosenbluth2006; Persson et al. Reference Persson, Roland and Tabellini2007). We thus formulate theoretical expectations on how different direct democratic institutions interact with coalition size in affecting public spending.
Second, based on newly collected data, we examine the relationship between three different direct democratic institutions, coalition size and public spending over the period from 1860 to 2015. Empirically, we explore subnational variation in Switzerland, which is one of the most prominent cases relying on direct democracy (including at subnational level). Importantly, Switzerland’s high level of fiscal decentralisation means that most public spending occurs at the subnational level. Switzerland also features a diversity of direct democratic institutions. We focus on three in particular.
Popular initiatives Footnote 1 allow voters to put policy proposals to popular votes (subject to signature requirements and collection periods) without consulting or requiring the approval of legislative or executive bodies. If approved at the ballot box, proposals must be implemented. In contrast, law referendums Footnote 2 allow citizens to challenge laws previously passed by parliament (again subject to signature requirements and collection periods). If law referendums are approved at the ballot box, laws are null and void. Finally, financial referendums Footnote 3 set a monetary threshold for public spending. If policies surpass this threshold, popular votes are either mandatory or can be held if enough signatures are collected in the required period. If financial referendums are approved at the ballot box, public money will not be spent.
Our empirical analysis finds the effect of popular initiatives to depend on the size of the governing coalition. Bawn and Rosenbluth (Reference Bawn and Rosenbluth2006) show that single-party governments spend less than multi-party governments. We observe that when only a few parties are in government, voters respond to the undersupply of public goods by launching initiatives that aim at expanding public spending. However, this positive effect on public spending disappears as coalition size increases.
In addition, in line with the existing literature (e.g. Funk and Gathmann Reference Funk and Gathmann2011), we find that financial referendums slow down the growth of public spending. However, the effect does not vary with coalition size.
In contrast, unlike earlier research that emphasised the veto player effect of law referendums (e.g. Wagschal Reference Wagschal1997), we find no negative effect of law referendums on public spending. Instead, we argue that law referendums affect public spending in possibly unexpected ways, as they operate as a sword of Damocles, in response to which governments may forge oversized coalitions for laws where they fear defeat at the ballot box (for an early formulation of this argument, see Neidhart Reference Neidhart1970). Empirically, the anticipation of such direct democratic challenges leads to more public spending, which compensates for the more direct veto player effect of law referendums, ultimately resulting in a null effect on public spending.
Finally, we find that the relationship between direct democratic institutions, coalition size and public spending does not change over time. Employing three different empirical strategies to identify time-variant effects, we observe the mechanisms to be stable and robust despite the long period under investigation (1860–2015).
This article is organised as follows. The next section develops our theoretical expectations about how the different direct democratic institutions interact with coalition size in affecting public spending. Subsequently, we discuss our case selection, the research design and the data. We then turn to the empirical examination of our theoretical expectations. A final section concludes.
Direct democracy and the representative system
The relationship between direct democracy and public spending is the subject of a rich literature. According to (Vatter et al. Reference Vatter, Rousselot and Milic2019, 177–178), there are basically two schools of thought. Highlighting the veto player function of direct democracy, especially in the form of financial referendums (cf. Hug and Tsebelis Reference Hug and Tsebelis2002), several scholars observe a negative effect on public spending (e.g. Romer and Rosenthal Reference Romer and Rosenthal1979; Matsusaka Reference Matsusaka1995; Wagschal Reference Wagschal1997; Obinger Reference Obinger1998; Feld and Matsusaka Reference Feld and Matsusaka2003; Funk and Gathmann Reference Funk and Gathmann2011; Funk and Gathmann Reference Funk and Gathmann2013). Other scholars, in the tradition of Downs (Reference Downs1957), argue that more direct participation, especially in the form of popular initiatives, may lead to more state intervention due to democracies’ inherent tendency to redistribute (e.g. Freitag and Vatter Reference Freitag and Vatter2006; Blume et al. Reference Blume, Müller and Voigt2009; Blume and Voigt Reference Blume and Voigt2012; Asatryan Reference Asatryan2016; Asatryan et al. Reference Zareh, Baskaran, Grigoriadis and Heinemann2017; Walter Reference Walter2019). In an encompassing literature review, Matsusaka (Reference Matsusaka2018) finds that financial referendums are consistently observed to have a negative effect on state intervention. In contrast, the evidence is more mixed in the case of popular initiatives (see also Morger and Schaltegger Reference Morger and Schaltegger2018). Finally, comparatively little is known about the effect of law referendums.
In this section, we develop a series of theoretical expectations about how popular initiatives, law referendums and financial referendums relate to public spending. Most notably, we explore how these direct democratic institutions interact with the representative system. The literature has repeatedly shown the effect of direct democratic institutions to depend on features of the representative system (e.g. Gerber Reference Gerber1996b; Hug Reference Hug2009; Boehmke et al. Reference Boehmke, Osborn and Schilling2015; Leemann and Wasserfallen Reference Leemann and Wasserfallen2016; Matsusaka Reference Matsusaka2018). Yet, there is comparatively little research focused specifically on understanding which features of the representative system matter. We examine a specific feature, which is of particular importance in shaping political decision-making processes: the size of the governing coalition, here understood as the number of parties forming the government.
The existing literature has shown coalition size to matter for public expenditure (e.g. Volkerink and de Haan Reference Volkerink and de Haan2001; Perotti and Kontopoulos Reference Perotti and Kontopoulos2002; Bräuninger Reference Braeuninger2005; Bawn and Rosenbluth Reference Bawn and Rosenbluth2006; Persson et al. Reference Persson, Roland and Tabellini2007). Conceiving of the political space as being composed of a limited number of societal groups, this literature argues that the groups’ welfare is a function of public spending. Government participation provides political parties with the possibility to channel resources to their constituencies. Yet, spending decisions are made under cost constraints that change with the size of a party’s support base. In small coalitions, parties represent the interest of multiple societal groups that constitute a large part of the population. As a result, they have to balance the demand for different public goods with limited scope to externalise costs (assuming that the financial burden for public spending is borne by all societal groups). In contrast, parties in large coalitions depend on smaller constituencies, respectively, with more homogeneous preferences for spending, allowing them to externalise costs to a larger population share. This simple but powerful argument implies that public spending increases with the number of parties partaking in the governing coalition. Footnote 4
How does coalition size interact with the relationship between direct democratic institutions and public spending? In principle, we can distinguish between direct and indirect effects of direct democratic institutions (Neidhart Reference Neidhart1970; Gerber Reference Gerber1996a; Matsusaka and McCarthy Reference Matsusaka and McCarthy2001; Matsusaka Reference Matsusaka2014). Consider the case of law referendums, which allow citizens to collect signatures against a newly legislated law. By definition, this institution’s direct effect is to block new legislation and, by doing so, limit the creation of new government action with spending implications (e.g. Immergut Reference Immergut1990; Hug and Tsebelis Reference Hug and Tsebelis2002). Yet, such institutions might also have indirect effects. In the case of law referendums, indirect effects may result from the anticipation of referendum challenges. If governments and legislators are strategic, governments may be enticed to forge oversized coalitions to avoid defeat at the ballot box (e.g. Neidhart Reference Neidhart1970; Gerber Reference Gerber1996a). In this case, the indirect effect of law referendums might, in fact, increase public spending.
We expect direct democratic institutions to differ in the way they interact with the representative system. Therefore, we discuss the interaction between direct democratic institutions and coalition size for each institution separately. We start with popular initiatives. Subsequently, we discuss law referendums and, finally, financial referendums.
Popular initiatives
Popular initiatives extend proposal power to groups outside the governing coalition (Smith and Tolbert Reference Smith and Tolbert2004; Leemann Reference Leemann2015; Morger and Schaltegger Reference Morger and Schaltegger2018). The direct effect of popular initiatives is thus to give groups outside the governing coalition the possibility to put their spending preferences on the political agenda. In Switzerland, popular initiatives allow proposing a bill without consulting or requiring the approval of legislative or executive bodies. Therefore, popular initiatives provide the proposer with great flexibility to engineer an optimal coalition (Leemann Reference Leemann2015, 601). The direct effect of popular initiatives should thus lead to more public spending (e.g. Freitag and Vatter Reference Freitag and Vatter2006; Asatryan Reference Asatryan2016; Asatryan et al. Reference Zareh, Baskaran, Grigoriadis and Heinemann2017).
Moreover, this direct effect should be particularly strong in the case of small governing coalitions. Given that the level of public spending is lower in the case of small governments, societal groups’ spending preferences are least served in such situations. As a result, they have a strong incentive to employ popular initiatives to increase public spending (in their favour). In addition, it implies that the smaller the number of parties in government, the more likely that societal groups not represented in government will, ceteris paribus, succeed in forming a winning coalition (Walter Reference Walter2019). In contrast, in the case of large governing coalitions, parties have a narrower voter base and, thus, can externalise a higher share of the costs, which should lead to higher levels of public spending (e.g. Bawn and Rosenbluth Reference Bawn and Rosenbluth2006). In turn, this means that there are fewer incentives to employ initiatives to increase public spending, and there is a more limited potential to form a winning coalition.
Yet, popular initiatives also have indirect effects. With a view on the interaction with coalition size, we want to emphasise their role in splitting government coalitions. Popular initiatives can make it more difficult for coalition governments to externalise costs because outside groups can use popular initiatives to propose alternatives to parts of the governing coalition. This indirect, coalition-splitting effect of popular initiatives makes credible commitments within coalitions more difficult (cf. Bäck and Lindvall Reference Bäck and Lindvall2015). In doing so, popular initiatives can break up package deals in coalitions and prevent excessive spending that is externalised to groups outside the governing coalition. Footnote 5 The indirect effect of popular initiatives should thus reduce public spending.
We expect this indirect, expenditure-reducing effect of popular initiatives to become more relevant with coalition size. It is easy to see why. The smaller the governing coalition (understood as the number of parties forming the coalition), the more difficult it becomes to break the coalition. At the most extreme, the government consists of only one party. In contrast, in the case of large governing coalitions, there is also a large number of potential defectors, thus increasing the likelihood that popular initiatives have the discussed indirect effect.
Based on these mechanisms, we expect popular initiatives to have a positive effect on public spending in presence of small coalition governments (the direct effect prevails), while we expect popular initiatives to have a negative effect on public spending in case of large coalition governments (the indirect effect prevails).
Law referendums
Law referendums have a direct effect on the policy process by being successfully employed. For instance, successful law referendums prevent the adoption of new laws or amendments that would have been implemented in the absence of a popular vote. If every legislative act is potentially subject to a law referendum, political decision-making processes are confronted with additional veto players, which affects the law-making process globally (Hug and Tsebelis Reference Hug and Tsebelis2002). This direct effect of referendums is likely to slow down the growth of the state.
This negative effect should increase with coalition size (i.e., become more negative) because large coalitions tend to increase public spending, but this public spending does not necessarily benefit groups outside the coalition government. Hence, when large coalition governments are in power, outside groups are even more incentivised to challenge laws passed by parliament, because public spending is likely to strongly deviate from their spending preferences.
Yet, law referendums can also influence the policy process indirectly (Hug Reference Hug2004; Leemann and Wasserfallen Reference Leemann and Wasserfallen2016). The credible threat of powerful interest groups or political parties to employ referendums can push legislators to change or abandon policy proposals. Given that outcomes in popular votes are, to a certain extent, unpredictable, members of parliament have an incentive to accommodate the interests of all relevant groups. The goal is the anticipation or withdrawal of referendum challenges. As a result, law referendums incentivise political decisionmakers to create oversized coalitions in support of specific policies to avoid defeat at the ballot box. Ultimately, this anticipation effect implies that governments try to accommodate the policy preferences of all (or most) societal groups capable of launching a referendum (for an early formulation of this argument, see Neidhart Reference Neidhart1970). Footnote 6 As these policy preferences of societal groups typically result in further spending, this anticipation effect should lead to more public spending.
Coalition size is likely to accentuate this positive effect on public spending. Larger government coalitions consist of parties with relatively small, but homogeneous constituencies, which allow them to externalise costs to a larger share of the population (e.g. Bawn and Rosenbluth Reference Bawn and Rosenbluth2006). Hence, in the case of large coalitions, the interests of an even larger number of small groups must be accommodated in order to avoid defeat at the ballot box, which is likely to increase public spending even further. Footnote 7
Whether the direct or indirect effect of law referendums on public spending prevails is an empirical question. Yet, we believe the indirect effect of law referendums to be more important because the large majority of political decisions are made exclusively within the representative system, while only a few policies are challenged in the people’s court. Put differently, all political decisions are made in the “shadow” of a referendum challenge. As a consequence, the number of political decisions that are subject to the indirect effect clearly outnumbers the number of decisions subject to the direct effect of law referendums.
Financial referendums
Like law referendums, financial referendums are subject to direct and indirect effects. Yet, empirical research has consistently found a negative effect on public spending (cf. Matsusaka Reference Matsusaka2018). In the case of financial referendums, politicians propose a policy, resulting in a certain amount of additional public spending. If the monetary threshold triggering a financial referendum is crossed, citizens have the opportunity to approve the policy. If citizens accept the proposal, the policy will be implemented and lead to the expected costs. In contrast, if citizens decline, the policy will not be implemented, and the expected costs will not materialise. Hence, with regard to direct effects, financial referendums should have a negative effect on public spending. In addition, for the reasons discussed above, this negative effect should become stronger as governments are increasingly spendthrift. As a consequence, the negative effect should increase with the government coalition size.
Of course, governments might anticipate the possibility of a financial referendum (indirect effect). For instance, decisionmakers might be incentivised to create oversized coalitions in support of specific policies to avoid defeat at the ballot box. Yet, for two reasons, such anticipation effects are less likely in the case of financial referendums.
First, financial referendums are often mandatory once a certain monetary threshold is crossed, which implies that financial compensation cannot prevent the referendum, but only tilt the outcome of the popular vote in one’s favour. In addition, such anticipation effects leading to higher levels of public spending also increase the likelihood of crossing the monetary threshold, triggering a financial referendum in the first place.
Second, in the case of financial referendums, anticipation strategies also include attempts to structure policies in an attempt to stay below the monetary threshold that triggers financial referendums (e.g., by splitting policy projects into several smaller ones, which all stay below the spending level triggering a financial referendum). If they succeed, the financial referendum can be avoided and the money can be spent as planned. Yet, there are often clear limits with regard to how policies can be restructured to such an end.
Hence, similar to law referendums, we expect direct and indirect effects to work against each other in the case of financial referendums. However, given these additional difficulties in anticipating referendum challenges, we expect the direct effect to prevail in the case of financial referendums.
Case selection, data and research design
We examine the conditional effect of direct democratic institutions on public spending using subnational (cantonal level) data from Switzerland. Two features make Switzerland a good choice for our analysis. First, all Swiss cantons know direct democratic institutions. Yet, there is considerable variation across time and space. While some cantons introduced these instruments early, others were laggards (Leemann Reference Leemann2019). Similarly, while some cantons make the recourse to direct democratic instruments easy, others feature more restrictive rules.
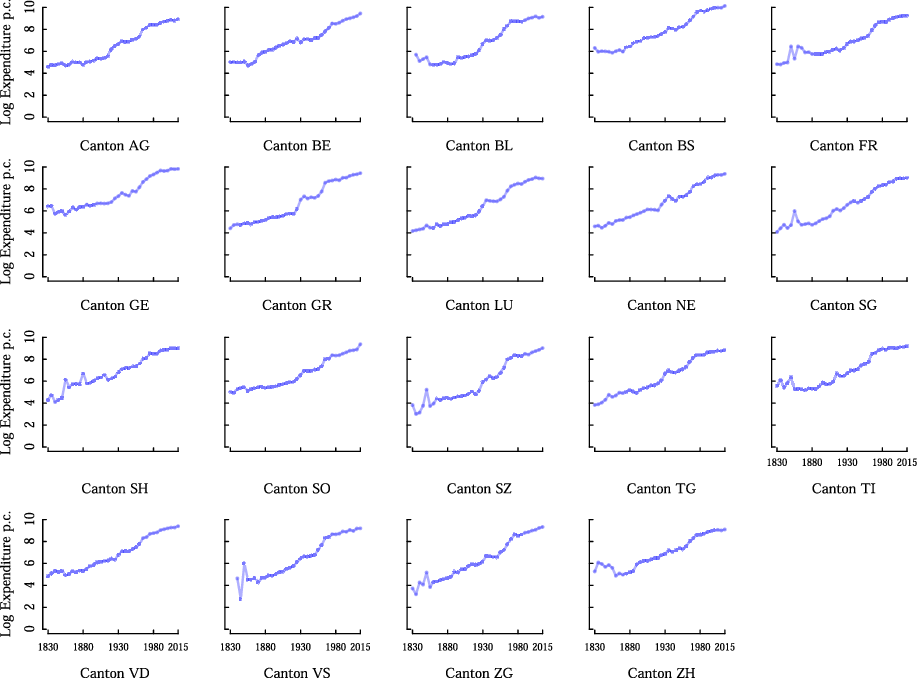
Second, most public spending is located at the subnational level. Despite several decades of fiscal centralisation, only 32% of public spending is located at the federal level (data for 2016 from the Eidgenössische Finanzverwaltung 2017). In contrast, 41% of public spending is located at the cantonal level (the remaining 27% is primarily located at the municipality level). In addition, there is considerable variation across time and space, as we have shown in Figure 1.
The development of public spending in Swiss cantons, 1830–2015.

We are, of course, not the first to focus on Swiss cantons to examine the link between direct democratic institutions and public policies. Several researchers have used similar research designs to examine the effect of direct democracy on public spending (e.g. Kirchgässner et al. Reference Kirchgässner, Feld and Savioz1999; Feld and Matsusaka Reference Feld and Matsusaka2003; Freitag and Vatter Reference Freitag and Vatter2006; Funk and Gathmann Reference Funk and Gathmann2011) or other socio-economic outcomes (e.g. Frey Reference Frey1994; Feld and Savioz Reference Feld and Savioz1996; Freitag and Vatter Reference Freitag and Vatter2000).
We have engaged in a considerable data collection effort. First, we have collected public spending data in 5-year intervals from the public budget reports of the cantonal governments, covering the period 1830–1930 (Emmenegger et al. Reference Emmenegger2020). Footnote 8 Subsequently, we have merged our data with that provided by Funk and Gathmann (Reference Funk and Gathmann2011), which covers the period 1890–2000 and were obtained from federal records (most notably the Federal Office of Statistics). Note that no federal records are available before 1890. Finally, we have extended the dataset to cover the period 2000–2015, again based on federal records.
Both data collection strategies have their specific strengths and weaknesses. Cantonal budget reports are closer to the “source”. Yet, there is a risk that cantonal definitions differ as to what belongs to public spending (e.g., separate budgets for cantonal monopolies on the salt trade). Federal records might provide more comparable information. Yet, federal records are more valid only if the data provided by the cantons correspond to the federal guidelines. The overlap of 40 years (1890–1930) in our data and that provided by Funk and Gathmann (Reference Funk and Gathmann2011) allowed us to explore such differences. In some cases, we went back to the cantonal archives to find additional budgets that were not part of the official cantonal budget reports (e.g., separate budgets for public schools in Obwalden). In other cases, we found that cantons reported incomplete data to the federal administration (e.g., Appenzell Innerrhodes reported data only for its finance department, but not public spending by other cantonal departments). Once we had all discrepancies cleared, we merged the data to obtain a dataset covering the period 1830–2015. For the sake of consistency, we use all data in 5-year intervals.
To make the data comparable over time and across cantons, we employ official exchange rates and the consumer price index (prices in 2005 Swiss francs). Footnote 9 In addition, we divided public spending by the cantonal population to account for different canton sizes. Finally, we transformed the data with the natural logarithm. In Figure 1, we plot the growth of spending in all cantons with representative systems. Unsurprisingly, the figure shows a clear upward trend in the period 1830–2015. Yet, we also observe considerable variation across time and space, which we will explore in the empirical section.
Second, we rely on data on the institutionalised rules of direct democratic instruments for the period 1830–2015. For the purpose of the article, we distinguish between popular initiatives, law referendums and financial referendums. We rely on all cantons that had a representative system throughout the period of investigation. We, therefore, exclude the six small cantons that rely on citizen assemblies (Glarus, Nidwalden, Obwalden, Uri and both Appenzell).
Direct democratic institutions vary with regard to the ease to which they can be put to use. The existing literature has used this variation to identify the effect of direct democratic institutions on political outcomes. Researchers have employed proxies for the economic costs of using direct democratic institutions related to variations in signature requirements and collection periods to capture these institutions’ effects (e.g. Stutzer Reference Stutzer1999; Fehr and Gächter Reference Fehr and Gächter2000; Torgler Reference Torgler2002; Frey and Stutzer Reference Frey and Stutzer2010). More precisely, the higher the signature requirements (relative to the population of the relevant political unit) and the shorter the collection period, the higher the economic costs of using direct democratic institutions.
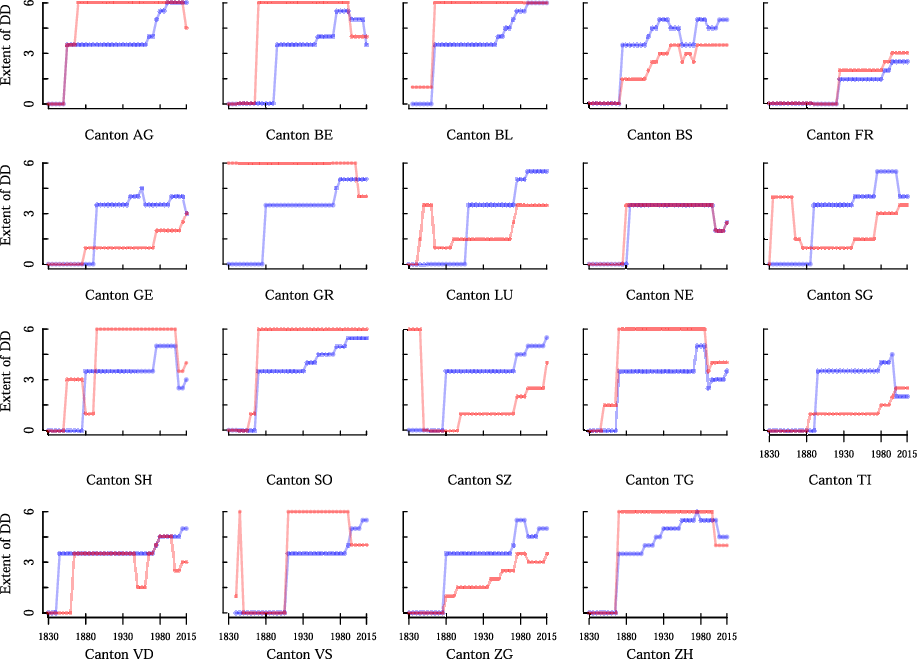
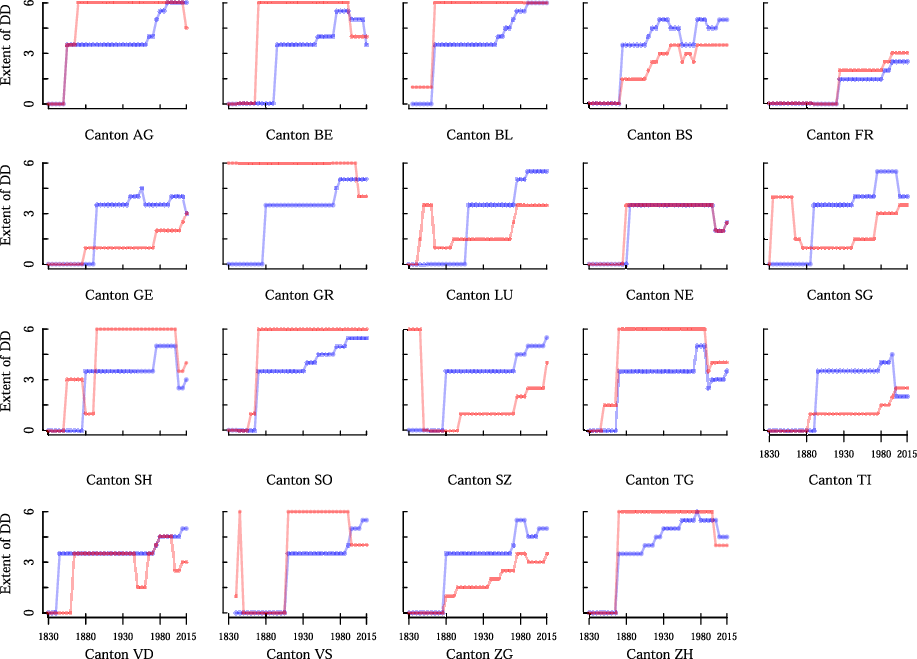
Our measures for popular initiatives and law referendums are composite indices and come from Leemann (Reference Leemann2019). Both indices range from 0 to 6 with higher values displaying lower “costs” of using direct democratic instruments, i.e. lower signature requirements and longer signature collection periods. Figure 2 shows the extent to which cantonal constitutions grant the citizenry participatory rights. Red lines capture law referendums, while blue lines capture popular initiatives. Higher values indicate that it is easier to force a ballot vote on a policy that has been passed in parliament (law referendum) or force a popular vote on a specific proposal (popular initiative). We provide more detailed information on the indices in the appendix (see Sect. 6.2 in supplementary material).
The extent of direct democratic institutions in Swiss cantons, 1830–2015. Note: Red lines show values for law referendums and blue lines show values for popular initiatives.
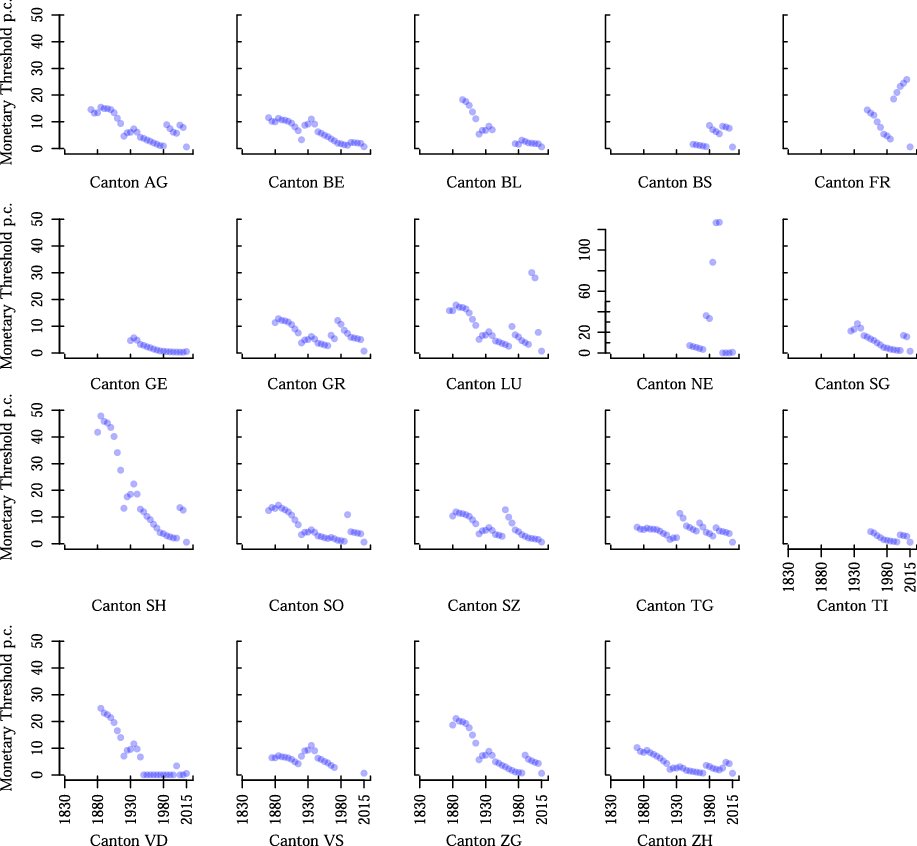
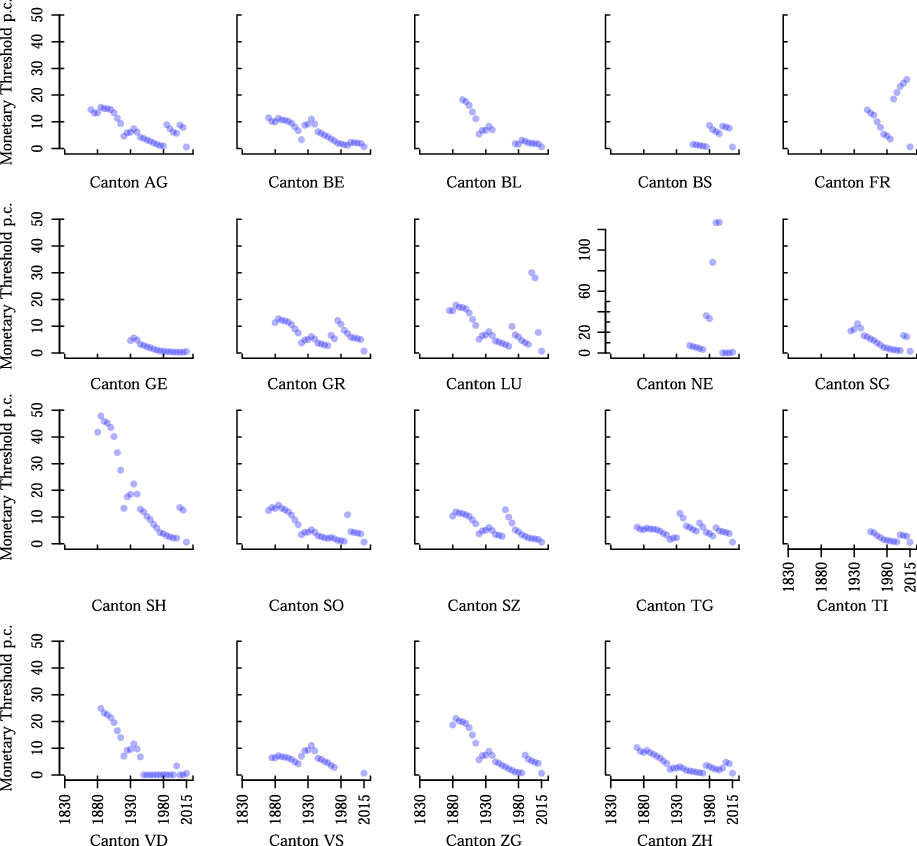
We also examine the effect of financial referendums on public spending. Existing analyses have often used rather simple measures of financial referendums, typically a dummy variable capturing its existence (e.g. Funk and Gathmann Reference Funk and Gathmann2011). Instead, we use the deflated monetary threshold per capita for financial referendums (for a similar approach, see Feld and Matsusaka Reference Feld and Matsusaka2003). Put differently, we take advantage of the fact that the “stinginess” of financial referendums varies across cantons and time, with some cantons enabling financial referendums in the case of small expenditures, while others rule out the financial referendum even for relatively large expenditures. Figure 3 shows how the deflated monetary thresholds per capita developed in the period 1830–2015. In line with the literature, we expect the financial referendum to have a stronger effect in the case of low monetary thresholds (deflated and per capita). As a consequence, we expect the coefficient of our indicator of financial referendums to be positive (because high thresholds indicate a comparatively permissive financial referendum).
Deflated monetary thresholds of financial referendums (per capita) in Swiss cantons, 1830–2015. Note: The canton of Neuchatel (NE) has a different scale on the y-axis.
This operationalisation implies that we are not working with an index comparable to the ones used for popular initiatives and law referendums. The reason is that in many Swiss cantons, a popular vote is mandatory if a policy surpasses a certain predefined monetary threshold. As a consequence, in these cases, there are no signature requirements and collection periods. Instead, we capture variation across cantons and over time by means of the deflated monetary threshold per capita triggering a financial referendum.
In the case of financial referendums, we are, however, confronted with a challenge. If the financial referendum has not been adopted (yet), we have no data for the monetary threshold. This is not a problem with our indices of popular initiatives and law referendums, which conceptualise the recourse to popular initiatives and law referendums in terms of associated “costs”. In this operationalisation, the absence of popular initiatives and law referendums, respectively, corresponds to the highest possible costs on the index (score is 0). In the case of financial referendums, we follow two strategies to deal with such cases. First, in the absence of a financial referendum, we assign a value of 0 to the monetary threshold. Second, we add a binary indicator that takes on the value of 1 when a canton does not have the financial referendum institution. This is the modified zero-order regression described by Greene (Reference Greene1993) and Maddala (Reference Maddala1977) as a solution to partial missingness.
Third, we rely on data on the political composition of cantonal governments for the period 1848–2017 (Walter and Emmenegger Reference Walter and Emmenegger2019). Footnote 10 In line with the previous literature (e.g. Bawn and Rosenbluth Reference Bawn and Rosenbluth2006), we use the number of parties in government as a theoretically relevant predictor of public spending. In addition, we control for the seat share of left parties to control for partisan effects on public spending (Schmitt and Zohlnhoefer Reference Schmitt and Zohlnhoefer2019). Finally, the previous literature has linked parliamentary fragmentation to higher government spending, especially in political systems in which governments are directly elected (Eslava and Nupia Reference Eslava and Nupia2017). To proxy parliamentary fragmentation, we use a binary variable to capture whether the proportional representation is employed to elect representatives for the legislative.
In addition, we use a number of control variables to account for socio-economic influences on government spending. Given that GDP data is not available, we use the size of the first and second sectors, infant mortality and physician density as proxies. Furthermore, we measure demographic pressures with the dependency ratio, i.e. the share of the population below the age of 15 and above 64. We also include the population’s size, transformed by the natural logarithm to capture changes in the denominator of our dependent variable. Lastly, we use the logarithm of federal subsidies per capita. A table with summary statistics is presented in the appendix (see Sect. 6.1 in supplementary material).
The combined data covers the period 1860–2015 and is measured in 5-year intervals. To estimate the effect of direct democratic instruments on public spending, we rely on an error correction model and employ the following specification. First, we include canton and year fixed effects (FE) to control for unobserved constant heterogeneity and common shocks. Second, we add a lag of the outcome variable (public spending) to all specifications (LDV). Finally, standard errors are clustered by cantons.
Empirical tests
In this section, we examine our expectations. All models that we employ can be described by the following equation:
 $$\Delta {y_{i,t}} = {\beta _{LDV}}{y_{i,t - 1}} + \beta {X_{i,t}} + {\alpha _i} + {\gamma _t} + {\varepsilon _{i,t}},$$
whereas
 $${\alpha _i}$$
are unit FE,
 $${\gamma _t}$$
are time FE and
 $${\varepsilon _{i,t}}$$
is a normally distributed error term. Our main independent variables as well as our control variables are captured by the stacked matrix
 $${X_{i,t}}$$
with a vector of coefficients
 $$\beta $$
. This specification helps to isolate the relationship between cantonal spending and the institutional setting. To shield against spurious correlations due to common trends, we add unit as well as time FE. General levelling effects are absorbed by lagged per capita spending
 $${\beta _{LDV}}{y_{i,t - 1}}$$
.
Footnote 11
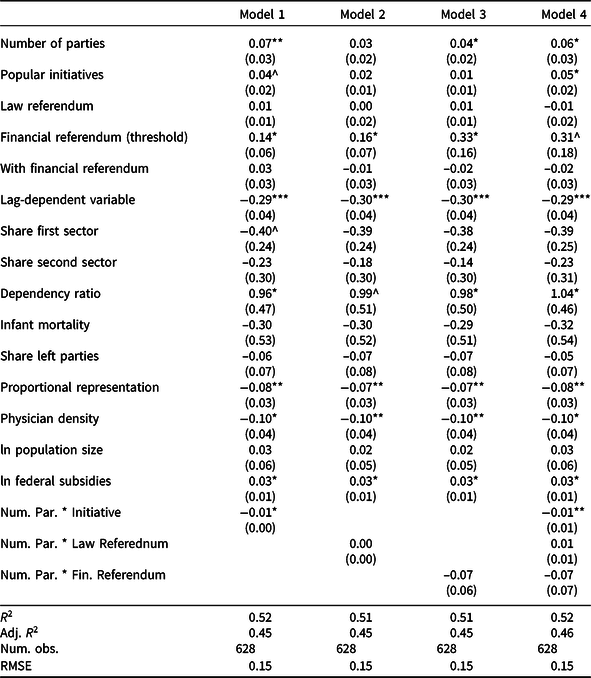
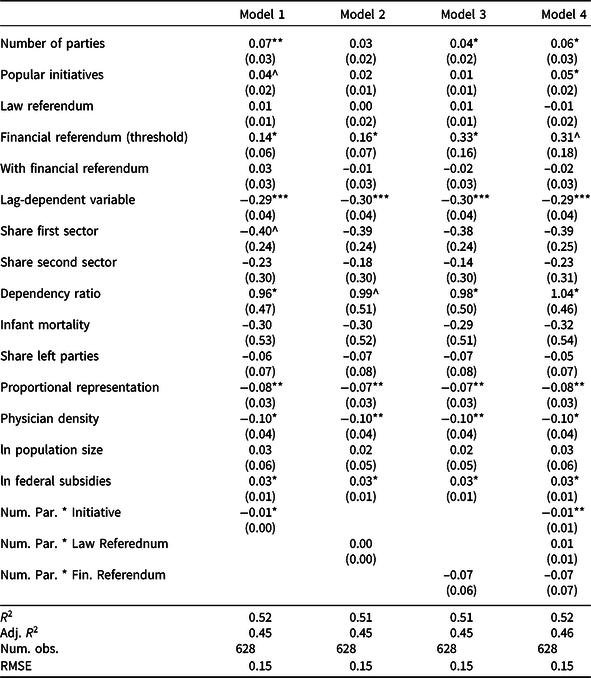
Model 1 in Table 1 includes all variables as well as the interaction of the popular initiative with the number of parties in government. In Model 2, the interaction is set up with the law referendum. Model 3 looks at the interaction with the financial referendum. Finally, Model 4 includes all three interactions simultaneously. The findings are consistent across all specifications displayed in Table 1.
Direct democracy and government spending, 1860–2015
***p < 0.001, **p < 0.01, *p < 0.05, ^p < 0.1.
Three observations can be made based on Table 1. First, there is clear empirical support for the argument that the association of popular initiatives and public spending is dependent on the number of parties in government. When only a few parties are in government, popular initiatives have a positive effect on public spending, but this positive effect becomes weaker as the number of parties in government increases. Second, we cannot observe any statistically significant relationship between law referendums, coalition size and public spending. Third, the models suggest that the effect of financial referendums is not dependent on the number of parties in government. In all models, the association is significant with the expected (positive) sign, whereas the interaction terms in Models 3 and 4 do not reach conventional levels of statistical significance.
In the appendix, we present a number of robustness checks in Sect. 6.4 in supplementary material. We reestimate the same models but also include the small citizen assembly cantons in Table 6 in supplementary material. The inclusion of these small cantons – which also have very extensive direct democratic rights – does not alter the substantive results. In Table 7 in supplementary material, we drop the highly urbanised cantons Basel and Geneva from our sample. In addition, we exclude all observations for Neuchâtel after 1970 (see Table 8 in supplementary material) because the canton displays unusually high values for the financial referendum (see Figure 3). These additional model specifications yield substantively identical results. Put differently, the estimation results are in line with the results presented here.
In addition, we also explore whether these estimates are stable over 155 years or whether there is any temporality to them (Matsusaka Reference Matsusaka2004). Below, we show that these results remain stable in the face of three independent modelling strategies, all aimed at uncovering temporal change in the estimates. However, first, we take a closer look at the interaction terms.
Interaction terms
We now turn to the interpretation of the interaction terms. In this section, we focus on illustrating the short-run effects of direct democratic institutions for different coalition sizes. Our discussion of the magnitude of the long-run effects under different scenarios can be found in the appendix (Sect. 6.5 in supplementary material).
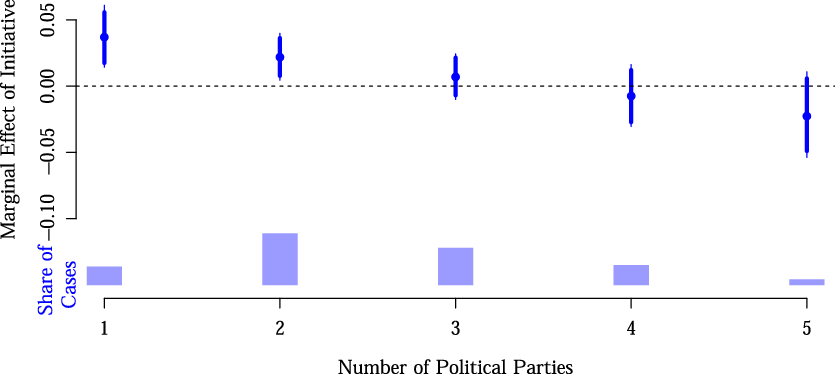
We first examine the effect of popular initiatives. Across all specifications presented in Table 1, we find a conditional effect of popular initiatives on public spending. Figure 4 displays the marginal effect of popular initiatives conditional on the number of parties in government. We find that for small governments consisting of only one or two parties, there is a positive marginal effect for the popular initiative. This positive effect turns negative as the number of parties in government increases. This result is in line with our theoretical argument.
Marginal effect of popular initiatives. Note: Based on estimates from Model 4. Simulated marginal effect with 90 and 95% confidence intervals.
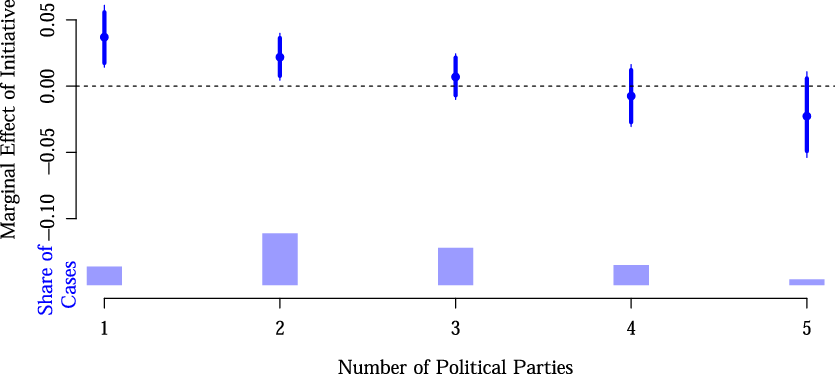
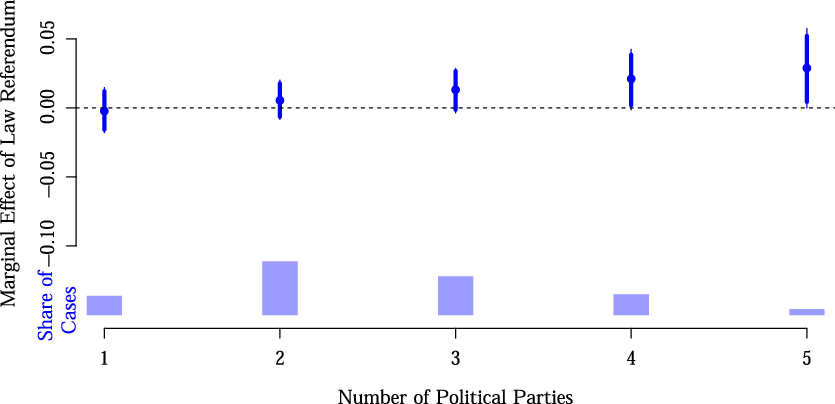
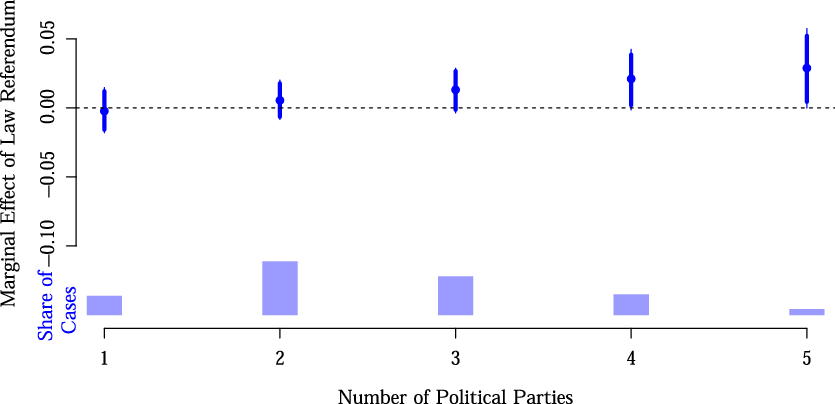
Figure 5 displays the marginal effect of law referendums conditional on coalition size. The marginal effect increases for larger coalitions. Interestingly, the effect is significant for large coalition governments. These results provide some limited support to the argument that in anticipation of law referendums, governments try to foster large bill-specific coalitions, which in turn are linked to higher spending.
Marginal effect of law referendums. Note: Based on estimates from Model 4. Simulated marginal effect with 90 and 95% confidence intervals.
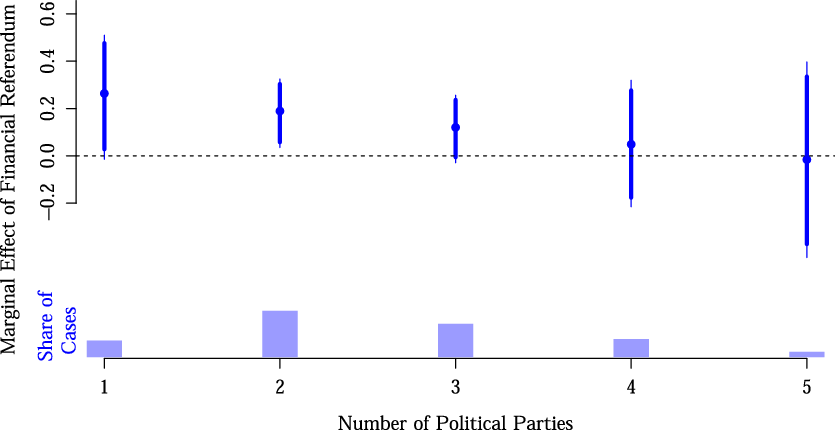
Finally, Figure 6 displays the marginal effect of financial referendums conditional on coalition size. The marginal effect appears to be decreasing, but the interaction parameter is not distinguishable from 0. In addition, the marginal effect is straddling the threshold for significance. In the case of two-party coalition governments, the effect is significantly different from zero. Together with the results displayed in Table 1, this finding suggests that financial referendums are linked to lower public spending, which is consistent with our theoretical expectations (remember that we examine the monetary threshold triggering a referendum). However, we do not find strong evidence that the effect of financial referendums is conditional on coalition size.
Marginal effect of financial referendums. Note: Based on estimates from Model 4. Simulated marginal effect with 90 and 95% confidence intervals.

Error correction models have a dynamic component. Yet, the shown estimates, as well as the visualisations of the interaction terms, display only the short-run effects. In the appendix, we, therefore, discuss the long-run effects of all direct democratic instruments (see Sect. 6.5 in supplementary material).
Stability over time
Analysing data over more than 150 years immediately leads to the question of whether these estimates are stable over time or whether one is missing part of the historical processes by imposing a too strict model specification (Wawro and Katznelson Reference Wawro and Katznelson2014). The models presented so far all rely on fixed parameters over time, thus assuming that the effect of direct democratic institutions remained stable over time. At first, this might seem like a heroic assumption, but it is in line with what we typically assume when we analyse the effects of electoral rules on strategic behaviour (cf. Cox Reference Cox1997).
However, rather than just asserting this point, we also conduct a number of empirical tests that are likely to show if these effects vary over time. In total, we employ three different strategies to show this overtime stability. First, we explicitly interact explanatory factors with time variables (and the square thereof) to allow for different functional forms. Second, we estimate the model only on slices of the data and test whether estimates on early data are different from estimates on later data (Egger et al. Reference Egger, Nigai and Strecker2019). Finally, we use hierarchical models and model parameters as random effects and inspect how their time disturbances cluster (Wawro and Katznelson Reference Wawro and Katznelson2014).
Interacting with year variable
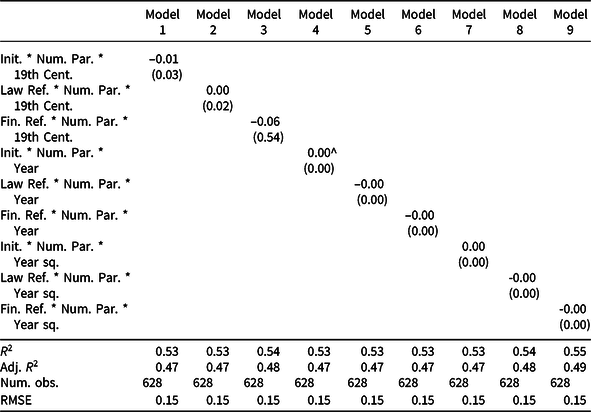
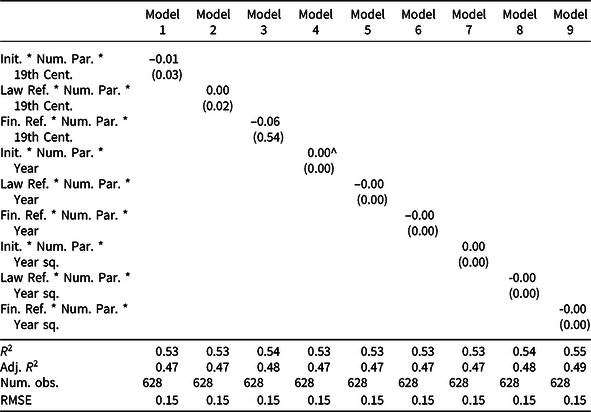
In the first step, we interact the interaction terms of the baseline specification in Model 4 with a binary indicator for the 19th century. This simple test should allow us to see if there is any difference between the 19th and the 20th centuries. As an alternative and more flexible approach, we also interact the term with the year and in subsequent models with squared years.
None of these interactions with century dummies, years or years squared are significant (see Table 2). There is thus no indication that the effects vary over time. While this is a somewhat restrictive approach, as we impose a clear functional form, we also present two more flexible approaches in the next two subsections.
Temporal heterogeneity tests (controls and constitutive terms omitted)
***p < 0.001, **p < 0.01, *p < 0.05, ^p < 0.1.
Differences between periods
Following Egger et al. (Reference Egger, Nigai and Strecker2019), we divide data into different folds and test whether the parameter estimates are different. We split the time up into an early and into a late period. We then reestimate Model 4 from Table 1 on both folds and compare the two estimates for the interaction term (delivering
 $${\hat \beta _{int,{\rm{early}}\,{\rm{fold}}}}$$
and
 $${\hat \beta _{int,{\rm{late}}\,{\rm{fold}}}}$$
). In the second step, we test whether these two parameters are different from each other. We repeat these two steps while moving the cut-off between early and late periods from 1880 up to 2000, each time moving ten years forward per step.
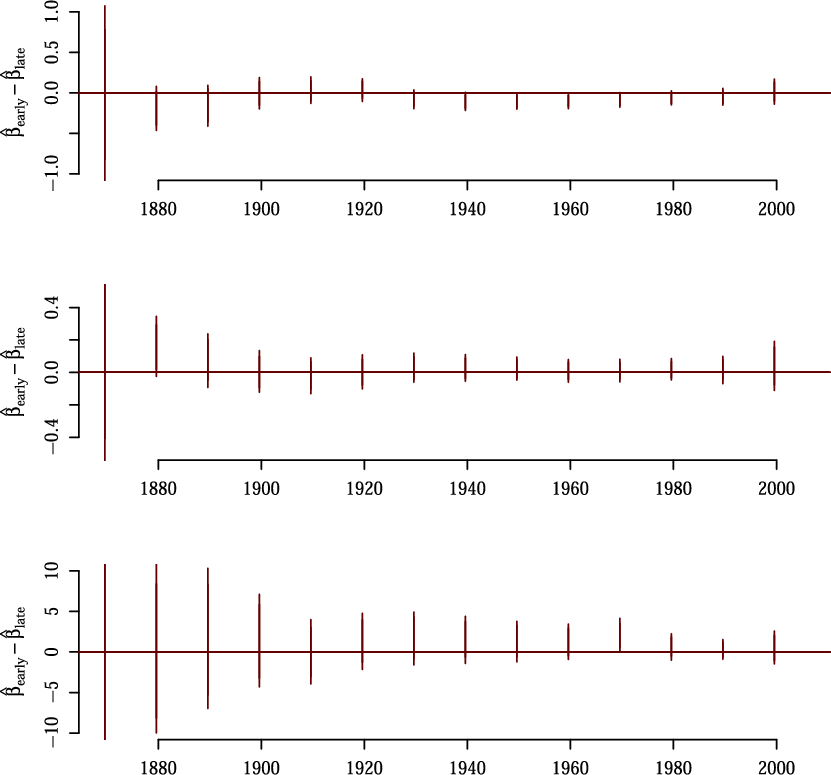
For all three interactions, we analyse whether there are any differences between estimates based on early folds and late folds. The results of this explorative exercise are displayed in Figure 7. The top panel shows the results for popular initiatives, the middle panel shows the results for law referendums and the bottom panel shows the results for financial referendums. Across all three panels, there is no clear evidence that the mechanism changes considerably over time.
Overtime stability. Note: Top panel: popular initiative; middle panel: law referendum; bottom panel: financial referendum. The cut-off year (separating early and late fold) is shown on the x-axis. For each test, we take 1,000 draws from the posterior vector and then compare the two draws. The figure shows the 95 and the 99% confidence interval of the difference of the two coefficients (early versus late fold).
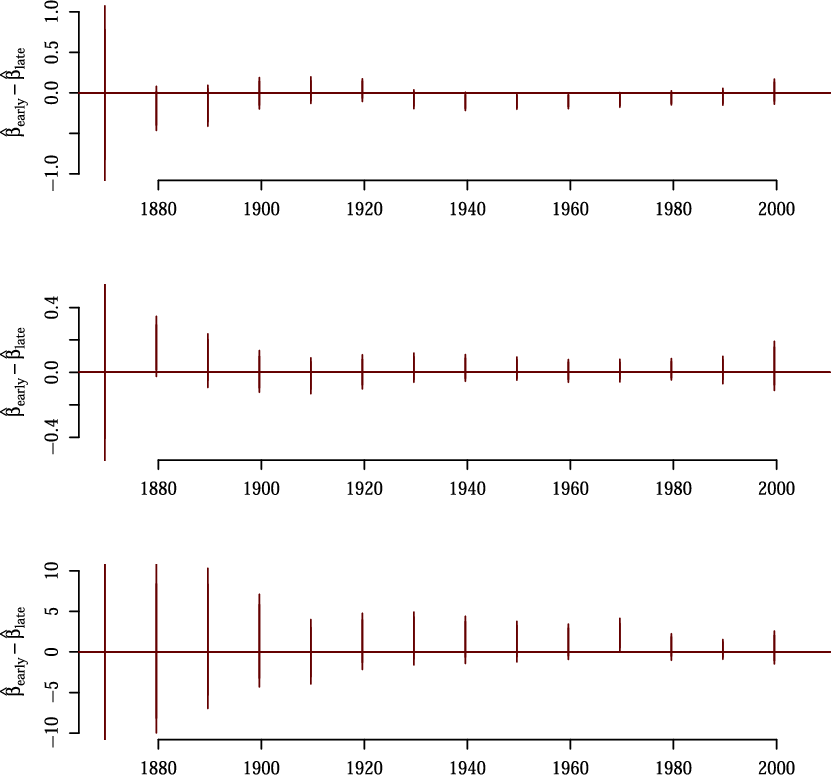
For the initiative, there might be a difference depending on the applied
 $$\alpha $$
level threshold. However, as soon as we exclude the three WWII time periods, no single comparison is significant (see Sect. 6.6 in the appendix in supplementary material). From this second approach, which is less restrictive than the first one, we take that there is no empirical evidence that these mechanisms change over time. We move next to an alternative nonrestrictive approach, where we try to impose a less functional form.
Random coefficient modelling
Our final test for stability builds on a hierarchical modelling strategy, where we include the relevant parameters as random effects. Following Wawro and Katznelson (Reference Wawro and Katznelson2014), we use a hierarchical modelling approach to see if there is a temporal drift in the disturbance estimates of the relevant parameters. Specifically, rather than estimating the interaction term as a fixed
 $${\beta _{int}}$$
, we model it as a random coefficient
 $$\beta _{int}^*$$
, whereas
 $$\beta _{int,t}^* = \beta _{int,t}^0 + {\nu _t}$$
and
 $${\nu _t}$$
follows a normal distribution with mean 0 and a variance that is estimated by the model.
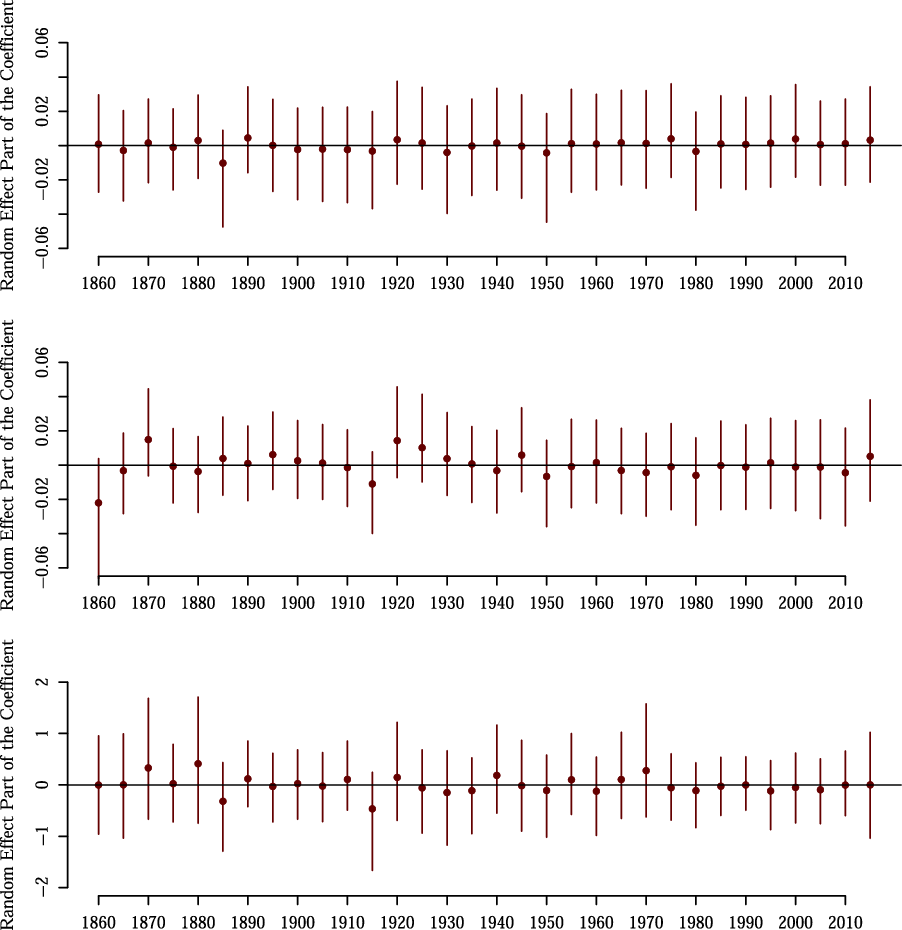
Figure 8 shows the realisation of the random component of the random coefficient of the interaction term for the three institutions. The top panel shows the effects for popular initiatives, the middle panel for law referendums and the bottom panel for financial referendums. We see neither any shock nor any drift over time.
Overtime stability in random shocks to parameters. Note: Top panel: initiative; middle panel: law referendum; bottom panel: financial referendum. Plot shows realisation of random component of the interaction term when estimated as a hierarchical model using the BRMS package (Bürkner Reference Bürkner2018).

In this section, we have provided three tests on whether the main findings of this article change over time. We have employed three different strategies that vary in how much the model imposes on the data. None of these tests indicates that there is a change over time. The observed effects remain stable from the mid-19th century over the 20th century into the 21st one.
Conclusion
How do direct democratic institutions affect public spending? In this article, we have tried to contribute to this literature in two ways. First, we have explored how three direct democratic institutions (popular initiatives, law referendums and financial referendums) interact with a specific aspect of the representative system, the size of the governing coalition, to influence public spending. Second, based on newly collected data, we have examined this relationship between three different direct democratic institutions, coalition size and public spending over the period from 1860 to 2015.
This article thus takes into account the diversity of direct democratic institutions and acknowledges that they do not operate in a vacuum but within a representative system that may condition the effect of direct democratic institutions. While we have only focused on the institutionalised rules of direct democracy instead of their actual use, previous research has shown that lower economic costs are strongly linked to a higher frequency of initiatives and referendums (Leemann Reference Leemann2015; Asatryan Reference Asatryan2016).
Our results show that the effect of popular initiatives depends on the size of the governing coalition. In the case of small coalitions, extensive initiative rights are linked to higher public spending. However, this positive effect on public spending disappears as coalition size increases. In addition, we find that financial referendums are linked to lower public spending, which – contrary to our theoretical expectations – does not seem to be affected by coalition size. In contrast, we find no negative effect of law referendums on public spending. If anything, law referendums seem to have a positive effect on public spending, which grows with coalition size, although the effect is significantly different from zero only for large coalition governments. The reason for this possibly surprising finding can be found in anticipation effects. Law referendums operate as a sword of Damocles, which forces governments to forge oversized bill-specific coalitions to avoid defeat at the ballot box (Neidhart Reference Neidhart1970). As governments try to accommodate the policy preferences of groups capable of launching a law referendum, spending is likely to increase – in particular, if the resulting bill-specific coalition consists of a large number of small groups with homogeneous preferences, which are capable of externalising costs to a larger share of the population (Bawn and Rosenbluth Reference Bawn and Rosenbluth2006).
Finally, we find that the interaction between coalition size and direct democratic institutions does not change over time and, therefore, persists in a number of different socio-economic and political contexts. Apart from different levels of economic development, Swiss cantons started out with limited male suffrage and majoritarian electoral systems and switched to proportional representation and universal suffrage over the last two centuries. As a result, we are confident that our results will also hold in other contexts beyond the Swiss cantons.
In sum, these heterogeneous effects demonstrate that when studying the relationship between direct democracy and public spending, researchers have to be attentive to differences between direct democratic institutions and take into account their embeddedness in the representative system (cf. Hug Reference Hug2009). Yet, certainly, more research is needed to understand which features of the representative system matter and how these different features relate to each other when moderating the effect of direct democratic institutions on public spending. In addition, future research should investigate how the use of direct democratic institutions alters the composition of governing coalitions and the design of policies in detail. For instance, under what conditions do direct democratic institutions help to integrate minority interests in the policy process? To answer such questions, the interaction between representative institutions and direct democracy must be examined at the micro level.
Supplementary material
To view supplementary material for this article, please visit https://doi.org/10.1017/S0143814X20000306
Acknowledgements
We are grateful to Lucy Barnes, the session organisers and participants at international conferences for their valuable comments. In addition, we thank the reviewers and the editor for their feedback and suggestions. Finally, we thank Nadine Golinelli, Anja Guidici, Ruben Hackler, Katharina Klung, Stefan Sandmeier, Julia Sifringer, Chiara Valsangiacomo, Linda Wanklin and Sylvain Wenger for their research assistance. This research is being generously supported by the Swiss National Science Foundation (grant #:100017_184969).
Data Availability Statement
Replication materials are available in the Journal of Public Policy Dataverse at https://doi.org/10.7910/DVN/SRWSDP.