Introduction
There is still much to be known about the mechanisms of bilingual language activation. Lexical activation and selection for monolinguals is considered to be a sequential process that activates words that share similar phonological features (Luce & Pisoni, Reference Luce and Pisoni1998; Marslen-Wilson, Reference Marslen-Wilson1987; Vitevitch, Reference Vitevitch2002). For example, words like dry and drive might be co-activated because they share /draj-/ onset features. Vitevitch, Chan and Goldstein (Reference Vitevitch, Chan and Goldstein2014) have explained this process by applying network science to lexical systems: the lexicon is a network made up of nodes of words and connections between those nodes. The connections between nodes represent relationships based on certain linguistic features (e.g., semantics, phonology). These connections also have an important weighting characteristic such that some words allow stronger connections than others, which may account for inhibition or facilitation during lexical selection. Selection of words can be weighted based on the strengths of their representations, which might be influenced by frequency of input (Jescheniak & Levelt, Reference Jescheniak and Levelt1994; Rice, Oetting, Marquis, Bode & Pae, Reference Rice, Oetting, Marquis, Bode and Pae1994), clustering (Vitevitch et al., Reference Vitevitch, Chan and Goldstein2014), or contextual top-down processing (Wise, Chollet, Hadar, Friston, Hoffner & Frackowiak, Reference Wise, Chollet, Hadar, Friston, Hoffner and Frackowiak1991). Although the monolingual network may be intuitive, the bilingual network might be organized differently.
There have been four major perspectives regarding the organization of the bilingual language network. These models are differentiated by language selectivity and separability of language-specific lexicons (see Van Heuven, Dijkstra & Grainger, Reference Van Heuven, Dijkstra and Grainger1998 for discussion). The earliest instantiation of the bilingual lexicon described bilingual word recognition as using an input switch that allocated language-specific information to independent native and second language lexicons (Costa, Reference Costa, Kroll and De Groot2005; Macnamara & Kushnir, Reference Macnamara and Kushnir1971; Gerard & Scarborough, Reference Gerard and Scarborough1989; Scarborough, Gerard & Cortese, Reference Scarborough, Gerard and Cortese1984; Soares & Grosjean, Reference Soares and Grosjean1984). That is, input is exhaustively matched to all of the lexical items in one lexicon before searching the second lexicon. A functionally similar model has also been proposed insofar as the lexicons are integrated, but the exhaustive language-specific search remains, due to the language selectivity mechanism. During the turn of the century, a large body of research propagated a shift to a non-selective view of the lexicon that has persisted until present day (Dijkstra & Van Heuven, Reference Dijkstra and Heuven1998, Reference Dijkstra and Van Heuven2002; Dijkstra, Grainger & Van Heuven, Reference Dijkstra, Grainger and Heuven1999; Jared & Kroll, Reference Jared and Kroll2001; Kroll, Bobb & Wodniecka, Reference Kroll, Bobb and Wodniecka2006; Zhou, Chen, Yang & Dunlap, Reference Zhou, Chen, Yang and Dunlap2010; inter alia). That is, any given input will activate lexical items in both native and second language lexicons. However, these nonselective models differ in their structure. The non-selective view of independent lexicons suggests that words are activated by any given input, but the search for a matching word happens in one lexicon before searching the other. A plethora of evidence, however, suggests that a more appropriate model of bilingual word recognition is instantiated in a nonselective, integrated design such that words in both languages are compared (Dijkstra & Van Heuven, Reference Dijkstra and Van Heuven2002; Marian & Spivey, Reference Marian and Spivey2003; Spivey & Marian, Reference Spivey and Marian1999; Van Heuven et al., Reference Van Heuven, Dijkstra and Grainger1998).
An integrated and nonselective lexicon allows for parallel language activation such that the spread of activation during lexical selection activates words in both languages simultaneously (Kroll & de Groot, Reference Kroll and Groot2005). Previous work on two spoken languages that differ in form have found parallel language activation. Chinese–English bilinguals, who have different orthographic scripts across their L1 and L2, made semantic relatedness judgments on visually presented English words (Thierry & Wu, Reference Thierry and Wu2004). The bilinguals showed delayed reaction time latencies, decreased accuracy, and a reduced N400 component compared to monolingual English speakers for semantically unrelated words (e.g., novel–violin) that shared a Chinese character when translated. Similar evidence was found for words that overlapped in Chinese phonology (Wu & Thierry, Reference Wu and Thierry2010) and during auditory language comprehension (Thierry & Wu, Reference Thierry and Wu2007). These studies provide evidence for parallel language activation for languages that diverge in form, but are within the same modality. Parallel language activation for languages divergent in both form and modality has also been found in bimodal bilinguals (Morford, Wilkinson, Villwock, Pinar & Kroll, Reference Morford, Wilkinson, Villwock, Piñar and Kroll2011; Shook & Marian, Reference Shook and Marian2012).
Nonselective integrative models of bilingualism are also applicable to speech–sign bilinguals. Bimodal bilinguals, or hearing native signers, have been shown to produce ASL signs that are semantically related to the English words within the matrix clause while performing a narrative task (Emmorey, Borinstein, Thompson & Gollan, Reference Emmorey, Borinstein, Thompson and Gollan2008). In a picture-naming task, Dutch–Sign Language of the Netherlands bilinguals showed slower responses in identification of pictures that represented phonologically related signs, but were unrelated in Dutch (Van Hell, Ormel, Van der Loop & Hermans, Reference Van Hell, Ormel, Van der Loop and Hermans2009). Slower responses suggest speech–sign bimodal bilinguals organize their sign lexicon not only by semantic information, but also by phonological information such that there is parallel activation of both languages.
A related study investigated parallel language activation of sign translation during word recognition in deaf ASL–English bilinguals (Morford et al., Reference Morford, Wilkinson, Villwock, Piñar and Kroll2011). Participants completed a semantic relatedness judgment task of two sequentially presented English words. The results indicated slower rejection of English items that were underlyingly phonologically related (and semantically unrelated) in ASL (e.g., cheese and paper). Thus, the authors concluded that proficient ASL–English bilinguals activate sign translations during English word recognition. Therefore, despite modality differences, both English and ASL are simultaneously active during a language-specific task. Morford et al. additionally questioned the role of proficiency and phonological parameters in the activation of sign translation.
Shook and Marian (Reference Shook and Marian2012) also attempted to delineate similar parallel language activation in English–ASL bimodal bilinguals using eye-tracking in a cross-modal visual-world paradigm. Participants heard the carrier phrase “click on the ___.” They saw a four alternative choice paradigm with images. These images contained two distractors and two phonologically related words in ASL. For example, in ASL, cheese and paper are phonologically related, but in English phonology, they are not. The authors predicted longer and more looks to the competitor picture of paper when the participants were told to “click on the cheese.” This was predicted based on the hypothesis that both languages are simultaneously activated. Indeed, Shook and Marian (Reference Shook and Marian2012) found that there were longer and more looks to the competitor in the ASL phonologically related words, despite the input language being spoken English. The authors then proposed a new model adapted from the Bilingual Interactive Activation Plus (BIA+) model for cross-modal languages. Their new model included lateral links at the lexical level because English and ASL do not share phonological properties; in contrast, other models assume phonological links for within-modality languages (Dijkstra & Van Heuven, Reference Dijkstra and Van Heuven2002). Shook and Marian's model (Reference Shook and Marian2012) also provided the first step towards understanding how bimodal language activation might occur.
The present study builds upon the Morford et al. (Reference Morford, Wilkinson, Villwock, Piñar and Kroll2011) and Shook and Marian (Reference Shook and Marian2012) studies to delineate the dynamics of lexical activation in hearing English–ASL bilinguals. Given that in both previous studies parallel language activation was found, our study attempted to replicate parallel language activation in English–ASL bimodal bilinguals and extend our understanding of cross-language lexical activation. In other words, the present study investigated how spoken and sign phonological relationships among English and ASL lexical items influence their co-activation. This novel extension is expected to further characterize parallel language activation in speech–sign bilinguals. In particular, there is still the outstanding question as to how phonological parameters in sign language influence the spread of activation.
Effects of ASL Phonological Parameters
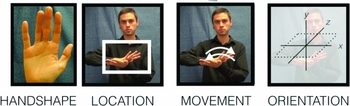
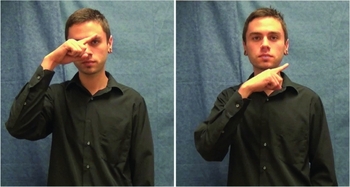
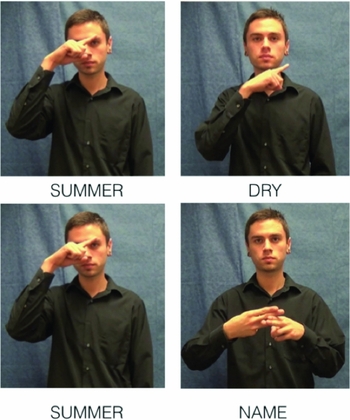
Spoken-language phonetics relies on place of articulation, manner of articulation, and voicing. These are emergent phenomena based on the articulators producing the sounds (Hayes, Reference Hayes2011). However, sign languages are produced via different articulators. Thus, it would follow that the phonetic and phonological realizations would be different. ASL phonology is described using handshape, movement, location and orientation features (or parameters; see Brentari [Reference Brentari1998] for a detailed explanation). Handshape is the configuration and the selected fingers of the articulating hand. Movement is the directionality and articulation of the hands during sign production. Location is the place on the body where the sign is being articulated. Orientation is the plane (i.e., x, y or z) of articulation used for sign production. Figure 1 provides examples for the sign cheese. These four parameters come together to make signs arbitrarily distinct from one another. Just as there are minimal pairs in spoken language (e.g., /baet/ and /paet/) such that one phoneme is contrastive and separates lexical representations, similar phenomena occur in ASL. For example, the signs summer and dry (Figure 2, Hildebrant & Corina, Reference Hildebrandt and Corina2002) are contrastive pairs because they differ by the location parameter, but share the handshape, movement, and orientation parameters.
shows the four phonological parameters (Brentari, Reference Brentari1998) for cheese.

Phonological contrasts of location in summer (left) and dry (right).

Unlike the monolingual model for spoken languages in which incoming featural information is sequential, sign phonological features are represented at once. The characteristics of the features differentially affect lexical activation. Specifically, native deaf monolingual signers activate the cohort of lexical items based on the handshape and location features; subsequently the lexical item will be selected based on the movement feature (Carreiras, Gutiérrez-Sigut, Baquero & Corina, Reference Carreiras, Gutiérrez-Sigut, Baquero and Corina2008; Caselli & Cohen-Goldberg, Reference Caselli and Cohen-Goldberg2014; Corina & Knapp, Reference Corina and Knapp2006; Emmorey & Corina, Reference Emmorey and Corina1990). The activation of lexical items may be dependent on their psycholinguistic importance as a function of sign proficiency.
Language experience influences the perception and processing of sign features. Deaf signers perceive phonemic handshape contrasts, but not location contrasts, as categorical (Emmorey, McCullough & Brentari, Reference Emmorey, McCullough and Brentari2003). Differences in categorization across phonological parameters (i.e., handshape versus location) may be due to phonological rules, graded locations of articulation, and perceptual variability. Morford and colleagues (Morford, Grieve-Smith, MacFarlane, Staley & Waters, Reference Morford, Grieve-Smith, MacFarlane, Staley and Waters2008) have investigated phonological parameter identification and categorization in nonnative second language (L2) learners of ASL, both deaf and hearing. They found that earlier exposure to ASL allows for better processing of handshape, but sign discrimination did not differ across groups. Similarly to Emmorey et al. (Reference Emmorey, McCullough and Brentari2003), sign contrasts are highly perceptual, but there are categorization differences for those who are aware of the language statistics. Importantly, Morford and Carlson (Reference Morford and Carlson2011) showed that the inability to rapidly process handshape leads to over-reliance on handshape information, delaying sign recognition in a gating task. Their finding suggests that certain phonological parameters vary in both psycholinguistic importance and perceptual saliency and might differentially affect lexical activation across learners of various proficiencies. Thus, this study aims to investigate the influence of these phonological parameters on lexical activation.
Effects of Second Language Proficiency
It is also important to understand the processes of second language acquisition and how these might be different from native bimodal bilinguals or end-state second language learners. Previous research has shown that learning a second language is different from being a simultaneous bilingual from birth (e.g., ultimate attainment, Granena & Long, Reference Granena and Long2013), and the pattern of second language acquisition can be characterized by divergent and unique behavior, often referred to as a learner's interlanguage (White, Reference White2000). Recently, researchers have started to treat interlanguages as complex, non-linear systems that can be modeled using Dynamical Systems Theory (de Bot, Lowie & Verspoor, Reference De Bot, Lowie and Verspoor2007; Herdina & Jessner, Reference Herdina and Jessner2002). The main take-away from this perspective is that second language learners change their second language system over time (and not in discrete steps) due to interactions with their first language system as well as sociolinguistic, psychosocial, and cognitive factors, which create non-linearity in behavior. Moreover, a main tenant of this theory is that all language systems share the same space and interact completely. Therefore, this paper will explore the changes in the bimodal lexical system as a function of proficiency to better understand, what we call, interlanguage dynamics. Aggregating subjects into groups based on proficiency often diminishes the study of interlanguage dynamics. Second language acquisition studies often prescribe phenomena to a group of individuals based on their collective proficiency (Gass, Reference Gass2013). The current study takes a slightly different approach. Instead of aggregating participants into dichotomous proficiency groups, the current study uses correlational analyses to capture lexical activation as a function of proficiency. Although a correlational analysis does not approach the granularity of longitudinal designs in terms of describing interlanguage dynamics, correlational analyses do provide more detail about the activation of a lexical item by an individual instead of a group. To this end, we are able to provide a more detailed picture of parallel language activation in bimodal bilinguals.
Research Questions
The current study attempts to explicate parallel language activation in speech–sign bimodal bilinguals. The present study considers the effects of interlanguage dynamics on lexical activation to expand previous models of bimodal bilingualism. The current study aims to characterize the constraints on cross-modal L2 activation in terms of lexical node distance and identify whether there is spread of activation across multiple featural and lexical nodes in the lexicon. By investigating the details of the lexical activation in speech–sign bimodal bilinguals, we can expand our current understanding of parallel bimodal language activation and further delineate the structure of the bimodal bilingual lexicon.
This study implemented a cross-modal priming paradigm. Participants heard an English word whose neighbor was the sign target. Spreading of activation to a sign target provides information about the activation of lexical units based on featural input in both L1 and L2. It was predicted that activation of the heard English word would spread to related English words and then to their identity signs (the ASL translation). Therefore, ASL signs were predicted to be primed by related English words. The sign neighbors of the sign target words were also investigated to determine whether the ASL lexical nodes further spread activation within the L2 ASL network, converting featural information from one modality to another. Also, unlike previous studies, this study examined the interlanguage dynamics or the effects on the network as a function of language proficiency. A correlational design does not afford fine-grained analysis of the changes in the lexical network in the same way that a longitudinal design does; however, using proficiency as a continuous variable allows for the examination of effects across multiple time points during acquisition instead of two arbitrary points (cf. cross-sectional designs). Finally, it was important to understand exactly how sign phonology impacts lexical activation. Since there is evidence that nonnative learners over-rely on handshape information (Morford & Carlson, Reference Morford and Carlson2011), it is important to know whether there are greater connections and spread of activation to words that are related by handshape as compared to other sign phonological parameters. We investigated phonological interactions with AX discrimination and a metalinguistic phoneme categorization task. Participants judged sign pairs as similar or different and later categorized the differing phonological parameter (i.e., handshape, location, or movement) for each pair.
Experimental Section
Participants
Data were collected from 19 participants (3 male). The participants ranged from 20 to 24 years old (mean = 21.36, SD = 1.09). There were 17 right-handed participants. The participant group was made up of students recruited from Intermediate I and II (3rd and 4th semesters, respectively) American Sign Language (ASL) courses at Indiana University. All participants were native English speakers with no history of neurological, speech, language or hearing disorders. On average, the participants reported to have been exposed to ASL for 6.13 years. All participants gave written informed consent approved by the Indiana University Institutional Review Board.
ASL Proficiency
Learners rated their ASL ability on a questionnaire provided by the experimenter. The participants were asked: “Please circle the number that best represents your proficiency for ASL, English, and any other languages listed.” The ratings ranged from 1 to 7 (1 = “Almost None,” 2 = “Very Poor,” 3 = “Fair,” 4 = “Functional,” 5 = “Good,” 6 = “Very Good,” 7 = “Like Native”). Their scores ranged from 3 to 7 (M = 4.71, SD = 0.977). All scores for English were rated as 7.
ASL ability was also measured using a Fingerspelling Reproduction Task (FRT) developed by the VL2 Center at Gallaudet University. A total number of words and pseudowords correctly reproduced using fingerspelling was collected. The scores ranged from 20 to 64 (M = 40.31, SD = 13.11; out of 70).
Using these data, an equation computed the average standard score as a proportion of self-rating and correct responses on the FRT, and then the score was weighted by his or her overall discrimination accuracy on the AX task (see Experiment 2 for results). A composite ASL score (P) was acquired using this equation:
Composite proficiency score equation.

The proficiency scores ranged from 0 to 1 (and can be converted to percentages, if desired). A composite of 0 indicated a naïve signer, 0.5 roughly indicated an intermediate learner, and 1 indicated a near-native signer. Composite proficiency scores ranged from 0.31 to 0.88 (M = 0.554, SD = 0.144). We contend the composite proficiency score is a representational measure of ASL ability because it takes into account self-perceived ability, performance on a standardized task using production (i.e., FRT), and performance on an assessment of ASL phonology perception (i.e., AX). Furthermore, the P score correlates well with duration of use (r = 0.675, p = 0.002) and proportion of use (r = 0.668, p = 0.02) of ASL by these learners. High correlations suggest that this score measures proficiency as a function of the amount of input and learning. Furthermore, there is a positive correlation with accuracy in the AX task (see Experiment 2) and correct rejection of pseudosigns in the lexical decision task (see Experiment 1) such that more proficient L2 ASL individuals, as defined by this measure, are better at distinguishing a real from a fake sign (r = 0.489, p = 0.033). Together these data suggest that our measure for ASL proficiency adequately describes our learners.
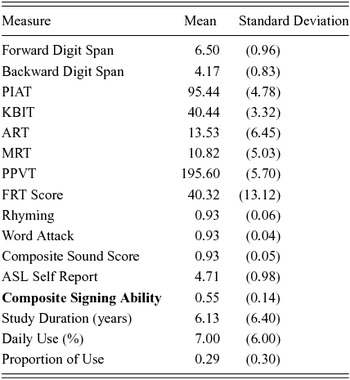
Finally, because this is a cross-modal rhyming study, it is important to understand each participant's ability to make rhyming judgments. Sound awareness measures were taken from the Woodcock-Johnson III. The subtests selected for this study were the Rhyming and Word Attack sub-scores. An average composite score for these two subtests based on the individual subtest raw scores were computed. Composite sound awareness scores ranged from 0.80 to 0.98 (M = 0.928, SD = 0.045). See Table 1 for a complete matrix of measured scores.
Group Characteristics on Test Battery

Table 1 shows complete characteristics of learners for the test battery on language and memory tasks. Note composite signing ability as the proficiency measure in the present study.
Signer and Speaker
A hearing bimodal bilingual spoke the aural primes and signed the ASL targets. The bimodal bilingual was born hearing to deaf parents (i.e., a CODA). He reported that his first language was ASL and his second language was English, although both languages were learned at relatively the same time. He was 21 years old. He reported that he mostly used English, but still signs with his parents and friends.
Overall Procedure
The study was composed of two tasks, a primed lexical decision task and an AX task. The measures and experiments were counterbalanced such that no two experiments or language measures that occurred back-to-back were in the same language. To prevent within-language and within-modality priming across tasks as well as to prevent the development of overt strategies, the AX task was always given after the priming task.
Experiment 1: Cross-Modal Rhyme Priming
Method
Stimuli
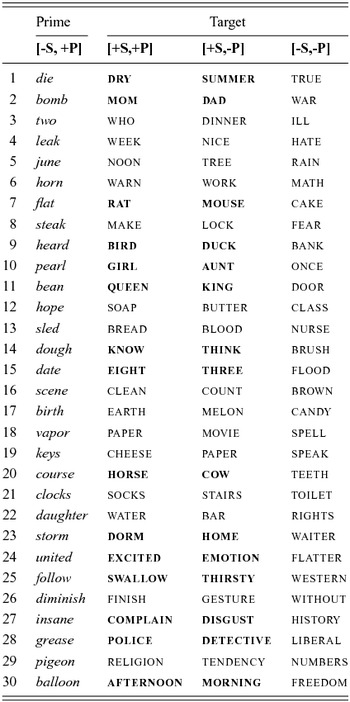
There were 30 aural primes and 180 sign targets (see Appendix). Targets were split in half between real ASL signs and pseudosigns. The aural primes were recorded with a sampling rate of 44,100 at 16 bits per second. The average duration of the audio clips was 487 ms (SD = 65 ms). The stimuli were signed in front of a Sony HDR-CX220 Progressive Digital Video Camera Recorder. The video clips were cropped to one frame before the signer lifted his hands to produce the sign and one frame after his arms came to a rest at his side to indicate the post-sign production period. The average duration of the video clips was 2500 milliseconds (SD = 500 ms). An analysis of variance indicated that the video lengths did not significantly differ across conditions, F(3,87) = 1.162, p = 0.329, eta-squared = 0.039.
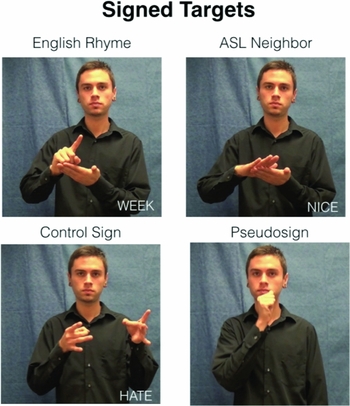
The 180 sign targets were divided into 90 signs and 90 ASL pseudosigns. Among the 90 signs there were 3 conditions: English rhyme, ASL neighbor and ASL control. All of these stimuli were words selected from current Beginner I to Intermediate II ASL textbooks (i.e., 1st to 3rd semester). The English rhyme target was a sign target that was phonologically related to the aural prime, if it were spoken. For example, if the spoken prime was leak, the English rhyme target was the sign week. An ASL neighbor target was selected such that it did not relate semantically or in underlying English phonology to the aural prime (such that no rhyme was created). The English rhyme and ASL neighbor targets were paired such that the pairs were related in ASL phonology. For example, if the English rhyme target was week, then the ASL neighbor target paired with it was the sign nice. The signs week and nice are related in ASL phonology such that they share location and movement features (see Figure 5). This pairing creates a second order neighbor to the prime (e.g., leak → week → nice). Moreover, half of the targets in the English rhyme condition were broadly semantically related to their ASL neighbor pair by association or possible co-occurrence (e.g., English rhyme = queen; ASL neighbor = king; adapted from Morford et al., Reference Morford, Wilkinson, Villwock, Piñar and Kroll2011). However, no targets were semantically related to their prime. This was to gauge spread of activation through the sign network to the second order neighbors via semantic or lateral links.
shows the sign targets used for one auditory prime leak. The sign that underlyingly rhymes with leak is week (i.e. English rhyme). The ASL neighbor to week is nice because it shares ASL phonological parameters. The control sign is hate. The pseudosign was derived from the sign who using the A-handshape.

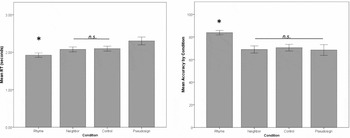
Mean reaction times (left) by condition for the cross-modal priming task. Mean accuracy scores (right) by condition for the cross-modal priming task. Error bars are ± 1 standard deviation.

There was also a control target that had no orthographic, English phonological, or ASL phonological relationship to the prime. Finally, the pseudosign targets were created by taking real ASL signs and changing only the handshape parameter. Creating pseudosigns in this way was motivated by several factors. First, we wanted to have a consistent phonological rule that was used to create the pseudosigns. Second, there is a relatively larger range of alternatives when changing handshapes as compared to other parameters. Finally, we did not want learners to be able to easily reject the pseudosigns based on easy-to-perceive features like location (Bochner, Christie, Hauser & Searls, Reference Bochner, Christie, Hauser and Searls2011; Morford & Carlson, Reference Morford and Carlson2011; Morford et al., Reference Morford, Grieve-Smith, MacFarlane, Staley and Waters2008). Nevertheless, these changes adhered to ASL phonotactic constraints. The bimodal bilingual signer also rated the pseudosigns as nonexistent ASL signs. All prime-target pairs were matched for orthographic similarity, phonological neighborhood size, orthographic neighborhood size, frequency, bigram frequency, and length to ensure that any underlying orthographic codes did not influence lexical retrieval for words in any of the conditions. The primes and targets were not semantically related with the exception of two pairs (i.e., horn–warn in the rhyme condition and bomb-war in the control condition). The same English spoken prime would be leak followed by a signed target. This could be an underlying English rhyme (e.g., week), the ASL neighbor (e.g., nice), a control sign (e.g., hate), or a pseudosign. Figure 4 shows the various targets for an aural prime leak.
Procedure
The experiment was presented on a 13-inch MacBook Pro with i5 processor using PsychoPy software (Peirce, Reference Peirce2007). The participants heard an English word (i.e., the prime), followed by an interstimulus interval of 250 milliseconds and then the ASL target. The participants made a lexical decision to the target by pressing the ‘0’ key with their right index finger for real signs and ‘1’ key with their left index finger for pseudosigns. Reaction times and accuracy scores were recorded.
Results
Reaction times
A one-level repeated measures analysis of variance indicated that there was a significant difference across conditions for mean reaction times [F(3,59) = 12.395, p < 0.001, eta-squared = 0.408]. Participants responded to rhymes quickest (M = 1.923, SD = 0.256), ASL neighbors (M = 2.077, SD = 0.283) similarly to the controls (M = 2.098, SD = 0.285), and pseudosigns the slowest (M = 2.323, SD = 0.4544).
An ANOVA was performed to determine whether there were significant priming differences across conditions, using the control condition as the baseline. There was a significant priming effect of condition [F(1,18) = 15.299, p < 0.001, eta-squared = 0.459]. To tease apart these results, planned ad-hoc paired t-tests were conducted. The critical p-value was Bonferroni corrected to 0.016 to correct for multiple comparisons. T-tests revealed that the rhyme priming condition was significantly faster than the control condition [t(18) = 4.402, p < 0.001]. The ASL neighbor priming condition did not significantly differ from the control condition [t(18) = 0.391, p = 0.701]. The priming effect for the rhyme condition was larger than the ASL neighbor condition [t(18) = 3.911, p < 0.001]. Also, all real-sign conditions were significantly faster than pseudosigns [rhyme = t(18) = 4.581, p < 0.001; neighbor = t(18) = 2.836, p < 0.016; control = t(18) = 3.041, p < 0.016].
Accuracy
Accuracy showed a similar pattern to RT data. There was a significant difference across conditions [F(3,15) = 5.025, p < 0.01]. It is clear from the corrected ad-hoc t-tests, however, that this effect was driven by the rhyming pairs such that the rhyming pairs were significantly different from neighbors [t(18) = 6.404, p < 0.001], controls [t(18) = 5.195, p < 0.001], and pseudosigns [t(18) = 2.773, p < 0.016], but those remaining three conditions were not different from one another [F(2,15) = 0.010, p = 0.924].
Semantics
To determine whether L2 neighbors that were semantically related to nearby neighbors were selected quicker, a one-way analysis of variance was performed. If the semantically related pairs were faster than the unrelated pairs, it would be assumed that spread of activation is driven by semantic connections more so than lateral connections. In our analysis, there was no semantic advantage to lexical computation for L2 neighbors. The semantically-related targets (M = 2.141, SD = 0.309) had similar RTs to those of the unrelated targets (M = 2.141, SD = 0.334) and the difference between them was non-significant [F(1,29) = 0.005, p = 0.995].
Post-hoc parameter activation analysis
To investigate whether one phonological parameter elicits a larger spread of activation to second order ASL words, a post-hoc analysis was conducted. The targets in the English Rhyme and ASL Neighbor conditions were classified based on their phonological relatedness by parameter. Specifically, the featural differences focused on handshape and movement. For example, the trajectory of the activation from daughter to bar is different from the activation from vapor to cheese because activation must move through signs that differ by handshape in the former (i.e., water–bar) and movement in the latter (i.e., cheese–paper). There were 16 pairs differing by handshape and 10 by movement. Averages for handshape and movement related primes were calculated in both the rhyme and the neighbor conditions. Reaction times from the rhyme condition were subtracted from the neighbor condition for each parameter (e.g., RT daughter –bar – RT daughter –water ). Theoretically, this would provide information about how activation spreads from daughter to water and then to bar. It could be the case that there is no significant priming effect in the ASL Neighbor condition because of the weightings that spread activation to other lexical items. If the RT differences were faster for one parameter compared to the other, then that parameter has stronger connections between the target and the neighbor. For example, if the difference between the RTs of pairs that differed by handshape across conditions (e.g., daughter–bar and daughter–water) were smaller than the ones of movement (e.g., vapor–cheese and vapor–paper), then we could posit that handshape spread activation to second order neighbors (e.g., water → bar) quicker than those connected by movement (e.g., paper → cheese). It was hypothesized that since handshape is more salient for L2 learners that it would have faster activation times than movement. This was the case, handshape was much faster (M = 0.0639 s, SE = 0.06 s) than the movement parameter (M = 0.2875 s, SE = 0.06 s) [F(1,15) = 8.403, p < 0.01].
Discussion of Cross-Modal Priming Experiment
The pattern of results confirmed our hypothesis that L1 lexical items can activate and facilitate lexical computation (i.e., lexical activation) for L2 signs. Lexical computation is not only faster, but also more accurate for words that underlyingly rhyme in English. This pattern of results is similar to that of Morford et al. (Reference Morford, Wilkinson, Villwock, Piñar and Kroll2011) insofar as sign translations were activated during spoken word processing to facilitate sign retrieval during a sign lexical decision task. Our second research hypothesis was not confirmed. There were no significant priming effects for L2 neighbors as compared to controls. This might be due to the fact that the rhyme is spreading activation across many nodes within the lexicon, preventing enough activation energy to be propagated to L2 neighbors. It could also be the case that learners do not activate L2 neighbors beyond the parallel sign translation for the spoken prime. In other words, activation only spreads to words with overlapping L1 features and not to words with overlapping features in their L2. This spreading of activation from L1 features to L2 features may change with proficiency and exposure.
Pseudosigns were reliably detected in the L2 learners at 75% accuracy. Although not high, this was impressive given that there were no phonotactic violations that triggered large rejections. High rejection rates suggested that it is not only the phonotactic structure with which learners are concerned, but they can reliably distinguish which words are not in their lexicon. Finally, the spread of activation across the nodes was highly influenced by the handshape parameter compared to movement and it was via lateral connections more so than semantic links.
Experiment 2: AX similarity judgment and phonological parameter identification task
To acquire an accurate description of our learners, an AX discrimination task was implemented. This task was meant to provide an overall assessment of the learners’ abilities to discriminate between phonologically similar and dissimilar signs. Moreover, this task might provide insight into the learners’ level of phonological parameter awareness by analyzing each similar-different pair by parameter.
Stimuli
There were 60 sign pairs. In 30 of the sign pairs, the similar signs were pairs of signs that only differed by one phonological feature (i.e., handshape, movement or location; e.g., summer-dry; Fig. 6 top). The distribution of phonological features was not controlled. The different sign pairs were signs that differed by more than one parameter (e.g., summer-name; Fig. 6 bottom). All words were taken from ASL 1 and 2 textbooks to ensure comprehensibility for all participants.
shows the contrasts for the AX discrimination task. Top row was for similar sign pairs, bottom for dissimilar.

Procedure
The participants were instructed that they would see two signs. Their task was to decide whether the two signs were similar or different. The participants were instructed that the signs would be different by handshape, location, movement, or more than one feature. It was explained what each of these features were, and the participants were given examples. They made the similar-different judgment as quickly as possible by clicking on-screen buttons labeled as either ‘same’ or ‘different.’ Response times and accuracy scores were recorded. The on-screen decision was used to facilitate the ability of participants to make a categorization after their same-different response instead of moving from the keyboard to the mouse. Once they made a similarity judgment, they were able to take as long as they wanted to decide what feature was different between the two signs, because even the similar signs had at least one parameter that was different. They responded by clicking the parameter on the screen, similar to the same-different response. For the difference categorization, participants were able to select from ‘handshape’, ‘location’, ‘movement’ or ‘more than one’. After they confirmed their selection (by clicking a ‘continue’ button), the next same-different trial appeared.
Results
Categorization processing and accuracy
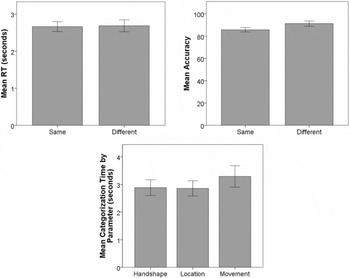
Using a repeated-measures ANOVA, the data showed that there was no difference between similar or different pairs in categorization time [F(1,18) = 0.057, p = 0.815, eta-squared = 0.003] or categorization accuracy [F(1,18) = 3.769, p = 0.068, eta-squared = 0.173]. No interaction of similarity was assessed with each parameter because all different pairs were different by more than one parameter. There was no significant difference in the time needed to process each parameter [F(2,36) = 0.403, p = 0.672, eta-squared = 0.026] (see Figure 7).
shows the categorization time (top, left) for similar and dissimilar signs as well as the accuracy (top, right). The processing times for each parameter are also shown (bottom, center). Error bars are ±1 standard error. There were no significant differences across conditions in either RTs or Accuracy.

Categorization Errors
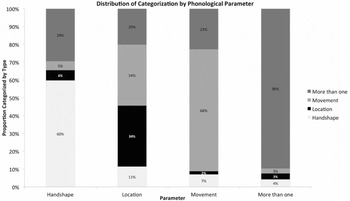
A repeated-measures ANOVA was used to investigate differences in the correct categorization of parameters in the similar condition. There were significant accuracy differences for each parameter (F(2,36) = 25.954, p < 0.001, eta-squared = 0.581) such that location had fewer errors than both handshape (t(18) = 8.363, p < 0.001) and movement (t(18) = 6.429, p < 0.001), but handshape and movement had similar accuracies (t(18) = 1.884, p = 0.307). When examining errors among both similar and different categorization responses, the proportion of signs that differed by handshape were correctly identified 60% of the time with the remaining categorization spread across the other three types with the majority lying in the ‘more than one’ category at 29%. Location categorization was correctly identified 34% of the time and incorrectly categorized as movement 34% of the time; the remaining variance was captured in the ‘more than one’ category. Movement was correctly categorized as movement 68% of the time with the majority of the remaining variance in the ‘more than one’ category.
Discussion of AX Judgments Experiment
The AX discrimination task provided some interesting insights into how learners perceive sign phonology. With reaction times as proxies for the processing rate of similar and dissimilar sign pairs, the similar RTs for these two types of sign pairs suggests that differences within the visual domain may be more perceptually salient. Although this cannot be concluded wholly from the current study, differences in visual processing fit previous research. In spoken languages, oftentimes learners are not able to perceive nonnative contrasts as robustly in speech perception tasks, which might be due to finer aural phonetic saliency (Best & Tyler, Reference Best and Tyler2007). L2 ASL learners have a lifetime of experience with co-speech gestures that may transfer to L2 processing to aid in same-different judgments (Brentari, Nadolske & Wilford, Reference Brentari, Nadolske and Wolford2012). This follows previous research (Morford et al., Reference Morford, Wilkinson, Villwock, Piñar and Kroll2011; Morford et al., Reference Morford, Grieve-Smith, MacFarlane, Staley and Waters2008), in which nonnative signers and non-signers have been found to equally discriminate signs. Although not significant in the current study, movement seems to be processed more slowly than handshape or location. This finding coincides with previous data indicating that handshape and location may gather the lexical cohort early in sign retrieval (Carreiras et al., Reference Carreiras, Gutiérrez-Sigut, Baquero and Corina2008; Caselli & Cohen-Goldberg, Reference Caselli and Cohen-Goldberg2014) and movement is subsequently processed (Emmorey & Corina, Reference Emmorey and Corina1990). The decreased categorization accuracy for the location parameter contrasts in the present study has previously been reported for deaf British Sign Language signers (Marshall, Rowley, Mason, Herman & Morgan, Reference Marshall, Rowley, Mason, Herman and Morgan2013) and for ASL signers (Bochner et al, Reference Bochner, Christie, Hauser and Searls2011). The decrease in accuracy for location may be explained by an accuracy trade-off due to the L2 learners’ inclination to focus on the phonetic features of handshape (Morford & Carlson, Reference Morford and Carlson2011). The AX discrimination task provided crucial information that aligned with previous research. It also provided ASL proficiency measures that were used in the below correlational analyses.
Additional post-hoc analyses
Correlational analyses
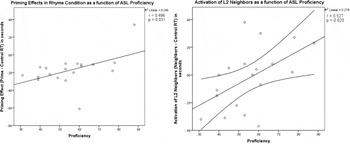
Another research question addressed network connectivity as a function of proficiency. Using the ASL proficiency score as a continuous variable allowed examining the interlanguage dynamics of these learners. Typically, as bilinguals become more proficient in their second language, they have greater inhibitory control to suppress the non-target language (Green, Reference Green1998). Therefore, the ability to suppress the non-target language should decrease the priming effect observed here. A possible cognitive mechanism that may explain this decreased priming effect is the de-weighting of lateral links. The de-weighting of the links is proposed to occur with increases in proficiency. Because the priming is caused by the aural prime spreading activation via these lateral links, de-weighting them was expected to result in less activation flow and a reduced priming effect. To examine this hypothesis, two correlations were calculated as a function of proficiency: rhyme priming effect and activation of L2 neighbors.
shows the distribution of categorization errors for each phonological parameter. For each phonological parameter on the x-axis, there is a stacked distribution of what the participant responded the similar-different pairs differed by. For example, if the pairs differed by handshape, the participants responded that they differed by handshape 60% of the trials and as more than one parameter 29% of the time.

The more proficient these learners were in ASL, the smaller the priming effect in the rhyming condition was (with priming measured as the difference between reaction times for the English rhyme and the control conditions; Figure 9, left). The priming effect represents the magnitude of priming, with negative numbers indicating that learners responded quicker in the rhyme priming condition than the control condition. L2 neighbor activation was calculated similarly with priming measured as the difference between reaction times for the L2 ASL neighbor and control conditions. Analogous to the decreased rhyme priming effects, there was a decrease in L2 neighbor activation by the more proficient learners compared to the less proficient learners (Fig. 9, right).
shows the scatterplots for the rhyme priming effect (left) and activation of L2 neighbors (right) as a function of proficieny. Correlations and signficance scores are reported to the right of each respective plot.

There was a strong correlation between the ability for a learner to detect that a sign was a pseudosign during the lexical decision task and their ASL proficiency. That is, the more proficient they were the better they could discriminate real signs from pseudosigns (Fig. 10, left). Also, the ability to correctly detect pseudosigns was correlated with better fingerspelling reproduction scores (Fig. 10, right).
shows the correlations with proficiency for pseudosign detection (left). The pseudosign detection is the accuracy on the lexical decision task for pseudosign pairs. On the right, the scatterplot indicates that this effect is mostly driven by the fingerspelling ability of the learner.

Response times for handshape contrasts in the same-different task were not significantly correlated with any measures or results. The self-reported use of ASL by the learners negatively correlated with processing times of sign pairs that differed by movement (r = −0.472, p < 0.05). Most surprising was the correlation between the learners’ rhyme priming effects and the ability to quickly process sign pairs that differed by location (r = -0.576, p < 0.05).
Discussion of Ad-Hoc Analyses
Correlational and regression analyses revealed several interesting findings. The correlation between rhyme priming effects and proficiency suggest that as learners become better at sign language, they start to have less priming for rhymes relative to non-related control targets. Similarly, a difference between the ASL neighbor and the control conditions provided insight into the activation of the L2 neighbors. A decrease in ASL neighbor activation with proficiency suggests that learners do not activate ASL neighbors as readily as they become more proficient in their L2. A decrease in activation may result from an inhibitory mechanism that suppresses non-target lexical items.
Some of the correlations provided answers to a number of questions that remain regarding the mechanisms that drive the effects that the learners exhibit. It was hypothesized that as learners become more advanced, they should become more attuned to the structure of the target language. Attuning to the structure of ASL was evidenced in the current study by participants’ correct rejections of pseudosigns during the priming task: the more proficient the learner the better they were able to correctly reject the pseudosign. This still leaves unanswered to which phonological parameters learners attend most; many suggest that learners attend to handshape more than native deaf signers (Morford & Carlson, Reference Morford and Carlson2011). Interestingly, in the current study, the ability to correctly detect pseudosigns was indeed correlated with better fingerspelling reproduction scores. This might indicate that better attention to phonological parameters, like handshape, helps with lexical identification and retrieval.
Correlations between phonological parameter processing times and a measure of use provided insight into what phonological mechanisms drive performance. Non-significant correlations for handshape might be indicative of the over-reliance on the handshape parameter by learners, which was too variable across participants to tease apart. Negative correlations with rhyme priming effects and movement contrasts suggest that movement may be a later mastered phonological feature or learners use the movement parameter later in lexical computation. Results of longer processing times for location being correlated with faster activation of ASL rhymes support neurological evidence in which English rhyming and signs differing by location activate similar brain regions (Colin, Zuinen, Bayard & Leybaert, Reference Colin, Zuinen, Bayard and Leybaert2013).
Overall, these correlations provide insight into the structure and change of the network over time. Interlanguage dynamics affect priming effects of both rhymes and ASL neighbors. Lexical acuity in pseudosign detection increases over time and is facilitated by the mastery of handshape. Movement features may be activated later in lexical computation. Finally, these correlations also suggest that cross-modal rhyming may be influenced by the activation of location features.
General Discussion
The goal of the current study was to investigate the network dynamics of bimodal bilingual lexical activation and how the network changes as a function of proficiency. This study extended our understanding of the interaction between the L1 and L2 lexical networks in a number of ways. First, this study demonstrated that lexical activation readily spreads through the L1 network while simultaneously activating L2 identity sign representations (e.g., paper → paper). More importantly, the pattern of results indicated that activation only spreads to surrounding cross-linguistic representations but not to more distant L2 neighbors (e.g., paper → paper ⇏ cheese). The activation of L2 neighbors is not facilitated by increased semantic activation either. The network dynamics of the beginning learner is uncontrolled, allowing for activation to spread across L1 to L2 neighbors. As the learner becomes more proficient the weaker the L2 neighbor activation. Finally, this study provided some primary evidence that ASL phonological parameters influence lexical activation.
The first objective was to investigate the ability for lexical activation to spread throughout the lexical network to help elucidate possible mechanisms that extend the findings from Morford et al. (Reference Morford, Wilkinson, Villwock, Piñar and Kroll2011) and Shook and Marion (Reference Shook and Marian2012). Morford et al. (Reference Morford, Wilkinson, Villwock, Piñar and Kroll2011) found parallel language activation in deaf bimodal bilinguals while reading English. In Shook and Marian (Reference Shook and Marian2012), the authors were able to show, in an eye-tracking study, similar parallel language activation insofar as the proportion and duration of looks to an ASL distractor that was phonologically related to the auditory word significantly increased compared to non-phonologically related words. They argued that there are lateral connections between the lexical items across languages despite modality differences, but conceded that semantics might spread activation to lexical items. Once an L2 lexical item is activated, its neighbors are activated by the spreading of activation to related features (Fig. 1). Our data validated and extended this model. When the learners who participated in this study heard an English word (e.g., die) and saw a sign that rhymed with the word in English (e.g., dry), they were able to access that sign much quicker. This pattern of results supports theories of a non-selective, integrated view of the bilingual lexical network (Dijkstra & Van Heuven, Reference Dijkstra and Van Heuven2002; Shook & Marian, Reference Shook and Marian2012). Despite modality differences in the sensory input, both languages are stored within the same lexical network with non-selectivity. More importantly, ASL rhyme activation is evidence that there is robust activation of L2 signs that are at least one L1 node away from the prime. However, this activation is dependent on the connections within the first language. The current results diverge from those of Shook and Marion (Reference Shook and Marian2012) in terms of L2 neighbor activation. Shook and Marion found activation of a sign neighbor paper for the target cheese when the spoken word was cheese. However, in the current study, there was no activation of cheese when the spoken word was vapor, a spoken neighbor of paper. This provides novel insights into how parallel language activation arises. It is not the case that extensive cross-linguistic neighborhoods are activated, but rather there are distance limitations. L1 neighbors share activation and simultaneously activate L2 identity neighbors, but there is weak to no activation of non-identity second order L2 neighbors. However, these results provide more evidence that there may be lateral connections between words across languages regardless of target modality. These lateral links are thought to be the strongest connections between lexical items when activation must spread across multiple nodes.
This organization of the lexicon is not limited to cross-modality in bimodal bilingualism, but also learners of two separate orthographic systems (Thierry & Wu, Reference Thierry and Wu2004, 2007; Wu & Thierry, Reference Wu and Thierry2010). In other words, Morford et al. (Reference Morford, Wilkinson, Villwock, Piñar and Kroll2011) argued that no cross-language overlap would increase reliance on the semantic relationships between the words. The authors argued that the activation of form might be a consequence of semantic activation of the target word. Subsequent to the activation of a semantic representation, the form information becomes available and interacts with language activation. Therefore these authors predicted that semantic links may be more responsible for translation activation in divergent versus similar language systems. Our results indicated that L2 sign neighbors were not activated more quickly through semantics compared to phonology. For example, the L2 neighbor (e.g., dad) within a semantically related pair (e.g., mom–dad) was not activated quicker than an L2 neighbor (e.g., week) in a non-semantically related pair (e.g., nice–week), despite both signs within the pair being phonologically related to each other. This finding suggests that distance limitations of the spread of activation are not reduced by top-down influences from semantics. Simply, activation may not spread past the first order ASL translation neighbor, regardless of semantic or phonological links. However, the results do not preclude semantics from spreading activation or allowing for top-down processes to aid in lexical computation. Instead we argue that the lateral connections may be sufficient.
The AX discrimination task data provided insights into the structure of the network and the phonological parameters used by nonnative signers when learning ASL. Although perceptually speaking, signs are easily discriminated across naïve and native groups, our data suggested that handshape may be processed quicker. Movement takes longer to process although it is not significantly different from handshape. This might be due to feature differences, in which handshape is a prosodic feature and movement is an inherent feature (Brentari, Reference Brentari1998). Nevertheless, the proportion of correct responses from the AX distribution also indicated that handshape and movement are the most salient features. Differential treatment of features might have implications for lexical computation based on the strengths of the connections between these phonological parameters and the lexical items. In fact, when an item analysis was performed, the lexical computation time of phonologically related words related by handshape (e.g., queen–king) was faster than that of words related by movement (e.g., girl–aunt). This suggests that indeed the weighting of connections between words that are related by handshape is stronger than those weighted by other phonological parameters. The frequency of input also alters network dynamics. The most highly connected (defined by reaction time and accuracy) signs differed by handshape, location and movement (see Figure 11), but were all high frequency signs (Mayberry, Hall & Zvaigzne, Reference Mayberry, Hall and Zvaigzne2013).
shows the top three neighborhoods from our study. These were determined by each of the words all being in the top quartile of reaction times and accuracy. The words with black letters are ASL signs. Note: the words in red are English words.

An outstanding question from previous work (cf. Morford et al., Reference Morford, Wilkinson, Villwock, Piñar and Kroll2011) is the role of proficiency in bimodal parallel language activation. The present results indicated that proficiency differentially affects parallel language activation in bimodal bilinguals. Differential effects due to proficiency can be attributed to increased suppression of the non-target language. During lexical selection bilinguals must resolve competing lexical items across languages by suppressing the competition via various control mechanisms (Abutalebi & Green, Reference Abutalebi and Green2007; Green, Reference Green1998; Kroll et al., Reference Kroll, Bobb and Wodniecka2006). Higher proficiency unimodal bilinguals must develop greater inhibitory suppression because the resting activations of both L1 and L2 are high. On the other hand, lower proficiency bilinguals have not yet developed such control, which allows for greater lexical interference from the non-target language (Costa & Santesteban, Reference Costa and Santesteban2004; Green, Reference Green1998). In the present study, similar control mechanisms appeared to be present for bimodal bilinguals. Recent neurological studies have shown that bimodal bilinguals have increased grey matter volume in the left caudate nucleus, a subcortical region implicated in language control and bilingual switching (Abutalebi, Annoni, Zimine, Pegna, Seghier, Lee-Jahnke, Lazeyras, Cappa & Khateb, Reference Abutalebi, Annoni, Zimine, Pegna, Seghier, Lee-Jahnke, Lazeyras, Cappa and Khateb2008; Zou, Ding, Abutalebi, Shu & Peng, Reference Zou, Ding, Abutalebi, Shu and Peng2012;). Such neurological evidence suggests that bimodal bilinguals have similar cross-language inhibition and suppression. The present findings supported these claims insofar as bimodal bilinguals with increasing proficiency also showed a decreased effect from the L1 English prime (i.e., the priming effects approximated zero difference in higher proficiency bimodal bilinguals). Therefore, the correlation seen with increased proficiency and decreased parallel language activation suggested that lower proficiency learners often do not inhibit the high levels of L1 English resting activation. These findings contribute to the growing body of literature on language suppression in unimodal bilinguals and uniquely demonstrate such effects in bimodal bilinguals. Additionally, these language proficiency findings have implications for models of bilingual language activation.
Elaborated Model
An elaborated model (Fig. 12) has been developed to capture bimodal bilingual interlanguage dynamics. This model represents an integrated structure between the signed (ASL) and spoken (English) lexicons. Activation is introduced into the bilingual network via a non-selective mechanism in which both spoken and signed representations are co-activated. Based on proficiency and interlanguage dynamics, the model can be refined by de-weighting links between lexical items. A de-weighting mechanism may be able to account for decreased lexical competition in higher proficiency bimodal bilinguals. In other words, the de-weighting of lateral links acts as a control mechanism for non-target language suppression. The initial state of the bimodal bilingual lexicon allows for spreading of activation across L1 and L2 neighbors easily. As proficiency increases, the lateral connections between the representations start to weaken, which in turn, slows the spread of activation across the phonological parameters. In addition, the learners’ early acquisition of and fixation on handshape might facilitate L2 neighbors that share similar handshapes; in contrast, learners’ later acquisition of movement may negatively influence L2 neighbor activation because the connections are weak or non-existent.
demonstrates the changes in connections and spread of activation as a function of time and proficiency. There are weakened weighting on the lateral links between the modality-specific representations (i.e. between paper and paper). There are also weakened weightings distributed across the parameters with the handshape parameter facilitating the most spread of activation.

A de-weighting mechanism within interlanguage dynamics would be able to account for the null effect of L2 neighbor activation. As learners receive more input, their representations become more stable and separable from the L1. The de-weighting mechanism may be similar to the automatization of lexical processing seen in higher proficiency bilinguals, which contributes to better non-target language suppression as well (Abutalebi & Green, Reference Abutalebi and Green2007). Additionally, learners are able to attune to phonetically important information. For example, fingerspelling ability drives the ability to discern pseudosigns from native signs for these learners. The pseudosigns differed from real signs only by the handshape parameter. Therefore, at the beginning of acquisition, specific phonological parameters influence most of the lexical computations due to the strong links (e.g., handshape) and the ability to know to which parameter to attend.
Over time, the statistical variability and the inherent features of the words learned change the weighting on these connections. The de-weighting of lateral links between lexical items across languages is logical as well. Although one could argue that increased specification of L2 lexical items could proportionally increase the competition between L1 and L2, the learners also gain greater language control simultaneously. Therefore, learners might de-weight the L1–L2 lateral lexical connections to resolve competition. That is, there are strong connections between both languages at the beginning of acquisition, but the weaker connections decrease the spread of activation to L2 lexical representations as the learners become more proficient. These strong lexical connections at the beginning of acquisition are important because they prove to provide a facilitative process. When learners have a restricted command of within-language connections they must recode or bootstrap native language activation, which shares information across lexical items in various modalities and languages.
Conclusions
This study expanded on recent models of bimodal bilingual lexical activation by delineating the structure and dynamics of the lexicon. There were several novel findings. First, rhymes within the first language can activate second language words. This suggests that the strength of these connections is high within the first language; the phonological features spread energy to their neighbors but conserve the energy across the lateral links to the L2 representations. Second, unlike other studies, we have shown that parallel language activation is a facilitative process. This facilitation is also a function of proficiency such that the more proficient learners do not activate lexical items that are laterally connected or L2 neighbors as strongly as less proficient learners. Also, the results reported here suggest that lateral links play a larger role as compared to semantic ones in the spreading of activation during lexical computation, at least for beginning learners. Finally, the (in)sensitivity to various L2 phonological parameters covaries with proficiency and influences network connectivity. Interlanguage dynamics influence the network connectivity of learners’ lexicons. In sum, this study provided additional evidence of parallel language activation despite modality differences.
Stimuli for Experiment 1 (Priming), bold words were semantically related [adapted from Morford et al. (Reference Morford, Wilkinson, Villwock, Piñar and Kroll2011)]