1. INTRODUCTION
This work is a continuation of the authors’ previous work on Automatic Dependent Surveillance Broadcast (ADS-B) failure modes and model (Syd Ali et al. Reference Syd Ali, Ochieng, Majumdar, Schuster and Kian Chiew2014). In that work, the authors conducted a qualitative analysis to identify ADS-B failure modes. To conduct the analysis, comprehensive knowledge on each ADS-B specific component and the integrated navigation and communication system components are required. This has been discussed in detail in the paper. The paper also discussed existing works on ADS-B failure modes assessment (Hammer et al. Reference Hammer, Calgaris and Llobet2007; Walala Reference Walala2008). However, none of the studies address ADS-B failure modes that will impact the system performance (particularly integrity and hence safety) for both ground and airborne applications. In addition, the authors work also described in detail various safety cases developed by EUROCONTROL (EUROCONTROL 2008a; EUROCONTROL 2008b; EUROCONTROL 2010), National Air Traffic Services (NATS) (NATS 2002; NATS 2007; NATS 2011) Federal Aviation Administration (Federal Aviation Administration 2000) and AirServices Australia (International Civil Aviation Organization (ICAO), ICAO 2006a; ICAO 2006b) for the ADS-B system assessment. The existing assessment methods used by them were based on comparison of ADS-B system performance against radar performance. The findings from the previous work created a grounding for the work in this paper. In this paper, the authors perform quantitative analysis to derive the risks in the ADS-B system based on its failure modes identified in the previous work.
Probabilistic Safety Assessment (PSA) is an established technique (Nusbaumer Reference Nusbaumer2010) to numerically quantify risk measures in safety critical systems. The technique aims to determine undesired events that can occur during the system's operational life span and their subsequent consequences. In addition, it can also identify indirect information such as the significance of individual risk contributors. Knowing the complex architecture of the Automatic Dependent Surveillance Broadcast (ADS-B) system (Syd Ali et al. Reference Syd Ali, Ochieng, Majumdar, Schuster and Kian Chiew2014), it is critical to identify the risk contributors within the system. This may help with the early failure mitigation efforts and subsequently ensure safety. Apart from this method, other methods such as Petri Nets or Markov Graphs can be used to assess complex systems. However, the design of the models in these methods are complex and error prone ((Dutuit et al. Reference Dutuit, Innal, Rauzy and Signoret2008).
The goal of PSA in this paper is to identify the specific events leading to hazards, so that they can be eliminated or controlled during system maintenance or in the system deployment phase, rather than showing that reliability goals have been met. According to Leveson et al. (Reference Leveson, Wilkinson, Fleming, Thomas and Tracy2014), in taking account of increasing aircraft complexity and software control, the traditional safety assessment process used in ARP4761 (S-18 Aircraft And System Development And Safety Assessment Committee 1996) omits important causes of hazards. This also applies to complex systems such as ADS-B. The PSA applied in this paper include events related to the system hardware, software, environmental factors and human factors into the measure.
The first step in PSA is to identify a top event or potential hazard and then trace the different failure modes that could lead to the top event. Logical combination of the failure modes or Basic Events (BE) is deduced and quantified using Fault Tree (FT) analysis. For each BE of the FT, a probability distribution value is assigned. The probability distribution values are propagated up through the tree logic to obtain the probability distribution value of the top event. Fault Tree Analysis (FTA) may be qualitative, quantitative or both, depending on the objectives of the analysis. Possible results from the analysis may be:
-
• A listing of the possible combinations of environmental factors, human errors, normal events and component failures that can result in a critical event in the system (minimal cut sets); and
-
• The probability that the critical event will occur during a specified time interval (risk measure).
In this paper, both qualitative and quantitative FTA analysis methods are used. In the first part of the analysis (qualitative analysis), cut sets for the potential hazards are identified. In the second part, quantitative evaluation of the fault tree is carried out using reliability data of each basic event that leads to the potential hazard. The FTA is conducted with the assumption that the ADS-B system operates as the sole surveillance system to support Air Traffic Control (ATC) operations. The FTA conducted in this paper aims to:
-
• identify the combination of basic events (minimal cut sets) that leads to the potential hazards of the ADS-B system;
-
• measure the risk of the potential hazards of the ADS-B system; and
-
• identify the events that contribute the most to the occurrence of the hazards (importance/sensitivity analysis).
It is important to note that input from Original Equipment Manufacturers (OEM) of subsystem components of ADS-B on the subsystem component performance (reliability data or probability distribution value) is vital in the FTA process. This is the most difficult part of the FTA quantification process, as most of the information is not easily obtained. Without this reliability data, it is not possible to conduct the risk measurement of the potential hazards. As described in Syd Ali et al. (Reference Syd Ali, Ochieng, Majumdar, Schuster and Kian Chiew2014), the ADS-B system is composed of navigation, communication and ADS-B specific components. In addition, the system includes human and environmental components that contribute to the system performance. Reliability data for the components in each of the external systems is obtained from the literature and OEM ((EUROCONTROL 2008a; Walala Reference Walala2008; Federal Aviation Administration 2008) and the software related events from McDermid and Pumfrey (Reference McDermid and Pumfrey2001)).
2. FAULT TREE CONSTRUCTION
The fault trees in this paper are developed using RiskSpectrum PSA version 1·0 (Scandpower 2008) developed by Scandpower. RiskSpectrum PSA is an advanced fault tree and event tree software tool used widely to conduct Probabilistic Safety Assessment (PSA) for nuclear power plants worldwide (Scandpower 2008). Based on the output from the Failure Mode Identification approach conducted by the authors in Syd Ali et al. (Reference Syd Ali, Ochieng, Majumdar, Schuster and Kian Chiew2014), six potential hazards of the ADS-B system are identified and defined as follows:
-
• Corruption of data for all aircraft
Significant error in ADS-B surveillance data (including position data) broadcast to ATC on the ground or to other ADS-B equipped aircraft within a specified range by all ADS-B equipped aircraft in the airspace.
-
• Corruption of data for one aircraft
Significant error in ADS-B surveillance data (including position data) broadcast to ATC on the ground or to other ADS-B equipped aircraft within a specified range by one ADS-B equipped aircraft in the airspace.
-
• Corruption of position data for one aircraft
Significant error in position data transmitted (in the ADS-B message) to ATC on the ground or to other ADS-B equipped aircraft by one ADS-B equipped aircraft in the airspace.
-
• Loss of data for all aircraft
Unavailability of ADS-B surveillance data (including position data) broadcast to ATC on the ground or to other ADS-B equipped aircraft within a specified range by all ADS-B equipped aircraft in the airspace.
-
• Loss of data for one aircraft
Unavailability of ADS-B surveillance data (including position data) broadcast to ATC on the ground or to other ADS-B equipped aircraft within a specified range by one ADS-B equipped aircraft in the airspace.
-
• Failure of ‘ADS-B In’
Loss of ADS-B data from other ADS-B equipped aircraft within a specified range which results in the failure of airborne applications that use the data.
A fault tree for each of the six potential system hazards (top event) is constructed based on the connection between the hazard (top event) and the failure modes (basic events) identified in Syd Ali et al. (Reference Syd Ali, Ochieng, Majumdar, Schuster and Kian Chiew2014). The basic events can be interpreted as the reason for the occurrence of the top event. The connection between the top event and basic events are illustrated using logic gates (Henley and Kumamoto Reference Henley and Kumamoto1981). Before constructing the fault trees, a detailed understanding of the ADS-B In and ADS-B Out system architectures and functionalities was gained from the literature and subject matter experts from NATS and British Airways (Syd Ali et al. Reference Syd Ali, Ochieng, Majumdar, Schuster and Kian Chiew2014).
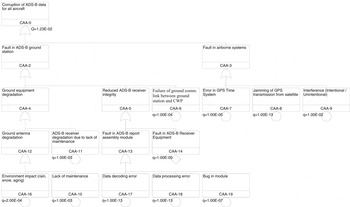
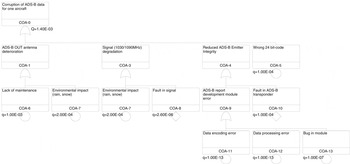
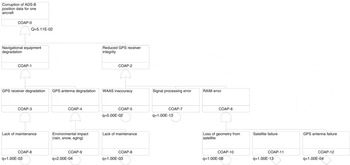
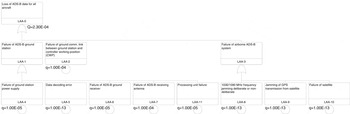
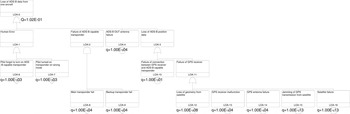
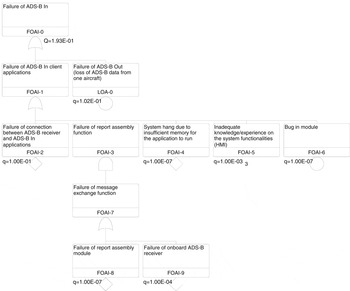
Figures 1 to 6 illustrate the fault trees constructed for the potential hazards for the ADS-B system. The fault tree in Figure 1 for ‘Corruption of ADS-B data for all aircraft’ mainly includes the degradation and reduced integrity of ADS-B ground and airborne equipment, while that for ‘Corruption of ADS-B data for one aircraft’ in Figure 2 includes only degradation and reduced integrity of airborne equipment of a particular aircraft. The fault tree for ‘Corruption of position data for one aircraft’ in Figure 3 is constructed with the failure modes of degradation and reduced integrity of the on board navigation system which feeds the aircraft position information to the ADS-B transponder. The ground equipment is categorised as a common failure mode which impacts all aircraft. The fault tree in Figure 4 for ‘Loss of ADS-B data from all aircraft’ includes failure of ADS-B ground equipment, failure of ground datalink between the ground stations and the Controller Working Positions (CWP) and failure of the airborne ADS-B system due to common failure modes such as satellite failure, Mode-S datalink failure and signal jamming within the airspace. Fault tree for ‘Loss of ADS-B data from one aircraft’ in Figure 5, is constructed based on human errors (by pilot) and failure of on board ADS-B equipment. Finally the fault tree for ‘Failure of ADS-B In’ in Figure 6 includes the failure of ADS-B In applications and failure of ADS-B Out service from other aircraft. The next section identifies minimal cut sets for each of the fault trees.
Fault tree analysis for ‘Corruption of ADS-B data for all aircraft’.

Fault tree analysis for ‘Corruption of ADS-B data for one aircraft’.

Fault tree analysis for ‘Corruption of ADS-B position data for one aircraft’.

Fault tree analysis for ‘Loss of ADS-B data from all aircraft’.

Fault tree analysis for ‘Loss of ADS-B data from one aircraft’.

Fault tree analysis for ‘Failure of ADS-B In’.

3. MINIMAL CUT SETS (MCS) IDENTIFICATION
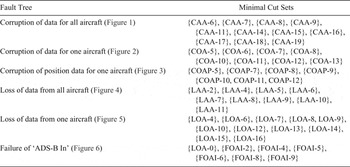
A cut set in a fault tree is a set of basic events whose simultaneous occurrence causes the occurrence of the top event. A cut set is said to be minimal if the set cannot be reduced without losing its status as a cut set (Vatn Reference Vatn2001). The cut set derivation depends on the logic gates applied to construct the fault tree; an AND gate increases the size of the cut set while an OR gate increases the number of cut sets. For small and simple fault trees, it is easy to identify the Minimal Cut Sets (MCS) by inspection without any formal algorithm. However, for large and complex fault trees an efficient algorithm is needed. The MOCUS algorithm (Method for Obtaining Cut Sets) is described in standard FTA textbooks, and an efficient improvement of the algorithm is described by Vatn (Reference Vatn1992). Table 1 provides the minimal cut sets identified for each of the fault trees developed for the potential hazards of the ADS-B system in this paper, using the MOCUS algorithm.
Minimal Cut Sets (MCS).

In reliability and safety analysis, it is crucial to know which failure modes must occur to create a hazard. Therefore, the concept of MCS clearly defines these failure modes. The next section measures the probability of occurrence (risk) of the potential hazards (top events) of the ADS-B system using Probabilistic Safety Assessment (PSA).
4. RISK MEASUREMENT OF THE POTENTIAL HAZARDS OF ADS-B SYSTEM
The Probabilistic Safety Assessment (PSA) using FTA uses various reliability models for the basic events that lead to the top event. Examples of the basic event reliability models are:
a) Repairable. This model applies for components in operation. Failure of a component is detected immediately and can be repaired. The component is unavailable during repair time. A typical failure mode here is “spurious stop.”
-
• Required parameters: Failure rate, Mean time to repair (MTTR)
-
• Optional parameters: Fixed probability
b) Tested. This is a standard model for components in stand-by. Failure of a component is detected only during component test. The component is unavailable during repair time. A typical failure mode here is failure to start.
-
• Required parameters: Failure rate, Test interval
-
• Optional parameters: Fixed probability, MTTR, Time to first test (TF)
c) Probability. This is a general model. Failure probability for the component does not depend on the time the component is in operation. Typically used for passive components or human errors.
-
• Required parameter: Fixed probability
d) Mission time. A component must work during a fixed time period and is non-repairable during this time. A typical failure mode here is “spurious stop.”
-
• Required parameters: Failure rate, Mission rate
-
• Optional parameters: Fixed probability
e) Frequency. This model requires a constant failure rate. It is applied for initiating events.
-
• Required parameters: Frequency of the failure
f) Non-repairable. This model is used for components which are not repairable during their operation. It is used in availability analysis and especially in time-dependent analysis.
-
• Required parameters: Failure rate
-
• Optional parameters: Fixed probability
In this paper, the Probability Reliability Model is used for all the basic events included to measure the probability of occurrence of the top events. The model is represented as:
 $$Q_{0(t)} =q_{0(t)}$$
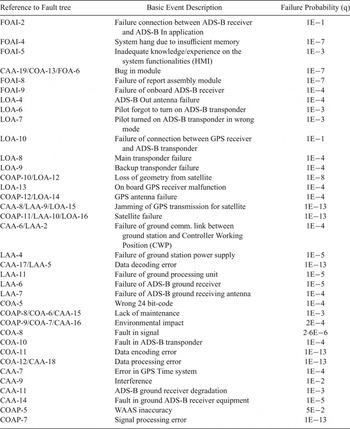
where Q 0(t) is the probability that the top event occurs at time t and q 0(t) is the probability of a basic event that leads to the top event. If the state of each component in the fault tree is known at time t, then the state of the top event can also be determined regardless of what has happened up to time t. Hence Q 0(t) is uniquely determined by the qi(t)s. The failure probabilities (q) of the basic events included in the FTA in this paper are adopted from EUROCONTROL (EUROCONTROL 2008a), Capstone Project (Walala Reference Walala2008), Federal Aviation Administration (2008) and the software related events from McDermid and Pumfrey (Reference McDermid and Pumfrey2001). The probability of a failure occurring is assumed to be distributed equally over all elements that can cause the failure (e.g. the probability of a failure on board an aircraft is equally likely for all aircraft types in the airspace). Table 2 provides the (q) values used for the basic events included in all the FTA in this paper. Some of the basic events are used to construct more than one fault tree. Therefore, the ‘Reference Column’ in Table 2 contains more than one reference code for one basic event referring its use to the different fault trees.
Failure probabilities for the basic events.

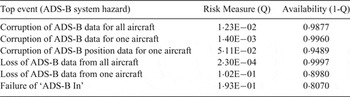
The results of FTA for all the ADS-B system hazards identified in this paper are provided in Figures 1 to 6. It should also be noted that the top event (LOA-0) in Figure 5 appears as one of the basic events in the fault tree in Figure 6. This is because Loss of ADS-B data from one aircraft (LOA-0) leads to failure of ADS-B In (FOAI-0). Table 3 summarises the FTA results for the top events.
Summary of FTA results for the top events.

The risk measure or the probability of the hazard/top event occurrence is also known as unavailability (EUROCONTROL 2008a). Therefore, the ADS-B system availability is defined as:
 $$\eqalign{{\bi Availability} &= {\bi 1} - ({\bi probability\,of\,the\,hazard/top\,event\,occurrence})\cr & = {\bi 1-Q}}$$
According to the Minimum Aviation System Performance Standards for ADS-B (RTCA 2002), if the ADS-B system were to be used as the sole means of surveillance, the system availability would be calculated using only ADS-B, aircraft sources and applications. In this paper, the FTA is conducted with the assumption that ADS-B operates as the sole means of surveillance. The availability of the ADS-B as supplemental (secondary surveillance sensor) or as a primary (main surveillance sensor) means of surveillance is specified as 95% and 99·9% respectively, for all operations (DO-242A). If ADS-B is used as a supplemental means of surveillance during the transition period to full ADS-B equipage, then the ADS-B system adds availability within a larger surveillance system. While if ADS-B is used as a primary means of surveillance, then a supplemental surveillance system (other mean of surveillance) independent of the navigation system is expected to be available. To date, there is no quantified requirement for availability of ADS-B as the sole means of surveillance. However, based on the stipulated availability requirements for other ADS-B operational modes discussed above, it can be assumed that the availability of ADS-B as the sole mean of surveillance will be smaller than 95% as it will not include availability of any supplemental system and it is also bound to the failure of the on board navigation system.
Table 3 presents the FTA results from this paper. The results show that the availability of the ADS-B system based on one aircraft is 89·8%. However, the availability of the ADS-B system based on all aircraft in the airspace is higher at 99·9%. This is because the latter is measured based on common failure modes that impact airborne ADS-B equipment (eg. satellite failure, signal jamming and interference) and failure modes of ADS-B ground equipment (e.g. ground station failure, ground data link failure) which are common to all aircraft within the airspace. While the former (i.e. based on one aircraft) is measured based on localised failure modes (airborne ADS-B equipment and supporting avionic systems) which directly impact the particular aircraft. It is also important to note that ADS-B is a surveillance system that critically relies on aircraft equipage. The FTA in this paper is conducted based on the assumption that the failure modes are equally distributed despite the aircraft avionics make/model. However, the analysis in; Ali et al. (Reference Ali, Schuster, Ochieng and Majumdar2016; Reference Ali, Schuster, Ochieng, Majumdar and Chiew2014), showed that ADS-B performance and some of the failure modes do vary based on the aircraft avionics make/model. This is particularly relevant to the on board positioning source, ADS-B transponder and ADS-B system configuration on board.
The FTA (in Table 3) indicates that the probability of ‘Corruption of ADS-B position data for one aircraft’ is higher than the probability of ‘Corruption of all ADS-B data for one aircraft’ at 5·11E−02 and 1·4E−03 respectively. The former hazard is mainly due to on board navigation system integrity reduction and equipment degradation. The latter hazard is due to ADS-B specific on board equipment degradation and data processing/encoding errors, the probability of ‘Corruption of ADS-B for all aircraft’ is measured as 1·23E-02. Finally the availability of ADS-B In service is measured as 0·807. Unavailability of ADS-B In includes failure of on board ADS-B receiving equipment, on board ADS-B In applications such as Controller Display of Traffic Information (CDTI) and Airborne Separation Assistance System (ASAS) and unavailability of ADS-B Out service from other aircraft.
The next section identifies which basic event contributes the most to the occurrence of the hazards (top event) using importance analysis method (Henley and Kumamoto Reference Henley and Kumamoto1981).
5. IMPORTANCE ANALYSIS
A component or cut set's contribution to the top event occurrence is termed importance. Importance analysis is useful for system design, diagnosis and optimisation (Henley and Kumamoto Reference Henley and Kumamoto1981). Possible variation of the system availability caused by uncertainty in components’ reliability parameters can be estimated through this analysis. Thus, inspection, maintenance and failure detection can be carried out based on the order of the importance of the components. Hence, the system can be upgraded by improving the components with relatively high importance (Henley and Kumamoto Reference Henley and Kumamoto1981).
Importance measures of the basic events are associated with the risk-significance and safety-significance of the related components. They are normally used to rank the system's components with respect to their contribution to the reliability and availability of the overall system. Thus, they provide an important indication about the components to be improved to increase the reliability and the availability of the system (Contini et al. Reference Contini, Fabbri and Matuzas2009). The reliability importance of a component in a system generally depends on the location of the component in the system and the reliability of the component itself (Vatn Reference Vatn2001). The importance is quantified using the following importance measures and their corresponding probabilistic expressions (Henley and Kumamoto Reference Henley and Kumamoto1981):
a) Fussel Vessely factor (FV). This measure is used to quantify the contribution of the basic event (i) to the top event with the present failure probability of i. The measure is calculated as:
 $$I_i^{FV}={Q_{TOP} (MCS\,including\,i)\over {Q_{TOP}}}$$
b) Risk Decrease Factor (RDF). This measure presents the maximum decrease in the risk for an improvement to the reliability (failure probability) of the basic event (i).
 $Q_{TOP} (q_{i}=0)$
indicates the decrease in the risk level with basic event (i) optimised or assumed to be perfectly reliable. The measure is calculated as:
 $$I_i^R={Q_{TOP}\over{Q_{TOP}(q_i=0)}}$$
c) Risk Increase Factor (RIF). This measure presents the worth of the basic event (i) in achieving the present level of risk and indicates the importance of maintaining the current level of reliability (failure probability) for the basic event.
 $Q_{TOP} (q_{i}=1)$
indicates the increase in the risk level without basic event (i) or with basic event (i) assumed to be failed. The measure is calculated as:
 $$I_i^I={Q_{TOP}(q_i=1)\over{Q_{TOP}}}$$
The importance measures above contain different information and thus have their own uses. For most applications, the combination of two importance measures is needed while for some other applications, one importance measure could be enough. The Fussel Vessely factor (FV) is often used as a measure of risk-significance and the Risk Increase Factor (RIF) as a measure of safety-significance. However, the FV importance alone is sufficient to identify potential components for safety improvement based on the ranking of the basic event's contribution to the occurrence of the risk (top event) (Van der Borst and Schoonakker Reference Van der Borst and Schoonakker2001).
The results of the importance analysis conducted for the ADS-B hazards (top events) are provided in Tables 4 to 9, which include the three importance measures FV, RDF and RIF. The results show the ranks of the basic events that give the greatest contribution to the likelihood of occurrence of the top event with the FV measure. In addition, in this paper the risk significance (with the FV measure) and safety significance (with the RIF measure) are regarded as a complementary way to identify the role of basic events in the risks of the ADS-B system.
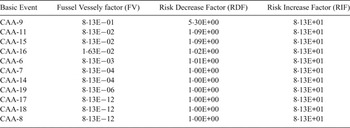
Importance analysis for Corruption of ADS-B data for all aircraft (refer to Figure 1).

The importance analysis results for ‘Corruption of ADS-B data for all aircraft’ are provided in Table 4. The FV measure results show that the basic event with the highest rank that contributes to the risk is basic event CAA-9 referring to signal interference with FV = 8·13E−01. Thus, when the probability of the present signal interference (1·00E−02) is improved, the maximum decrease in the risk is RDF (“5·30E”). The results further show that all the basic events have the same RIF value at 8·13E+01 indicating equal safety-importance to the system hazard. In other words, any change in the probability of the basic events will result in an increase in the risk level.
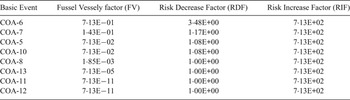
Table 5 provides importance analysis results for ‘Corruption of ADS-B data for one aircraft’. Based on the FV measure results, basic event COA-6 (referring to ADS-B Out antenna degradation due to lack of maintenance - this event is also considered as human error) is identified as the main contributing element to the occurrence of the risk. An improvement on it results in a maximum decrease of the risk level with RDF (“3·48E”). The safety-importance measure (RIF) of the basic events shows that all events have the same effect on the risk level measured in Figure 2 with RIF = 7·13E+02.
Importance analysis for Corruption of ADS-B data for one aircraft (refer to Figure 2).

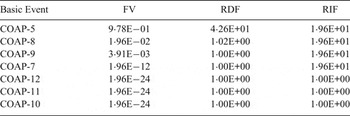
Based on the importance analysis results in Table 6, the FV measure indicates basic event COAP-5 (WAAS inaccuracy) has the highest contribution to ‘Corruption of ADS-B position information for one aircraft’ with FV = 9·78E−01. An improvement in the reliability of this basic event results in a maximum decrease in the risk with RDF = 4·26E+01. Further analysis based on the RIF indicates that basic events COAP-5, COAP-8, COAP-9 and COAP-7 have higher safety significance with RIF = 1·96E+01 than basic events COAP-12, COAP-11 and COAP-10 with RIF = 1·00E+00.
Importance analysis for Corruption of ADS-B position information for one aircraft (refer to Figure 3).

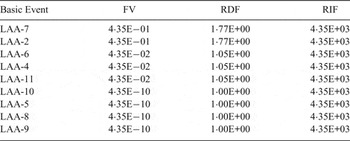
Table 7 shows the importance analysis results for Loss of ADS-B data from all aircraft. There are two basic events that have the highest contribution to the risk; LAA-7 (Failure of ADS-B receiving antenna) and LAA-2 (Failure of ground communication link between ground station and controller working position (CWP)) with the same FV measure at 4·35E−01. Improvement in the reliability of these basic event results in a maximum decrease in the risk with RDF = 1·77E+00. The results further show that all the basic events have the same RIF value at 4·35E+03 indicating equal safety-importance to the system hazard.
Importance analysis for Loss of ADS-B data from all aircraft (refer to Figure 4).

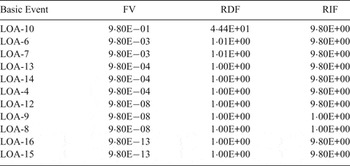
The importance analysis results for Loss of ADS-B data from one aircraft are provided in Table 8. The highest contributing basic event to the risk is LOA-10 (Failure of connection between GPS receiver and ADS-B capable transponder) with FV = 9·80E−01. An improvement in the reliability of the basic event results in a maximum decrease in the risk level with RDF = 4·44E+01. Further analysis based on the RIF indicates that basic events LOA-10, LOA-6, LOA-7, LOA-13, LOA-14, LOA-4, LOA-12, LOA-16 and LOA-15 have higher safety significance with RIF = 9·80E+00 than basic events LOA-9 and LOA-8 with RIF = 1·00E+00.
Importance analysis for Loss of ADS-B data from one aircraft (refer to Figure 5).

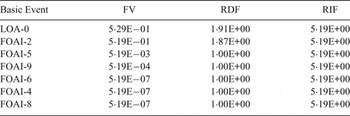
Table 9 shows the importance analysis results for Failure of ADS-B In. The FV measure indicates basic event LOA-0 referring to Failure of ADS-B Out (loss of ADS-B data from other aircraft) with FV = 5·29E−01. An improvement in the basic event leads to a maximum decrease in the risk with RDF = 1·91E+00. The safety-importance measure (RIF) of the basic events shows that all events have the same effect on the risk level measured in Figure 6 at with RIF = 5·19E+00.
Importance analysis for Failure of ADS-B In (refer to Figure 6).

6. DISCUSSION AND CONCLUSION
A safety advantage over the radar system is that failures of the ADS-B system on board an aircraft does not affect the whole ATC surveillance service based on the ADS-B system. Hence, failures are typically more localised. In addition, the availability of several ADS-B ground stations reduces the probability of failure of ground-based ADS-B systems in capturing ADS-B data from aircraft. On the other hand, failure of a radar system causes complete surveillance failure in the particular airspace within its coverage, forcing controllers and flight crew to engage in procedural control for ATC operations (ICAO 2007; ICAO 2006a; ICAO 2006b) for all aircraft within the sector.
The findings in this paper indicate that some of the ADS-B failure modes only affect one aircraft. However, loss of ADS-B data from one aircraft (refer to basic event LOA-0 in Figure 6) impacts the reliability of the ADS-B In service and the various future air navigation applications, such as situational awareness, conflict detection, conflict resolution, separation assistance or trajectory prediction. In the case where the failure modes are not detected, this may lead to safety risks.
Based on the findings from the failure modes (Syd Ali et al. Reference Syd Ali, Ochieng, Majumdar, Schuster and Kian Chiew2014), six potential hazards of the ADS-B system are identified. FTA is used to develop and quantify the occurrence of the potential hazards (risk). The findings indicate that the availability for the ADS-B system as a sole surveillance mean is low at 0·898 in comparison to the availability of ADS-B system as supplemental or as primary means of surveillance at 0·95 and 0·999 respectively. The latter availability values are obtained from DO-242A.
Further analysis identified minimal cut sets in the fault tree of each potential hazard. The minimal cut sets indicate the simultaneous occurrence of the basic events (which cannot be reduced) that ensures the occurrence of the hazards. Finally, importance analysis is conducted to rank the risk of basic events that lead to the ADS-B hazards identified in this paper. The risk significance and safety significance of each basic event are also identified. These will aid in ADS-B system operational and safety improvements.
It is also important to highlight that the results and findings in this paper indicate the need to prepare current and future ADS-B users for the loss of ADS-B in the worst-case scenario if the system is being used as the sole surveillance source such as in large parts of the Australia airspace or when it is used as a supplementary surveillance source for a particular airspace. The basic events in each fault tree that led to the top event can be used as guidelines or reliability concerns for ADS-B system maintenance actions or in the system deployment phase. These may lead to increased safety of the operational system.
ACKNOWLEDGEMENT
The authors would like to thankfully acknowledge the Lloyd's Register Foundation, United Kingdom, University of Malaya and Ministry of Higher Education, Malaysia for funding this research work.