Introduction
One of the biggest challenges in research on bilingualism is the concept of bilingualism itself and, related to this, how bilingualism can be best defined and measured in research (Grosjean, Reference Grosjean1998; Kaushanskaya & Prior, Reference Kaushanskaya and Prior2015; Luk, Reference Luk2015). The lack of consensus on the definition and measurement is, at least in part, an explanation of the fact that findings in bilingualism research are sometimes contradictory and often difficult to compare (Bialystok, Reference Bialystok2015; De Bruin, Treccani & Della Sala, Reference De Bruin, Treccani and Della Sala2015; Paap, Johnson & Sawi, Reference Paap, Johnson and Sawi2015).
Most educational and linguistic research on bilingualism to date has used a dichotomous definition of bilingualism to describe the sample: individuals are considered either bilingual or monolingual (Surrain & Luk, Reference Surrain and Luk2017). Likewise, many previous studies have treated bilingualism essentially as a unidimensional phenomenon that can be characterized by scores on separate variables (e.g., proficiency in either first or second language, or use of either first or second language). This approach is currently criticized, as it fails to recognize the large variability within bilingual populations and does not account for the variability within bilingual individuals over time or across contexts (Bialystok, Craik & Luk, Reference Bialystok, Craik and Luk2012; Dixon, Wu & Daraghmeh, Reference Dixon, Wu and Daraghmeh2012; Kroll & Bialystok, Reference Kroll and Bialystok2013). The present study proposes an alternative approach to capture the variability and multidimensionality of bilingualism. By applying a person-centred rather than a variable-centred approach, the present study aims to identify distinct subgroups within a population of bilinguals, involving the dimensions of proficiency and use in both languages simultaneously. Focusing on young Turkish–Dutch immigrant children enrolling in Dutch language kindergarten classrooms from age four, we examine which bilingual proficiency and use profiles can be distinguished, how children's profiles change between age four and six, and how profiles are related to non-linguistic factors such as socioeconomic background and cognitive abilities.
Addressing the complexity of bilingualism
The awareness that bilingualism is a complex phenomenon is not new. In previous work researchers have sought to find a definition that does justice to the heterogeneity of bilingualism. Terms have been used such as ‘imbalanced bilinguals’ or ‘semilinguals’ to address strong differences in proficiency levels between the two languages in particular bilinguals (Martin-Jones & Romaine, Reference Martin-Jones and Romaine1986; Ng & Wigglesworth, Reference Ng and Wigglesworth2007). Thomas-Sunesson, Hakuta and Bialystok (Reference Thomas-Sunesson, Hakuta and Bialystok2016) and Chen, Zhou, Uchikoshi and Bunge (Reference Chen, Zhou, Uchikoshi and Bunge2014) included bilingualism as a continuous variable, defined as the level of proficiency of bilingual children to effectively express themselves in two languages. Likewise, Sorge, Toplak and Bialystok (Reference Sorge, Toplak and Bialystok2017) included a gradient of bilingualism as a continuous variable, but in this case defined in terms of the degree of use of the two languages. This reveals an important point of discussion: should we refer to individuals’ use of the two languages, to their proficiency in the two languages, or to both when describing the level or degree of bilingualism?
Language proficiency and language use are related concepts. According to Grosjean (Reference Grosjean2010) and Li (Reference Grosjean and Li2012), an individual's proficiency will increase when the language is frequently used. Conversely, successful use of a language requires a sufficient level of mastery of that language. Yet, use and proficiency cannot be used interchangeably to define bilingualism, as is often assumed, but constitute separate, although related, dimensions (Grosjean & Li, Reference Grosjean and Li2012). Luk and Bialystok (Reference Luk and Bialystok2013) used exploratory and confirmatory factor analysis to examine the dimensional structure of bilingualism in a sample of bilingual young adults. Two continuous factors, only moderately correlated (r = .36), were found that represented the variability of bilingualism best: proficiency and use. This suggests that focusing on one dimension only (either use or proficiency) cannot sufficiently capture the multidimensional nature of bilingualism (Bialystok, Reference Bialystok2016).
According to Baker (Reference Baker2011), an important step forward would be to include several dimensions of bilingualism simultaneously, such as the productive and receptive abilities in both languages, the degree of use of both languages, the age and order of acquisition, and the structural differences and similarities of the languages concerned when addressing the bilingual experience, or profile, of an individual. Although this theoretical proposal has been welcomed (e.g., Francot, Van den Heuij, Blom, Heeringa & Cornips, Reference Francot, Van den Heuij, Blom, Heeringa, & Cornips, Buchstaller and Siebenhaar2017; Gertken, Amengual & Birdsong, Reference Gertken, Amengual, Birdsong, Leclercq, Hilton and Edmonds2014; Grosjean & Li, Reference Grosjean and Li2012; Kaushanskaya & Prior, Reference Kaushanskaya and Prior2015), to the best of our knowledge only a few empirical studies to date have actually attempted to apply a multidimensional approach. Anderson, Mak, Chahi, and Bialystok (Reference Anderson, Mak, Chahi and Bialystok2018b) developed the Language and Social Background Questionnaire, an extensive questionnaire to examine the heterogeneity of the bilingual experience. An exploratory factor analysis confirmed the finding of Luk and Bialystok (Reference Luk and Bialystok2013) that use and proficiency in both languages are separate dimensions to characterize bilinguals in a heterogeneous sample. In addition, they stressed the importance of language use in different contexts as an important dimension. While the researchers acknowledged the multidimensionality of bilingualism, they created a single composite measure of all dimensions to examine the association between the bilingual experience and executive function tasks, rather than creating profiles based on multiple dimensions and examining the differences between the profiles. We will briefly discuss these two different approaches, variable-centred versus person-centred, below.
Variable-centred versus person-centred approaches
A key challenge for bilingualism research is to capture the heterogeneity that may arise from the complex interplay of multiple dimensions of bilingualism. Variable-centred approaches are less appropriate to this end, since this approach aims at describing general associations among variables, with the goal to characterize the entire sample. The underlying assumption is that the population is homogeneous with respect to how the predictors operate on the outcomes (Howard & Hoffman, Reference Howard and Hoffman2018; Laursen & Hoff, Reference Laursen and Hoff2006). In comparison, the person-centred approach aims to describe differences among individuals in how variables are related to each other, while assuming the population to be heterogeneous. Since the population of bilinguals is notoriously heterogeneous and we aim to capture inter-individual differences on multiple dimensions, a person-centered approach is well suited here.
Several studies applied a person-centred approach to do justice to the heterogeneity of bilingualism, but struggled with including multiple dimensions. Dixon and colleagues (Reference Dixon, Wu and Daraghmeh2012) used an a priori categorization approach in a study among bilingual Singaporean kindergartners. They defined four bilingual profiles by systematically combining below versus above median scores on oral vocabulary tests in both the first and second language (respectively L1 and L2) of the children, and examined whether non-linguistic factors (such as socioeconomic status, abbreviated as SES) contributed to the differentiation between these profiles. They found that children from families with a low SES were most likely to experience low proficiency in both languages or low proficiency in English, compared to children from middle and high SES backgrounds. However, children from low SES backgrounds were also represented in the dual high proficiency profile. In a longitudinal study with dual language learning preschoolers, Collins, O'Connor, Suarez-Orozco, Nieto-Castañon and Toppelberg (Reference Collins, O'Connor, Suárez-Orozco, Nieto-Castañon and Toppelberg2014) determined bilingual profiles by applying conceptually derived cut-off criteria, using the monolingual norm-referenced mean scores on oral proficiency. The results revealed five dual language profiles; dual proficient, Spanish proficient, English proficient, limited proficient and borderline proficient. Their results showed substantial change in children's dual language profiles during their first years of school. Child, family and home linguistic factors (e.g., children's non-linguistic cognitive abilities, maternal education, maternal language proficiency) were predominantly related to the profiles at the first time point (kindergarten), whereas the school linguistic factors (e.g., school language use) had a larger impact at the second time point (second grade). Note that both Dixon and colleagues (Reference Dixon, Wu and Daraghmeh2012) and Collins and colleagues (Reference Collins, O'Connor, Suárez-Orozco, Nieto-Castañon and Toppelberg2014) only included children's proficiency in L1 and L2 to define profiles, rather than including both language use and language proficiency in the two languages. It can be easily seen that if the number of dimensions of bilingualism increases, a priori categorization would lead to a rather large number of theoretically derived profiles (e.g., 16 if proficiency and use of two languages are included). Moreover, systematically defining a priori profiles may result in profiles that do not accurately represent the population under study (Hickendorff, Edelsbrunner, McMullen, Schneider & Trezise, Reference Hickendorff, Edelsbrunner, McMullen, Schneider and Trezise2018).
A person-centred data-driven approach, yielding a limited number of profiles that accurately characterize subgroups of individuals in a given population based on multiple dimensions of bilingualism, offers an alternative. A recent study by Lonigan, Goodrich, and Farver (Reference Lonigan, Goodrich and Farver2018) has shown the benefits of using Latent Profile Analysis to evaluate subgroups of young bilingual children, based on their language proficiency in both languages. Examining the latent heterogeneity, they found nine distinct groups, each with unique patterns of absolute and relative levels of proficiency in L1 and L2, and examined whether different proficiency profiles predicted subsequent development in language-minority children's early literacy skills. The current study will apply a similar approach, though adding an important dimension to establish more comprehensive bilingual profiles of young children: the use of L1 and L2.
Associations with bilingual profiles
The way in which bilingualism manifests itself in individuals can change over time and across contexts, and can be susceptible to both linguistic and non-linguistic influences (Bialystok, Reference Bialystok2001; Hoff, Reference Hoff2013; Luk & Bialystok, Reference Luk and Bialystok2013; Melzi, Schick & Escobar, Reference Melzi, Schick and Escobar2017). Several studies have shown that time-dependent factors such as age, transitions in social and educational contexts, and the development of general cognitive and academic abilities affect both dual language proficiency and dual language use in bilinguals (e.g., Bialystok, Reference Bialystok2001; Blom, Küntay, Messer, Verhagen & Leseman, Reference Blom, Küntay, Messer, Verhagen and Leseman2014; Collins et al., Reference Collins, O'Connor, Suárez-Orozco, Nieto-Castañon and Toppelberg2014; Hoff, Reference Hoff2013; Leseman, Henrichs, Blom & Verhagen, Reference Leseman, Henrichs, Blom, Verhagen, Grøver, Ucelli, Rowe and Lieven2019). In young bilingual children, in particular, the transition from the predominantly first language home environment to preschool, kindergarten or primary school, in which children become immersed in the second language, can have a big impact on the use of the two languages and the language proficiency in both languages (Collins et al., Reference Collins, O'Connor, Suárez-Orozco, Nieto-Castañon and Toppelberg2014; Prevoo, Malda, Emmen, Yeniad & Mesman, Reference Prevoo, Malda, Emmen, Yeniad and Mesman2015; Leseman et al., Reference Leseman, Henrichs, Blom, Verhagen, Grøver, Ucelli, Rowe and Lieven2019).
Previous research often pointed to family's SES or children's cognitive abilities as important non-linguistic factors related to either the (possible) effects of bilingualism or the degree of bilingualism (for an overview, see Thomas-Sunesson et al., Reference Thomas-Sunesson, Hakuta and Bialystok2016). However, the relations of these non-linguistic factors with bilingualism may be more complex when multiple dimensions of bilingualism are combined into profiles. For example, several studies have found that maternal education, as an indicator of SES, is differently related to children's development of their L1 and L2; for Latino migrant families, maternal education is found to be related to children's proficiency in English, but not in Spanish (Place & Hoff, Reference Place and Hoff2016). In addition, Hoff, Burridge, Ribot and Giguere (Reference Hoff, Burridge, Ribot and Giguere2018) found that the language in which mothers achieved their highest level of education might explain this finding: the maternal educational level completed in English was related to their children's English skills, but not their children's Spanish skills. Conversely, the level of education completed in Spanish was related to their children's Spanish skills, but not their children's English skills. Second, the relationship between SES and bilingual language use is also complex (Prevoo, Mesman, Van IJzendoorn & Pieper, Reference Prevoo, Mesman, Van IJzendoorn and Pieper2011; Scheele, Leseman & Mayo, Reference Scheele, Leseman and Mayo2010). Migrant families with a higher SES often stimulate their children's L1 development in the home environment because they value bilingualism and the linguistic richness (and they have more resources to support L1), while low-SES migrant parents use their L1 more because that is the language they often feel most comfortable with (Arriagada, Reference Arriagada2005; Curdt-Christiansen, Reference Curdt-Christiansen2009; Prevoo et al., Reference Prevoo, Malda, Emmen, Yeniad and Mesman2015; Tovar-García & Podmazin, Reference Tovar-García and Podmazin2018).
When focusing on nonverbal cognitive abilities, it has been found that the relationship between bilingualism and cognitive abilities is bidirectional; a higher general learning potential may facilitate bilingual competences, and vice versa, the experience of learning and using two languages may influence the cognitive system (Bialystok, Reference Bialystok2010; Bohlmann, Maier & Palacios, Reference Bohlmann, Maier and Palacios2015; Collins et al., Reference Collins, O'Connor, Suárez-Orozco, Nieto-Castañon and Toppelberg2014). Recent studies have shown that children's cognitive abilities are differently related to the competences in L1 and L2. Blom (Reference Blom2019) found, in her study on young bilingual children with a migrant background in the Netherlands, that nonverbal cognitive abilities influence L2 receptive vocabulary development, but not the development of L1 receptive vocabulary. Hoff (Reference Hoff2020) confirmed these findings for young English-Spanish speaking children, showing that nonverbal intelligence only predicted the rate of English expressive vocabulary growth. The current study examines the associations between family's SES and children's nonverbal intelligence and distinct bilingual profiles over time.
The present study
The present study addresses the issues regarding the complexity of bilingualism by applying a three-step person-centred profiling approach to capture the bilingual experience of a cohort of young bilingual Turkish–Dutch children. First, we conducted Latent Profile Analysis (LPA)Footnote 1 at two time-points, when the children were four and six years of age, to identify the bilingual profiles of the children that emerge from the variation along the main dimensions of bilingualism: proficiency and use of the two languages. Second, using a longitudinal design, we examined the stability and developmental changes of these profiles by conducting Latent Transition Analysis (LTA). Third, we investigated the relations of the identified profiles with two non-linguistic factors, the family's SES and children's nonverbal intelligence, by including them as predictors of class-membership at age four and six.
The Turkish–Dutch population is the largest non-Western immigrant population in The Netherlands (Statistics Netherlands, 2016). Until kindergarten entry, most Turkish–Dutch children are mainly exposed to Turkish, their first language (L1), in the home and wider family environment because of the close social ties within the Turkish community and the strong maintenance of the heritage language (Backus, Reference Backus, Bhatia and Ritchie2013). Although they become gradually introduced to Dutch (L2), for example via part-time use of a Dutch language day care centre or preschool in this period, for most children Turkish is the language they hear most before age four (Scheele et al., Reference Scheele, Leseman and Mayo2010). From age four, almost all Turkish–Dutch children, like native Dutch peers, are introduced to the kindergarten departments of primary schools, which offer a program of 20 hours per week in which Dutch is the only language. Preschool and kindergarten attendance leads to a gradual increase of children's use of and proficiency in Dutch as L2. Consequently, the use of L2 in mother-child communication has been reported to increase in this period, while the use of L1 decreases (Leseman et al., Reference Leseman, Henrichs, Blom, Verhagen, Grøver, Ucelli, Rowe and Lieven2019; Prevoo et al., Reference Prevoo, Mesman, Van IJzendoorn and Pieper2011). Thus, the period between age four and age six is an important transition period in which the increasing exposure to and use of Dutch is expected to influence the bilingual profiles of the Turkish–Dutch children.
The study addresses the following research questions:
1) Which bilingual profiles can be distinguished at age four and age six, respectively, based on children's proficiency in L1 (Turkish) and L2 (Dutch) and on their use of L1 and L2 at home?
2) To what extent do children change in bilingual profile between age four and age six?
3) Are the identified profiles at both ages related to the socioeconomic status of the children's families and to children's nonverbal intelligence?
Method
Participants
The current study focused on second-generation Turkish children living in the Netherlands. Existing data from two parallel studies (conducted in 2006–2009) were used, one focusing on the influence of environmental factors on bilingual language development (Scheele, Reference Scheele2010; Turkish–Dutch subsample n = 50) and the other on the development of verbal short-term memory in bilingual children (Messer, Reference Messer2010; Turkish–Dutch subsample n = 67). Given the aims of the current study, we did not include the monolingual children from Scheele (Reference Scheele2010) and Messer (Reference Messer2010). The two datasets were merged to create a sufficiently large sample. Solely measures that were exactly the same in the two original studies were used for the current study. T-tests revealed that children in both studies were comparable on degree of use of the Turkish and Dutch language at home, and Dutch receptive vocabulary (all p > .05) at both age groups. In Scheele (Reference Scheele2010), children were slightly older (only at age four) and the average family SES and the proficiency in Turkish of the children were slightly higher at age four than in Messer (2010), but the score distributions largely overlapped and these differences disappeared at age six (see Appendix A, Supplementary Materials for the descriptive statistics of both datasets). Multivariate regression analyses were run to check whether there was an interaction effect of family SES and the dataset on the language use and language proficiency variables at both ages. No significant interaction effects were found, indicating that the two datasets do not differ in the way SES predicts the outcome variables (see Appendix B, Supplementary Materials for the regression analyses).
Data from the final sample were collected in two waves; when children were approximately four and six years old. At wave 1, all children were recently enrolled in all-Dutch kindergarten classrooms. Data were missing on the four key variables (Turkish and Dutch language use at home, and Turkish and Dutch receptive vocabulary) for 5.13% and 11.96% of the 117 children at wave 1 and 2, respectively. Furthermore, one outlier on the age variable was found (same participant in both age groups). This child was tested at a substantially later age than the other children in the same wave (66 months at age four and 84 months at age six). Analyses were run with and without this one child, and no differences were found for the Latent Profile Analyses. For reasons of homogeneity of the sample, it was, however, decided to exclude this participant. The final sample included 110 children (50.90% males) at wave 1 and 102 children at wave 2. At wave 1, the mean age was 52.10 months (SD = 1.74, range = 49–57 months). At wave 2, at the end of kindergarten, the mean age was 71.42 months (SD = 2.21, range = 67–83 months). Hereafter, the two waves are referred to as the age four and age six measurements.
Procedure
Both original studies followed a largely similar procedure. In Messer (Reference Messer2010), researchers approached Dutch primary schools with a moderate to high percentage of ethnic minority children (25–100%). For this study, the primary caregivers (mainly mothers) of the children were administered a pre-screening questionnaire to ensure that only children and families were included in which the language interactions with the target child in the family context were at least for 70% in Turkish. Trained research assistants, who were fluent in the native (Turkish) and second language (Dutch) of the children, tested each child individually. Standardized tests were administered to the children in a fixed order using laptop computers. After the children were tested, the parental questionnaire was administered in personal interviews with the mother in the mother's language of preference.
Scheele (Reference Scheele2010) used the same criterion for inclusion of families, followed the same testing procedure and used the same measures and parental questionnaire as Messer (Reference Messer2010). There were two minor differences between the two studies. In Scheele (Reference Scheele2010), immigrant families in two large municipalities were approached directly (rather than via schools), and, whereas in Messer (Reference Messer2010) children were tested in two sessions at school, the children in Scheele (Reference Scheele2010) were tested at home during two visits. For more details on the procedures and measures, see Messer (Reference Messer2010) and Scheele (Reference Scheele2010).
Measures
Language Use
Children's use of L1 and L2 in different activity domains was investigated at each wave via personal interviews with the mothers using a structured parental questionnaire. Mothers were asked to indicate how frequently these verbal interaction activities occurred. The answers were scored on a five-point Likert scale with scores ranging from 1 (never) to 5 (daily). Four scales, comprising of 9 to 30 items, were constructed representing different types of activities involving language use by the child: personal conversations at home (e.g., “How often do you talk with your child about how he or she feels?”), personal conversations outside home (e.g., “How often do you talk about the things your child experiences, for example about the children your child plays with?”), playing games (e.g., “How often does your child play with board games?”), and school-related activities (e.g., “How often do you talk with your child about what happened at school?”). All scales had satisfactory internal consistency with Cronbach's alpha values ranging from .82 to .92.
For each type of language activity (e.g., personal conversations at home), mothers were also asked to indicate which language was used for that activity. If only one language (either L1 or L2) was used for an activity, a score of 1 was given for that language, and a score of 0 for the other language. If the target language was mostly used, but another language sometimes, a score of .75 was given. If the target language and another language were used equally, a score of .50 was given. A score of .25 was assigned if another language was used more often than the target language, and finally, a score of 0 was given if the target language was never used with that particular type of activity. For instance, if the interviewee indicated that the child used “more Turkish than Dutch” while playing games, a score of .75 was given for the first language, Turkish, and a score of .25 for the other language, Dutch.
Eventually, four language-specific use variables were constructed as the product of the average scores on the language activity scales (range 1 to 5) and the weights for language use (range 0 to 1), for both L1 and L2 respectively, yielding scores that ranged from 0 to 5Footnote 2. Preliminary examination of the data showed high correlations (ranging between r = .45 and r = .90, all p's <.01) between the language-specific variables. Therefore, two variables were created for each measurement wave, computed as the mean of the four language use variables, indicating overall Language Use L1 and Language use L2 for the family.
Language proficiency
Vocabulary size is a significant predictor of academic achievement and literacy acquisition (Bialystok, Luk, Peets & Yang, Reference Bialystok, Luk, Peets and Yang2010), and receptive vocabulary knowledge is the best single indicator of the language skills of a bilingual child (e.g., Hulstijn, Reference Hulstijn2011; Luo, Luk & Bialystok, Reference Luo, Luk and Bialystok2010). Children's receptive vocabulary was assessed in both languages using the receptive vocabulary test of the Diagnostic Test of Bilingualism, developed by the national educational testing service, CITO (Verhoeven, Narain, Extra, Konak & Zerrouk, Reference Verhoeven, Narain, Extra, Konak and Zerrouk1995). The test requires children to match a target word, mentioned by the research assistant, with one out of four pictures. For instance, when the research assistant says “pile up”, the child is required to point to the picture where a man piles up several boxes. The vocabulary test with 60 items (numbered 1 to 60) of increasing difficulty was split in two parts, one part consisting of the odd-numbered items and a parallel part consisting of the even-numbered items, yielding equivalent forms with each 30 items of increasing difficulty. In the present study, children were administered the odd-numbered items to assess vocabulary in L1 and the even-numbered items to assess vocabulary in L2. Testing continued until the child failed five consecutive items or completed all 30 items of the test. Cronbach's alpha values for the receptive vocabulary tests ranged from .77 to .89 at both measurement occasions. The scores were normally distributed (as indicated by non-significant Shapiro-Wilk W tests per language and age group, ranging from W[103] = .98, p =.07 to W[107]= .99, p = .17), and did not reveal floor or ceiling effects.
Nonverbal fluid intelligence
Raven's Coloured Progressive Matrices (Raven, Raven & Court, Reference Raven, Raven and Court1998) was administered to measure nonverbal fluid intelligence at Wave 1. The task was presented on a laptop computer using the software package MINDS (Brand, Reference Brand, den Brinker, Beek, Brand, Maarse and Mulder1999). The children had to conduct 36 perceptual and conceptual exercises by completing a pattern correctly by choosing one out of six pieces. Correct answers on each exercise were summed, yielding a total score between 0 and 36. According to Pearson Talentlens (2011), Cronbach's alpha value for the Dutch version of the Raven's test is .81.
Socioeconomic Status
Family SES was based on questions about the level of education of the parents at Wave 1 and was computed as the mean of the highest attained education level of both parents, ranging from 1 (primary school or less) to 6 (university degree). Parental education is the most commonly used index of SES background, is highly predictive of other SES indicators (e.g., income, job status), and is a better predictor of children's academic performance than other SES indicators (see also Calvo & Bialystok, Reference Calvo and Bialystok2014).
Statistical analyses
Latent Transition Analysis (LTA) was conducted in a three-step approach (Hickendorff et al., Reference Hickendorff, Edelsbrunner, McMullen, Schneider and Trezise2018). First, bilingual profiles were identified based on use and proficiency in both languages for age four and age six using Latent Profile Analysis (LPA) in Mplus version 8.1 (Muthén & Muthén, Reference Muthén and Muthén1998). LPA models the heterogeneity inherent in response patterns and detects latent profiles of children with similar response patterns. Since latent profile indicators do not need to be measured in the same metric and using group or grand mean centred variables leads to information loss, raw data were used (Muthén & Muthén, Reference Muthén and Muthén2018; Seltzer, Frank & Bryk, Reference Seltzer, Frank and Bryk1994). The statistical criteria applied were the Akaike Information Criterion (AIC) and the sample size adjusted Bayesian Information Criterion (SS Adj. BIC). The best solution was chosen based on the smallest indices of both criteria. An additional index of entropy was calculated to evaluate homogeneity, with values close to 1 indicating sufficient homogeneity of the profiles (Celeux & Soromenho, Reference Celeux and Soromenho1996). In addition, the parametric Bootstrapped Likelihood Ratio (BLRT) was consulted to determine if models that differed by one profile differ significantly from each other in model fit (Nylund, Asparouhov & Muthén, Reference Nylund, Asparouhov and Muthén2007). If the BLRT has a p-value smaller than .05, it indicates that the model with more profiles indeed has a better fit than the model with fewer profiles. Next to these statistical guidelines, also the interpretability of the profiles was checked.
After retaining the best fitting models for age four and age six, we examined the measurement invariance of the profiles across time to test whether the four profiles at age four and age six display a similar structure (i.e., whether the four profiles can be considered to be the same across time). The stability of profile membership over time was examined with LTA. The LTA models used in this study were estimated using the robust maximum likelihood estimator (Collins & Lanza, Reference Collins and Lanza2010). To avoid the problem of local maxima (i.e., selection by chance of a suboptimal solution), the analyses of each model were conducted with 1000 random sets of start values to ensure that the best loglikelihood value was adequately replicated. Moreover, the default was increased to 100 iterations for these random starts and retained the 100 best solutions for final stage optimization (Hipp & Bauer, Reference Hipp and Bauer2006). Finally, in order to examine the relations of the bilingual profiles with SES and nonverbal intelligence, multinomial logistic regression (MLR) analyses were applied, yielding odds ratios [OR] with 95% confidence intervals [CI]).
Results
Descriptive statistics
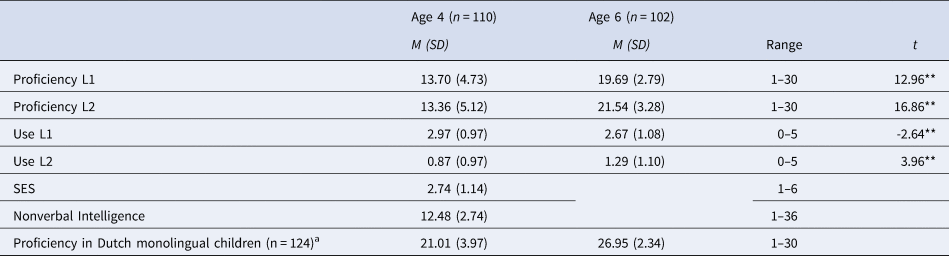
Table 1 reports the means of the variables in the current study: two language proficiency variables, two language use variables, family SES, and nonverbal intelligence score of the children. The assumptions of normality were met for the variables, therefore parametric paired sample t–tests were applied, revealing that both the proficiency in L1 (Turkish) and L2 (Dutch) increased significantly over the years. Also the use of L2 increased significantly, while the use of L1 decreased significantly. The mean score of family SES implies an average level of educational attainment, approximately corresponding to the senior vocational training level. The mean score of nonverbal intelligence indicates an average level that did not differ from the mean score of the monolingual Dutch children with varied socioeconomic backgrounds in the studies of Scheele (Reference Scheele2010) and Messer (Reference Messer2010). To better interpret the proficiency scores of this bilingual sample, proficiency scores of the monolingual Dutch children from the original studies are shown in Table 1 as well. As was expected, the monolingual peers scored significantly higher in Dutch than the bilingual children at both ages (age 4, t[229] = 14.49, p <.01, age 6, t[225] = 12.81, p <.01).
Descriptive Statistics of Age Four and Age Six

a Monolingual sub-group study Scheele (Reference Scheele2010) and Messer (Reference Messer2010) **p < .01
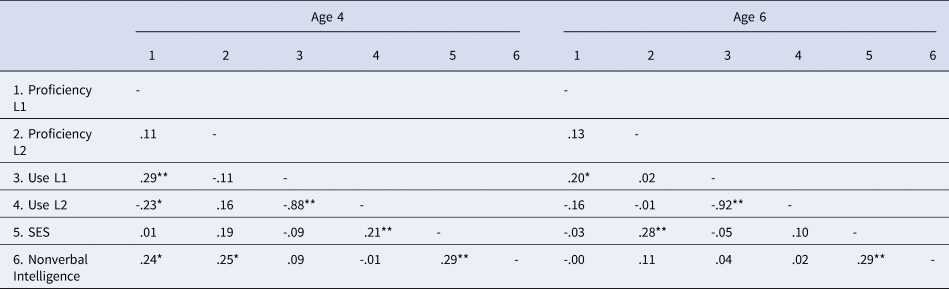
Table 2 presents the Pearson correlations of the variables for age four and age six. There was a strong negative correlation between the use of L1 and the use of L2 at both ages, reflecting that the time for exposure to one language competes with the time for exposure to the other language within the family context (Leseman et al., Reference Leseman, Henrichs, Blom, Verhagen, Grøver, Ucelli, Rowe and Lieven2019; Place & Hoff, Reference Place and Hoff2011). Moreover, proficiency in L1 was positively related to the use of L1 for both age groups and negatively to the use of L2 at age four. Note that the correlations between proficiency and use were rather weak, confirming that language use and language proficiency are two different dimensions of bilingualism (Luk & Bialystok, Reference Luk and Bialystok2013). SES was positively related to the use of L2 at age four and positively related to the proficiency in L2 at age six. Nonverbal intelligence was positively correlated to both L1 and L2 proficiency at age four, but not at age 6.
Correlation Matrix of Measures at Age Four and Age Six.

* p < .05. ** p < .01
Latent Profile Analysis (LPA)
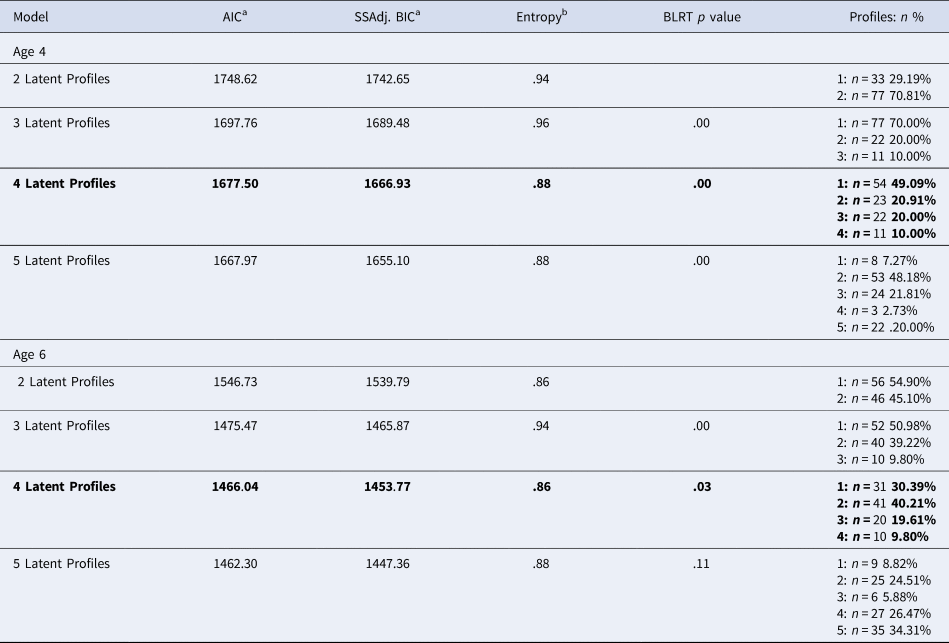
In order to determine the optimal number of latent profiles (based on proficiency in L1, proficiency in L2, use of L1, and use of L2), several LPA models were compared ranging from two to five latent profiles. Table 3 shows the four fit indices for both measurement occasions. The AIC and BIC indices showed that a five-profile model would fit best at age four. However, given the unequal distribution of number of children in this profile, there was more support for the four-profiles solution, which had slightly higher AIC and BIC scores. The BLRT was uninformative as its value was significant for each model analysed at age four.
Fit Indices for the Latent Profile Models Age Four and Age Six.

a Lower AIC and SS Adj. BIC values indicate better fit.
b Entropy should be greater than .7.
Similar to the LPA at age four, the five-profile model at age six resulted in small, unequal profiles, although the AIC and BIC values were slightly lower than for the four-profiles model. An insignificant BLRT value indicated that the four-profiles solution had a significantly better fit than the five-profile solution. The entropy values of the four-profiles models indicated good homogeneity of the profiles, .87 and .86 for age four and age six respectively. Therefore, it was decided that a four-profiles model was the best fitting model on both measurement occasions.
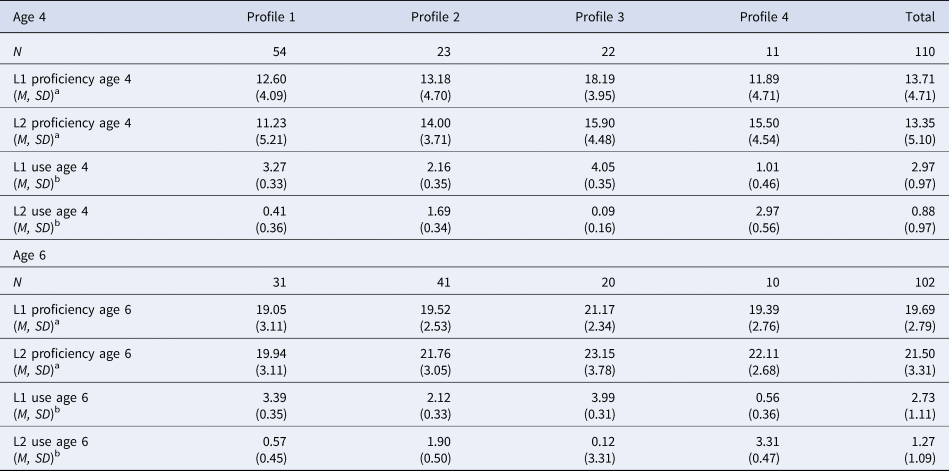
Prior to interpreting the profiles and examining the transitions over time, models were compared reflecting varying degrees of measurement invariance across the assessments at age four and age six, using standardised scores to adjust for changes in means over time (Nylund, Reference Nylund2007). A full measurement invariance model was fitted and compared to other models with less restrictive invariance assumptions. Log likelihood ratio tests indicated that at least partial invariance (equality constraints imposed on one of the four profiles) could be established (χ2(4) = 4.39, p = .35), though not full measurement invariance (χ2(16) = 41.83, p <.01). The four profile models indicated similar structures over time (as will be discussed below). Therefore, we retained a similar interpretation and terminology of the latent profiles over time. Table 4 displays the raw average scores per profile.
Raw scores Four Profiles at Age 4 and Age 6.

a Range 1–30
bRange 0–5
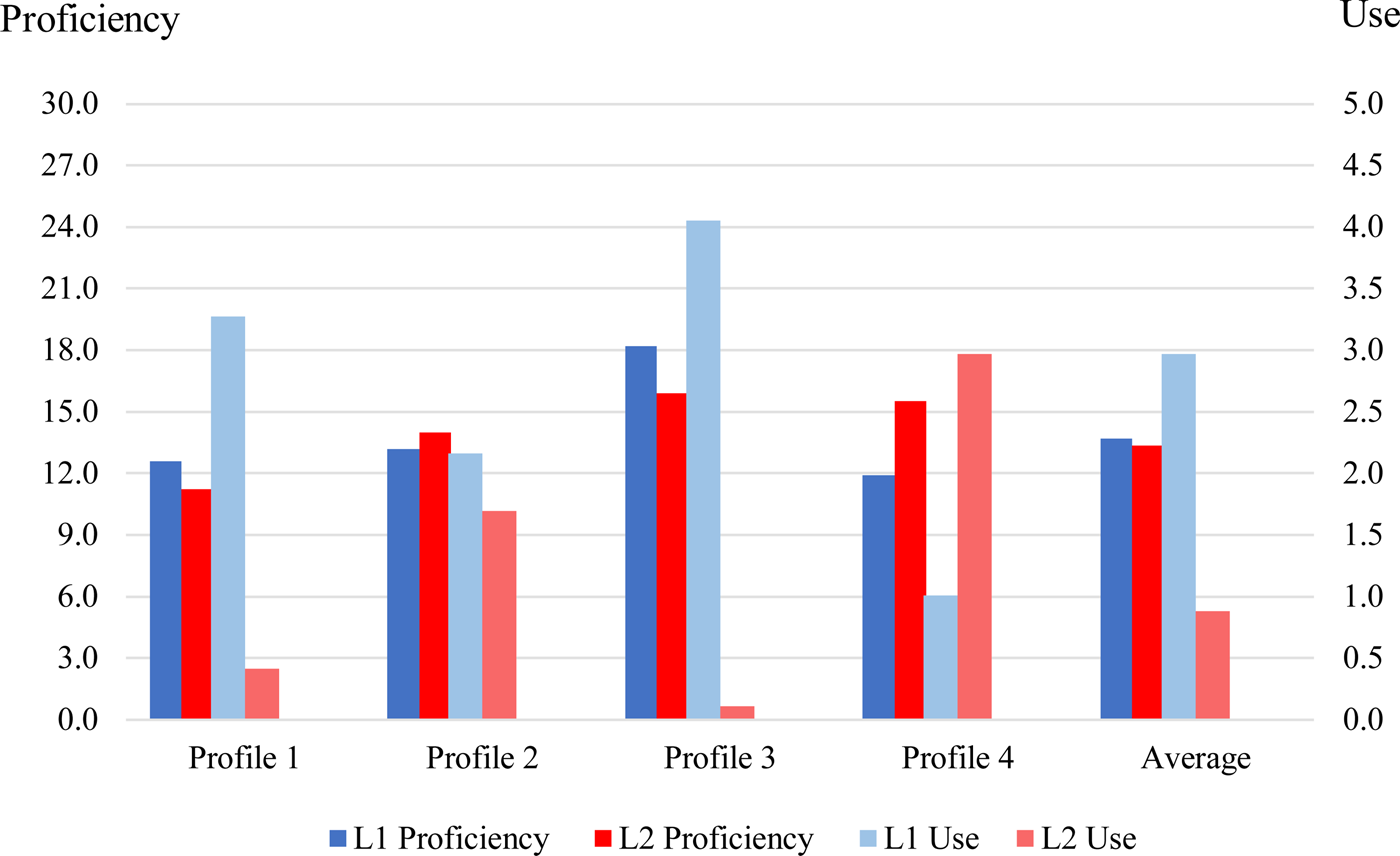
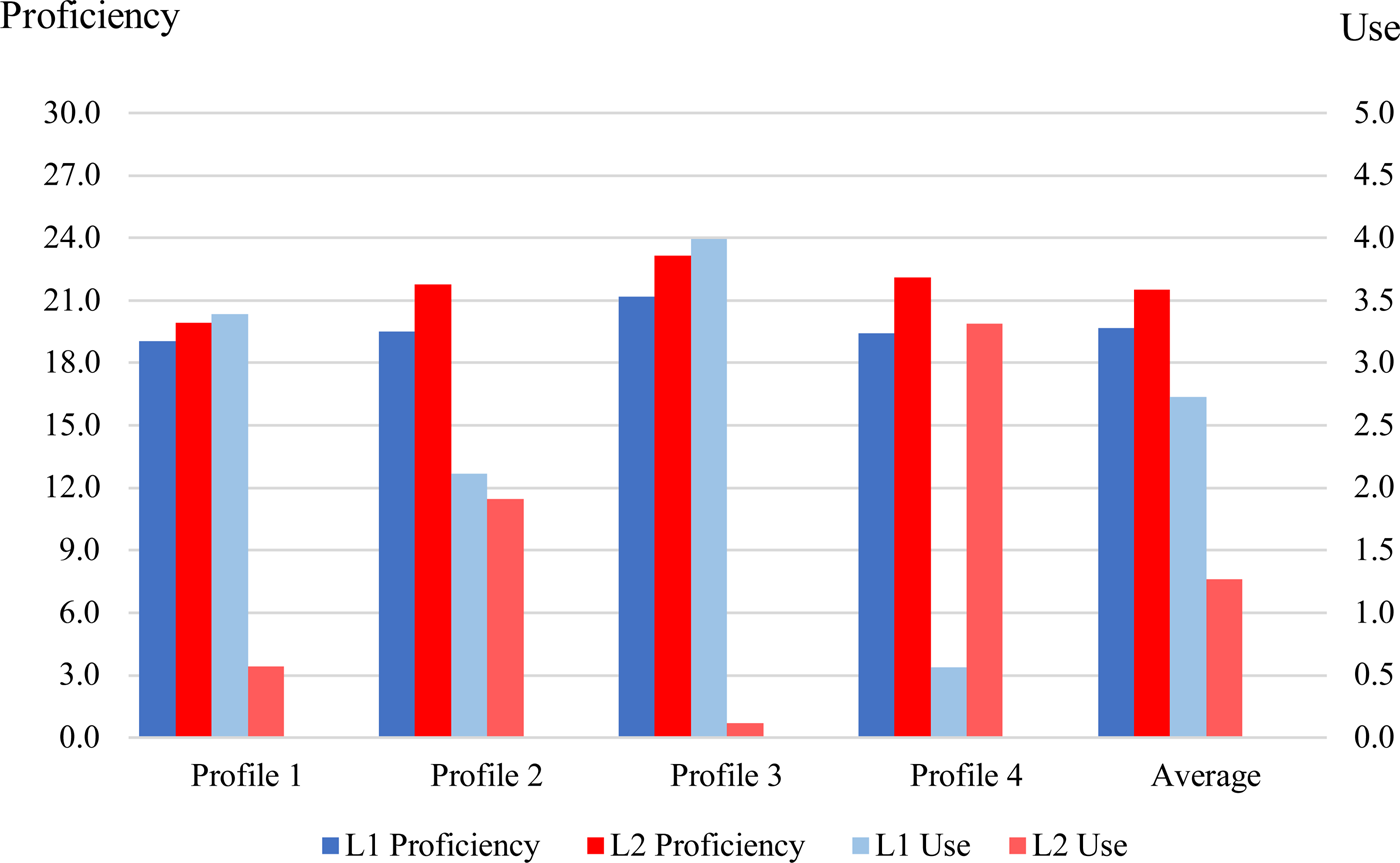
For the overall pattern of responses of the four profiles, see Figure 1 and 2. Note that the measures of proficiency and use had different measurement scales. In order to display the four measures in one graph, we used a primary vertical axis for the proficiency scores (represented by the two left bars) and a secondary vertical axis for the use scores (represented by the two right bars). When creating the graph, we did not standardize on the group mean of each variable (i.e., by computing Z-scores). Although this would have enabled us to display the four scores on the same scale, taking the highly divergent means per variable (as displayed in Table 1) as baselines would have led to a distorted display of the profiles, and the change in means over time would have disappeared. Note that children's proficiency in both L1 and L2 increased significantly over time (as illustrated by the higher proficiency bars at age 6) and that the variation between the profiles decreased. Use of L1 and L2, in contrast, due to the nature of the measurements (frequency of use) did not show a clear developmental increase, although presumably both the conceptual content and linguistic structure of L1 and L2 use did change between age four and age six.
Raw scores of profiles at Age 4.

Raw scores of profiles at Age 6.

Profile 1 (see Figure 1 and 2, 49.09% of the children at age four and 30.39% at age six) was characterized by relatively below group average proficiency scores in both L1 and L2 at both ages. Children assigned to this profile did improve in proficiency over time, similar to the other profiles, but proficiency scores overall remained the lowest when compared to the other profiles, especially regarding their L2 proficiency. The use of L1 was clearly above average and use of L2 was relatively below average at both age four and age six. This profile was termed a ‘Dominant L1 use, relatively low L1 and L2 proficiency’ profile.
Profile 2 (20.91% of the children at age four and 40.21% at age six) showed a profile that was more balanced in children's L1 and L2 use. L1 was used somewhat more than L2, but note that the use of L2 was also above the average of the whole sample at both ages. Although children showed slightly higher proficiency in their L2 than in their L1 at both ages, proficiency in both languages was around average. Therefore, this profile was defined as a ‘Dual L1 and L2 use, around average L1 and L2 proficiency’ profile.
Profile 3 (20.00% of the children at age four and 19.61% at age six) was characterized by (slightly) above average proficiency scores in both L1 and L2. This profile showed the highest proficiency scores compared to the other profiles, at both ages. Raw scores indicated that there is almost monolingual L1 use at home. This profile, therefore, was regarded as representing a ‘Dominant L1 use, relatively high L1 and L2 proficiency’ profile. Note that while experiencing a strong L1 support in the home situation, the L2 proficiency scores were above average compared to the other profiles. This is the largest distinction between profile 1 and profile 3; children assigned to profile 1 score around 0.8 to 1.0 standard deviation lower on both proficiency measures than children assigned to profile 3.
Finally, Profile 4 (10.00% of the children at age four and 9.80% at age six) was characterized by evidently more L2 than L1 use at home, especially at age 6. Moreover, raw scores showed that children in this profile obtained higher proficiency scores in L2 than in L1, especially at age 4, with L1 proficiency scores being (slightly) below average compared to the other profiles. The profile represented here, therefore, was termed the ‘Dominant L2 use, relatively high L2 proficiency’ profile. It was the smallest profile and showed the highest use of L2 at home compared to the other profiles.
Latent Transition Analysis
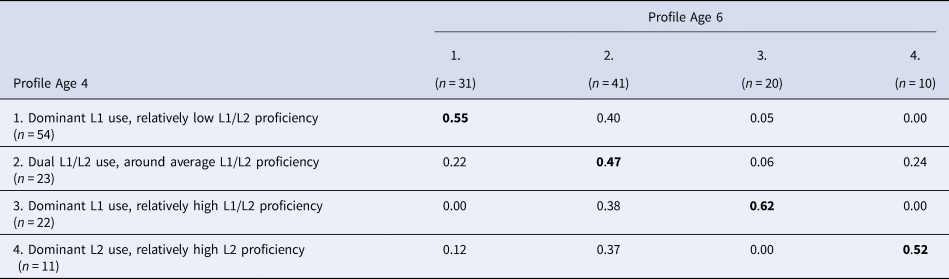
Next, we examined the transition probabilities, representing the likelihood to either maintain a particular profile or to move from a particular profile at age four to another profile at age six. The estimated transition and stability probabilities derived from LTA are presented in Table 5. The results show that the stability of maintaining the same profile over time was moderately low, indicating developmental changes in the bilingual profiles of the children in the period between age four and six.
Transition Probabilities from Age Four to Age Six.

Children assigned to profile 3 at age four (the Dominant L1 use, relatively high L1 and L2 proficiency profile) were most likely to be assigned to the same profile at age six (probability = .62). If they did change profile, children were assigned to profile 2 (the Dual L1 and L2 use, around average L1 and L2 proficiency profile) at age six (probability = .38). Most children assigned to profile 1 at age four (the Dominant L1 use, relatively low L1 and L2 proficiency profile) maintained the same profile at age six (probability = 0.55), but a substantial proportion was found to change to profile 2 (probability = 0.40). A similar pattern was found for profile 4 (the Dominant L2 use, relatively high L2 proficiency profile). Children were more likely to maintain the same profile (probability = .52), but children also had a probability of .37 to move to profile 2, though this only concerns three children. Hence, the number of children in profile 2 increased over time (at age four n = 23 and at age six n = 41), whereas the number of children in profile 1 decreased. Remarkably, a small percentage of children with profile 4 at age four also moved to profile 1 at age six (probability = .12). This concerned only one or two children and, thus, may be coincidental. No children assigned to profile 3 (the Dominant L1 use, relatively high L1 and L2 proficiency profile) at age four changed to profile 1 or to profile 4 at age six.
Relations with non-linguistic factors.
Multinomial logistic regression (MLR) was conducted to explore to what extent the non-linguistic factors SES and nonverbal intelligence predicted profile-membership at age four and age six. Profile 1 (the Dominant L1 use, relatively low L1 and L2 proficiency profile) was chosen as the first reference profile, since it was the largest profile group at age four. Additional analyses with other reference profiles were conducted to examine the contrasts with other profiles. The results showed that both SES and nonverbal intelligence predicted profile membership, but only at age four. Bilingual children with a higher SES were more likely to be assigned to the Dominant L2 use, relatively high L2 proficiency profile (OR = 2.03, p = .05, CI = 1.22–3.39) than to the Dominant L1 use, relatively low L1 and L2 proficiency profile. Moreover, bilingual children with a higher nonverbal intelligence were more likely to be assigned to the Dominant L1 use, relatively high L1 and L2 proficiency profile (OR = 1.53, p = .03, CI = 1.12– 2.10) than to the Dominant L1 use, relatively low L1 and L2 proficiency profile or the Dual L1 and L2 use, around average L1 and L2 proficiency (OR = 1.42, p = .05, CI = 1.05–1.95). No significant relations between SES, nonverbal intelligence and the four bilingual profiles at age six were found.
Discussion
The present study demonstrated a person-centred approach as an alternative to traditional variable-centred approaches to model the complexity of bilingualism in a group of immigrant children. First, we examined whether different bilingual profiles could be distinguished in a sample of Turkish–Dutch four- to six-year-olds. These profiles were based on the variation in language proficiency and language use in both the first (Turkish, here L1) and second language (Dutch, here L2). Second, we examined the changes in children's bilingual profiles from age four to age six, a period in which all children enrolled in Dutch language kindergarten. Third, we examined the relations of the bilingual profiles at both age four and six with the families’ socioeconomic status and children's nonverbal intelligence.
The present results confirm the heterogeneity and multidimensionality of the ‘bilingual experience’ (Baker, Reference Baker2011; Lonigan et al., Reference Lonigan, Goodrich and Farver2018; Luk, Reference Luk2015). The results are in line with the findings of Luk and Bialystok (Reference Luk and Bialystok2013) and Anderson and colleagues (2018b), showing that bilingualism involves at least four distinct and only moderately interrelated dimensions: degree of use of the two languages and proficiency in the two languages. Our latent profile analyses provided further confirmation. The heterogeneous sample revealed four profiles, similar for both age groups, which we labelled 1) Dominant L1 use, relatively low L1 and L2 proficiency, 2) Dual L1 and L2 use, around average L1 and L2 proficiency, 3) Dominant L1 use, relatively high L1 and L2 proficiency and 4) Dominant L2 use, relatively high L2 proficiency.
Profile 1 (Dominant L1 use, relatively low L1 and L2 proficiency profile) was the largest profile at age four, characterized by below average scores on both L1 and L2 proficiency measures, above average use of L1 and below average use of L2 in the home environment compared to the other profiles. Children assigned to profile 2 (Dual L1 and L2 use, around average L1 and L2 proficiency profile), encompassing the largest number of children at age six, showed around average proficiency in L1 and L2, and dual language use at home. Profile 3 (Dominant L1 use, relatively high L1 and L2 proficiency profile) was characterized by above average scores on both L1 and L2 proficiency measures and striking above average use of L1 and clearly below average use of L2 at home. Profile 4 (Dominant L2 use, relatively high L2 proficiency profile) was the smallest profile at both ages, and showed above average use of L2 and clearly below average use of L1 at home. Related to this, children assigned to this profile had above average L2 proficiency and slightly below average L1 proficiency at both ages.
Remarkably, both the more favourable profile 3 (with above average proficiency in both languages) and the more unfavourable profile 1 (with below average proficiency in both languages) were characterized by above average use of L1 at home. This may indicate that predominant use of L1 at home is neither a risk nor success factor in itself, but rather that other factors determine whether a child develops a more favourable or unfavourable bilingual profile (Hammer, Davison, Lawrence & Miccio, Reference Hammer, Davison, Lawrence and Miccio2009). The quality of L1 use, especially regarding lexical diversity and grammatical complexity, is a likely candidate to explain at least partly the difference between the two profiles (Leseman, Reference Leseman2000; Leseman et al., Reference Leseman, Henrichs, Blom, Verhagen, Grøver, Ucelli, Rowe and Lieven2019; Snow & Uccelli, Reference Snow, Uccelli, Olson and Torrance2009). Learning potential is another factor that could explain the difference between the two profiles, as will be further explored below.
Profile 2, the Dual L1 and L2 use, around average L1 and L2 proficiency, is the only profile that showed balanced use of both L1 and L2 in the home environment. The other profiles showed either a high degree of use of L1, and only limited use of L2, or the other way around. Note that balanced L1 and L2 use as in profile 2 could indicate that children received less input in each of their languages due to the fact that the time and interaction opportunities for exposure have to be divided between two languages (Leseman et al., Reference Leseman, Henrichs, Blom, Verhagen, Grøver, Ucelli, Rowe and Lieven2019; Place & Hoff, Reference Place and Hoff2011). This relates to the timely issue whether it is better for dual language development when a child is exposed to both languages to an equal degree from early on, or whether a period of intensive exposure to L1 is more beneficial, also in view of parents’ higher proficiency in L1. The findings regarding profile 3, the Dominant L1 use, relatively high L1 and L2 proficiency profile, seem to indicate that a high quantity of L1 exposure, assuming that the exposure is also of sufficient quality, can contribute to higher L1 and L2 proficiency, possibly through positive transfer (Cummins, Reference Cummins2008; Leseman et al., Reference Leseman, Henrichs, Blom, Verhagen, Grøver, Ucelli, Rowe and Lieven2019). More research is needed to identify the mechanisms that underly positive transfer between languages, such as quantity and quality of language input (Prevoo et al., Reference Prevoo, Malda, Emmen, Yeniad and Mesman2015; Sierens, Slembrouck, Van Gorp, Agirdag & Van Avermaet, Reference Sierens, Slembrouck, Van Gorp, Agirdag and Van Avermaet2019; Verhoeven, Voeten & Vermeer, Reference Verhoeven, Voeten and Vermeer2019).
The latent transition analysis revealed overall only moderate stability of the four profiles over time, indicating that, at least at this young age, children are likely to change profiles. The most stable profile was profile 3, indicating that high L1 and L2 proficiency can be maintained in a situation of relatively high L1 use. The exposed changes in profile membership are supported by the work of Anderson, Hawrylewicz and Bialystok (Reference Anderson, Hawrylewicz and Bialystok2018a) who found large differences in language use in bilingual children, young adults, and older adults, and by Collins and colleagues (Reference Collins, O'Connor, Suárez-Orozco, Nieto-Castañon and Toppelberg2014) who found substantial change in young children's dual language profiles during their first years in school. A likely explanation is that the enrolment in kindergarten at age four, introducing the children to a Dutch immersion context, profoundly influenced the language development of the children over the four profiles from age four to age six. Profile 1, the least favourable profile, included the largest group of children at age four, but at age six many children changed to profile 2, representing a more balanced L1 and L2 profile. A possible explanation of this pattern is twofold. First, probably due to enrolment in kindergarten, children's L2 proficiency improved, suggesting a compensating effect of kindergarten attendance (see Leseman, Mulder, Verhagen, Broekhuizen, van Schaik & Slot, Reference Leseman, Mulder, Verhagen, Broekhuizen, van Schaik, Slot, Blossfeld, Kulic, Skopek and Triventi2017, for a discussion on the effects of participating in high quality early education and care provision). This could also influence the language use in the home environment, leading to a gradual increase of the use of L2 (Leseman et al., Reference Leseman, Henrichs, Blom, Verhagen, Grøver, Ucelli, Rowe and Lieven2019; Prevoo et al., Reference Prevoo, Mesman, Van IJzendoorn and Pieper2011). Second, but more speculatively, the influence of kindergarten on family life may have resulted in improved quality of L1 use for children assigned to profile 1 at age four. For instance, by introducing new topics for conversation, new educational activities, and using more (specialized) academic language, as was found in another Dutch study with a similar sample (Prevoo et al., Reference Prevoo, Mesman, Van IJzendoorn and Pieper2011).
The current study and other studies have shown that the second language can become the dominant language of bilingual children after several years of consistent exposure to L2 at school (Collins et al., Reference Collins, O'Connor, Suárez-Orozco, Nieto-Castañon and Toppelberg2014; Montrul, Reference Montrul2012; Paradis & Jia, Reference Paradis and Jia2017). Importantly, all profiles demonstrated improvement of both L1 and L2 proficiency: although children improved their L2 proficiency more than their L1, there was no L1 proficiency loss. These findings are in line with Collins and colleagues (Reference Collins, O'Connor, Suárez-Orozco, Nieto-Castañon and Toppelberg2014), but are contrary to other studies documenting L1 loss (e.g., Kohnert, Yim, Nett, Kan & Duran, Reference Kohnert, Yim, Nett, Kan and Duran2005) in which dual language children often develop their L2 but suspend development of their L1 when they enter school. These contradictory findings might be explained by the language maintenance and language policy in families from different migrant backgrounds. Blom (Reference Blom2019) found differences in the L1 vocabulary development (i.e., maintenance of the first language) between children with a Moroccan background and children with a Turkish background in the Netherlands: Turkish-speaking participants improved their vocabulary over time, whereas Tarifit-speaking participants showed stagnation in their L1 vocabulary. These findings can be explained, at least partly, by the stronger language maintenance of the Turkish group in the Netherlands (Backus, Reference Backus, Bhatia and Ritchie2013).
The four profiles were associated with SES and nonverbal intelligence, as a general measure of learning capacity, at age four, but not at age six. At age four, consistent with findings from other studies (Deanda, Arias-Trejo, Poulin-Dubois, Zesiger & Friend, Reference Deanda, Arias-Trejo, Poulin-Dubois, Zesiger and Friend2016; Dixon et al., Reference Dixon, Wu and Daraghmeh2012; Hoff, Reference Hoff2013), bilingual children of relatively low SES families or with relatively low nonverbal intelligence were more likely to be assigned to profile 1, the Dominant L1 use, relatively low L1 and L2 proficiency. As was argued above, both profile 1 and profile 3 Dominant L1 use, relatively high L1 and L2 proficiency, showed above average use of L1 at home, yet differed strongly regarding children's proficiency in both L1 and L2. A possible explanation is that children's intelligence moderated language learning, since it was shown that children with higher intelligence scores were more likely to be assigned to the more favourable profile. More specifically, children with a higher general learning potential, as indicated by higher intelligence, may have learned more from language input at home and may have been better able to transfer conceptual knowledge and communicative competence to the second language than children with lower learning potential (see Sierens et al., Reference Sierens, Slembrouck, Van Gorp, Agirdag and Van Avermaet2019, for a discussion on linguistic interdependence theories and the role of language learning abilities). Finally, family SES was to a lesser extent associated with the profiles. Bilingual children from families with a higher SES were more likely to be assigned to a Dominant L2 use, relatively high L2 proficiency profile, than to a Dominant L1 use, relatively low L1 and L2 proficiency profile. This is in line with some previous research on the use of the dominant language of a society by immigrant groups and may reflect successful integration and social mobility through higher educational attainment (Hoff, Rumiche, Burridge, Ribot & Welsh, Reference Hoff, Rumiche, Burridge, Ribot and Welsh2014; Van Tubergen & Kalmijn, Reference Van Tubergen and Kalmijn2009). Note that we did not find that family SES influenced the assignment to the Dominant L1 use, relatively high L1 and L2 proficiency profile, which confirms the complex non-linear relationship between SES and language use (Dixon et al., Reference Dixon, Wu and Daraghmeh2012; Prevoo et al., Reference Prevoo, Mesman, Van IJzendoorn and Pieper2011; Scheele et al., Reference Scheele, Leseman and Mayo2010).
At age six, SES and nonverbal intelligence were not related to the four profiles. A possible explanation is again the compensating influence of kindergarten. At age six, the children participating in the current study had been intensively exposed to Dutch language, (pre)academic learning content and broader educational support by attending a 20 hours per week kindergarten programme for approximately two years, which may have dampened SES and intelligence-related differences in proficiency and use of L1 and L2 by improving children's proficiency in L2, on the one hand, and by stimulating parents to interact at a higher level of quality with their children, on the other hand. This corroborates the findings from Collins and colleagues (Reference Collins, O'Connor, Suárez-Orozco, Nieto-Castañon and Toppelberg2014), who found that the association between school-related factors and bilingual profiles increases over time as the child is more exposed to the school environment.
Limitations and future research
The present study has several limitations. First, only a limited set of language proficiency and language use measures could be used to model the heterogeneity and multidimensionality of bilingualism. To obtain a sufficiently large sample, existing data sets had to be merged on overlapping variables, which were receptive first and second language vocabulary and parent-reported information on children's language use at home. Although receptive vocabulary knowledge is the best single indicator of the language skills of a bilingual child (e.g., Hulstijn, Reference Hulstijn2011; Luo et al., Reference Luo, Luk and Bialystok2010), including other aspects of language proficiency, such as morpho-syntactic skills and productive vocabulary, could have enriched and strengthened the current findings. In addition, the measures of language use in the present study only focused on language use in the home situation in interaction with the mother. Moreover, the measures of language use were based on frequency ratings and were not sensitive enough to capture developmental shifts in the quality of language use. Although it can be assumed that in the (pre)school and kindergarten classrooms attended by the children only L2 was spoken, future research should examine the use of L1 and L2 across different contexts, individuals and activities, as research has shown that depending on interlocutors, contexts, and topics, different bilingual profiles can emerge (Anderson et al., Reference Anderson, Mak, Chahi and Bialystok2018b; Melzi et al., Reference Melzi, Schick and Escobar2017). In addition to the limited set of bilingualism measures, there was also limited information available about the home environment of the participants. Investigating family characteristics such as migration history, language proficiency of the parents, and the family language policy was beyond the scope of the current study, but should be taken into account in future research in order to better understand how the home environment can shape bilingual profiles and to examine the emerging bilingual profiles in different environments (Collins et al., Reference Collins, O'Connor, Suárez-Orozco, Nieto-Castañon and Toppelberg2014; Hoff, Reference Hoff2006; Sorenson Duncan & Paradis, Reference Sorenson Duncan and Paradis2020). Also, the sample size was relatively small for the advanced statistical modelling applied in this study. It should be noted, however, that, in contrast to the more traditional analytic methods, when conducting latent profile and latent transition analyses, statistical power is not only a function of the sample size, but also of the possibility to identify the optimal model based on multiple fit indices (Solari, Grimm, McIntyre, Zajic & Mundy, Reference Solari, Grimm, McIntyre, Zajic and Mundy2019). Nevertheless, future research should include larger samples to be able to draw statistically well-supported conclusions regarding the defining characteristics of profiles and the transitions over time.
Conclusions and implications
Despite these limitations, the present study provides a convincing case for the feasibility and relevance of a data-driven, person-centred profiling approach to bilingualism as it occurs in current linguistically diverse societies. The findings from correlational analyses and the latent profile analyses confirm that, in defining bilingualism, both language proficiency and language use are needed to capture the heterogeneous and dynamic nature of bilingualism. The findings also suggest that the identified bilingual profiles are associated with different prospects of further language development. Early identification of children with a less favourable profile can initiate well-timed targeted interventions to prevent delays. By including additional measures of proficiency and use in future research, as well as other, non-linguistic, characteristics of the child and his or her environment, and by applying longitudinal research designs, richer profiles of bilingualism and deeper insight in the processes underlying transitions between profiles over time can be obtained. These insights may inform education practice and family support programmes to the benefit of bilingual children.
The present study was not designed to examine the optimal conditions for young children's bilingual development. Nonetheless, a number of tentative implications in this regard can be derived. First, above average use of L1 at home is not a risk factor as such, but outcomes for children may critically depend on the quality of L1 use and the moderating effect of children's cognitive abilities. Second, enrolling in preschool and kindergarten might support children who are at risk for suboptimal language learning in both L1 and L2. Enrolling in early education programmes may have a double effect: increasing the use of and proficiency in L2, and improving the quality of L1 use at home.
Supplementary Material
For supplementary material accompanying this paper, visit https://doi.org/10.1017/S1366728920000383
Acknowledgements
This study uses data from the Development of Academic Language in School and at Home (DASH) project. The DASH project was funded by the Dutch National Science Foundation [NWO] (Grant number: 411-03-060).