


I. Introduction
A basic understanding of sea-ice development and its consequences for the coupled ocean-ice-atmosphere system in Antarctica requires answers to a number of fundamental questions. These questions deal with the rapid advance and retreat of the sea-ice cover during the annual cycle (summer minimum and winter maximum of sea-ice-covered ocean in Antarctica varies between 3 and 20 − 106 km2; Zwally and others, 1983) and the mass and energy budgets of atmosphere and hydrosphere that are related to these fluctuations.
So far, these questions have been mainly addressed through remote-sensing observations (e.g. Zwally and others, 1983), sampling of perennial sea ice during occasional summer expeditions (e.g. Reference Gow, Ackley, Buck and GoldenGow and others, 1987; Reference LangeLange, 1988), and near-shore investigations from a few over-wintering stations (e.g. Reference Allison, Tivendale, Akerman, Tann and WillsAllison and others, 1982). However, direct observations and sampling of the major part of the Antarctic sea ice, i.e. the sea-ice cover during winter conditions have been scarce. Only the use of ice-going research vessels in recent years has provided access to the winter sea ice in the polar regions. The Winter Weddell Sea Project 1986 (in the following abbreviated as WWSP’86) was the first such attempt, after an initial Soviet-American expedition (WEPOLEX; Reference Gordon and SarukhanyanGordon and Sarukhanyan, 1982) that reached lat. 61°30′S., to sample sea ice of the inner and southern Weddell Sea in Antarctica. During WWSP’86, we traversed the sea-ice cover on RV Polarstern approximately along the 0°meridian
Cruise track of the Winter Weddell Sea Project 1986. The insert map gives the general geographical situation of the sampling area. Symbols and dates at the beginning and end of the cruise track show the position of the ice edge at the respective dates. Shown are ice-station sites (open symbols) and station sites, selected for isotope analysis (closed, enlarged symbols). The numbers next to the closed symbols give the station number, i.e. the fourth to sixth symbols of the core number. The different symbols represent different genetic ice classes, which are derived from the textural analysis of sampled cores (Eicken and Lange, 1989; Reference LangeLange and others, 1989).

between long. 5°W. and 7°E. and between lat. 56° and 70°S. from July to September 1986 (Fig. 1).
First results of this expedition have shed light on a number of important issues regarding the development of sea ice in Antarctic waters. Direct measurements of ice thicknesses at numerous stations along the cruise track revealed that mean thicknesses for the greater part of the undeformed sea-ice cover in the Weddell Sea amount to only 0.5−0.7 m (Reference Wadhams, Lange and AckleyWadhams and others, 1987). This range lies significantly below earlier predictions, based on numerical model studies (Reference Hibler and AckleyHibler and Ackley, 1983), which estimated the thickness to be between 1 and 1.5 m for the same area as that covered by WWSP’86. The results of Wadhams and others, as well as measurements made during a second phase of WWSP’86 (Eicken and Lange, 1989), revealed that ice thicknesses increased little as the winter progressed. Thus, once a sea-ice cover is formed, little additional growth of congelation ice seems to occur before break-up and decay of the ice in spring and summer.
The second major result regards the processes that govern the rapid advance of Antarctic sea ice in fall and mid-winter. Based on continuous observations (Reference Casarini and MassomCasarini and Massom, 1987), as well as on detailed textural and physical investigations on ice cores retrieved during WWSP’86, Reference LangeLange and others (1989) described these processes as a chain of events that leads to extensive growth of sea ice within a few days. These processes, called the “pancake cycle”, start with formation of frazil ice in the open ocean at sub-freezing temperatures. Wind-induced wave motion leads to agglomeration of small disk-shaped aggregates within the grease ice cover, so-called “pancakes” (Weeks and Reference Ackley, Lange and WadhamsAckley, 1982). These grow and solidify to form larger and thicker units, sometimes comprising composite cakes where a number of pancakes are frozen together. Meanwhile, frazil continues to grow and thicken in the open water surrounding each pancake. Eventually, the thickness and density of the frazil suspension allows the pancakes to freeze together into a consolidated ice sheet, with frazil acting as a “glue” and itself freezing solid. This act of consolidation of pancake-frazil mix cannot occur unless the wave field is attenuated to a point where it can no longer keep the pancakes in relative motion. Our observations showed that this occurred about 260–270 km from the ice edge, this presumably being the width of the pancake field needed to attenuate the incoming waves adequately. The continuous sea-ice cover thus formed had a thickness of 0.4–0.7 m (Reference LangeLange and others, 1989), but with rafting to greater thicknesses.
As mentioned above, further growth below these rapidly formed floes appears to be minimal, leaving only leads and polynyas as places of new ice growth in the central and southern Weddell Sea. Ice growth in leads mostly proceeds in the “classical” fashion, starting with a thin layer of granular ice over a transition zone into an extended sheet of columnar ice. Thus, besides the floes that are formed in the pancake cycle and consequently consist primarily of granular ice of frazil origin, significant amounts of congelation ice with columnar texture are formed (Reference LangeLange and others, 1989). Based on the texture of ice cores collected during WWSP’86, Reference LangeLange and others (1989) and Eicken and Reference LangeLange (1989) defined genetic ice classes and gave their spatial distribution throughout the Weddell Sea. The spatial distribution of genetic ice classes in the observation area is compatible with the hypothesis that the pancake cycle represents the prime process of ice formation within the advancing ice edge and that subsequent new ice growth occurs mainly in short-lived leads and polynyas.
These results raise new questions, which are the subject of the present paper. Essentially motivated by the need to estimate the contribution of snow ice to the overall sea-ice cover (i.e. the layer of surface snow, which metamorphoses and solidifies in the presence of sea-water (Weeks and Ackley, 1982), in the following we will use the term “meteoric ice” for that part of a sea-ice floe which contains contributions from atmospherically derived ice, such as snow ice), we measured oxygen-isotope ratios (18O/16O) in selected cores collected during the first leg of WWSP’86 (Fig. 1). This question arises because the ice-thickness data revealed a slight increase in thicknesses of floes sampled during the northbound track towards the end of our cruise compared to thicknesses obtained along the southbound track earlier in the cruise. The increase in ice thicknesses could either have been caused by growth beneath existing floes or by the increased formation of snow ice that took place between our southward and homeward tracks. Since ice texture did not support the first hypothesis (lack of bottom columnar ice), δ18O measurements offered a promising means of proving the second alternative. This is possible because of the difference in the δ18O signature of snow versus sea ice (see below).
Thus, the more general question that arises is related to the role of the snow cover for the overall development of the sea-ice cover in the Weddell Sea (and in Antarctica). It is generally assumed that a snow cover will slow down sea-ice growth because of its influence on the transport of latent heat from the site of ice formation (the ice-floe bottom) to the surface (e.g. Reference Maykut and UntersteinerMaykut and Untersteiner, 1971). Because of the lower thermal conductivity of snow relative to sea ice (e.g. Reference LangeLange, 1985), a snow layer will lead to smaller ice-growth rates than those observed for a bare ice floe. However, formation of snow ice, i.e. the incorporation of a snow layer into the sea-ice column, results in a larger (effective) growth rate compared to the snow-free case. In order for this to happen, a number of prerequisites have to be met, which are discussed in the following sections.
Since we measured δ18O not only in the top sections, where snow ice was texturally defined, but also throughout the cores, the aims of our study can be extended to other, more general questions. The major problems addressed in the present paper can be summarized as follows:
(i) What is the contribution of snow ice to the overall thickness of sea ice in the Weddell Sea?
(ii) What is the distribution of δ18O relative to ice texture in individual cores?
While numerous δ18O measurements on cores from the inland ice of Antarctica and Greenland have been performed in recent years (see papers in Reference Oeschger and LangwayOeschger and Langway, 1989; Lorius and others, 1985; Reference RobinRobin, 1983), isotope analyses on sea-ice cores have been scarce. One of the first approaches to determining the isotopic composition of sea ice and the fractionation of light versus heavy stable isotopes was given by Reference Friedman, Schoen and HarrisFriedman and others (1961) and Reference Gow and EpsteinGow and Epstein (1972). Reference ArnasonArnason (1985, unpublished) used deuterium and δ18O to trace the origin of drifting Arctic sea ice. Reference Jeffries and KrouseJeffries and Krouse (1988) and Reference Jeffries, Krouse, Sackinger and SersonJeffries and others (1989) presented a systematic study on isotope composition and salinity structure of fast ice from northern Ellesmere Island, and Reference Souchez, Tison and JouzelSouchez and others (1988) presented data on a fast-ice core from Breid Bay, Antarctica. Reference Gow, Ackley, Buck and GoldenGow and others (1987) were the first to determine systematically δ18O in sea-ice cores from the western Weddell Sea, in order to assess the role of snow ice for the overall development of sea ice.
2. Materials And Methods
2.1. Measurements
Figure 1 gives the location of all ice-station sites during the first leg of WWSP'86 as well as the genetic ice class (for explanations, see Eicken and Lange, 1989; Reference LangeLange and others, 1989) determined at these sampling locations. Closed symbols denote coring sites, which were selected for isotope analysis. As can be seen, a fairly even distribution over the area under investigation has been achieved, thus providing information on sea-ice isotope composition throughout the east-central and south-eastern Weddell Sea.
Instead of taking equally spaced samples, sampling for isotope analysis was performed according to stratigraphic units. The assignment of these units is based on the ice texture of each core. Textural analysis includes visual inspection of continuous thick sections, frequently supplemented by detailed structural analysis on thin sections (Reference LangeLange, 1988). Each stratigraphic unit was sampled only once, cutting an approximate 200 ml sample from the central part of the unit in our Bremerhaven cold laboratory. The solid piece was put into a small zip-lock bag and was allowed to melt at room temperature. Immediately after melting, the water was poured into 100 ml bottles, filling them completely, and they were closed tightly. Samples were then shipped to Heidelberg, where they were analyzed with a commercial mass spectrometer following standard procedures. Measurement precision was typically ±0.05%. Salinities were determined on the same (melted) samples using a WTW salinometer, which gives direct temperature-compensated salinities at 20°C.
In the following, we will give 18O/16O ratios in the samples (index s) as 6 values (i.e. δ18O) relative to 18O/16O ratios of “standard mean ocean water” (abbreviated/indexed as SMOW):

Stable-isotope concentrations in precipitation vary as a function of several parameters, such as distance from the coast, altitude, or temperature (Reference Dansgaard, Johnsen, Clausen and GundestrupDansgaard and others, 1973). δ18O in Antarctic precipitation falls in the range between −20 and −60% (Reference Dansgaard, Johnsen, Clausen and GundestrupDansgaard and others, 1973). Measurements of δ18O in surface precipitation, close to the ice edge of the Filchner-Ronne Ice Shelf, revealed values between −25 and −29% (Reference Graf, Moser, Oerter, Reinwarth and StichlerGraf and others, 1988). Thus, it is expected that precipitation over the Weddell Sea will have increasing δ18O values ranging between approximately −25 and −10% for near-coastal sites and for sites with increasing distance from the shore, respectively (cf. Reference RobinRobin, 1983). Figure 2 gives two typical profiles of δ18O values as a function of snow depth (unpublished) measured on samples obtained on sea-ice floes in the western and inner Weddell Sea. As can be seen, the range of values agrees well with our assumption.
δ18O profiles as a function of snow depth on sea-ice floes in the western and central Weddell Sea at lat. 63°12′S., long. 53°W. (a) and lat. 69°34′S., long. 06°20′ W. (b), respectively.

Isotopic fractionation during the freezing of sea-water leads to enrichment of 180 in the ice phase. The equilibrium solid/liquid fractionation was determined as +2.7% by Reference Craig and HomCraig and Hom (1968). Recent measurements by Reference Beck and MuennichBeck and Muennich (1988) yielded a value of +2.8% for the same conditions. Thus, snow ice, even if “diluted” by sea-water, should have 8180 values significantly below those found in sea ice.
2.2. Estimates of the meteoric ice fraction in sea-ice cores
Despite the relatively unambiguous identification of snow-ice sections (i.e. the presence of meteoric ice) in a sea-ice core based on 18O measurements, textural identification of polygonal granular sections (i.e. sections with a texture that is indicative of snow ice) is often not as easily achieved. Thus, δ18O measurements help identify the meteoric contribution in sea-ice cores. In order to estimate quantitatively the fraction of meteoric ice in a given core, we assume that ice-core sections with negative δ18O values comprise a sea-ice fraction, fi , a snow (or meteoric) fraction, fs , and a sea-water fraction, fw . For each ice-core section and its salinity (=S) and δ18O (=δ) values, the following set of equations must hold:


In these equations, fi fs , and fw are unknown. Thus, in order to solve Equations (2)–(4), the following boundary conditions for the remaining variables are defined:


In our calculations, we assume a mean salinity of 34.45% for the winter mixed layer found in the Weddell Sea (Reference Gordon and HuberGordon and Huber, in press), salt-free precipitation and salinities of newly formed sea ice that are derived from our ice-core analyses (Reference Lange, Ackley and EickenLange and others, unpublished). For the δ values, we assume maximum fractionation for the sea-ice component, the range of δ values for precipitation given above, and a measured value of Weddell Sea winter water of 0.35% (Reference Schlosser, Bayer, Foldvik, Gammelsrod, Rohardt and MünnichSchlosser and others, 1989). Given the measured salinity and 8 value of a particular section (i.e. S and 6), we can estimate its fraction of meteoric ice (i.e. fs ) in this section. Using the minimal value of S-i and the maximum value of δs, will result in a lower limit for fs and vice versa.
By using Equations (2)–(4), we assume each ice-core section is a closed system, i.e. we neglect any possible losses of fluid phases during formation of the ice. Because some loss of salt (from the sea-water component) will occur during freeze-up and as a result of the sampling itself (e.g. brine drainage during core retrieval), the measured salinity represents a lower limit for the salinity value used in our equations. The loss of sea-water also implies an isotopic fractionation towards higher δ18O values. Thus, the measured value must be regarded as an upper limit of the value used in our approach. This means that the fraction of meteoric ice computed here represents a lower limit of the actually achievable value.
Profiles of δ18O (solid circles) and salinity (dashed line) as a function of depth in a sea-ice core of mainly congelation (a) and predominantly frazil ice (b), together with ice texture.

2.3. Conditions for flooding of sea-ice floes as a prerequisite of snow-ice formation
In order for snow ice to develop, a prerequisite is the flooding of a sea-ice floe and the infiltration of the snow layer by sea-water. This can be quantified by a simple hydrostatic balance for a snow-covered floe:


Equation (7) yields

Here, ρi, ρs, and ρw are the (mean) densities of sea ice, snow, and water, respectively; t, d, f, and s are the total ice thickness, the thicknesses of the ice floe below and above the water line, and the snow-layer thickness, respectively. For flooding to occur, f must approach zero (and thus d → t), hence Equation (9) becomes:

Thus, for ρw = 1.03 Mgm−3 and ρi = 0.91 Mg m−3. Equation (10) becomes:

For snow densities ρs of 0.2, 0.3, and 0.4 Mg m−3, s/t is found to be 1/2, 1/3, and 1/4, respectively.
In order to determine the potential for flooding in a given observational area, one needs to know mean values of snow and ice thicknesses, and of snow density. This will be addressed in section 3.3
3. Results
3.1. δ18O-depth profiles in relation to ice texture
Figure 3 gives typical examples of δ18O profiles for two cores representing the mainly congelation (a) and the predominantly frazil-ice class (b), respectively. Also given are the stratigraphy, i.e. ice texture as a function of depth and salinity-depth profiles for both cores. Despite the gross differences in genetic ice class, the δ18O profiles show remarkable similarities, starting at negative values in the top parts and approaching a δ18O value of 2% towards the bottom part of the cores. This is in contrast to the results of Reference Gow, Ackley, Buck and GoldenGow and others (1987), who virtually did not find any sections with negative δ18O in their cores. However, their range of positive δ18O values (+0.21 to +2.30%, averaging at +1.75%) agrees well with our findings.
An important result of our study is the (slightly) negative δ18O value for core sections not classified as polygonal granular (for an explanation of textural terms, see Eicken and Lange (1989); genetically, polygonal granular ice can be called snow ice in most cases). While strongly negative values are expected for pure snow ice, granular or columnar ice should have positive δ18O values because of the fractionation effect during freezing (see above). However, a mixture of surface precipitation, sea ice, and sea-water would readily explain the slightly negative δ18O concentrations (see above) that are found despite the difficulty in identifying such sections texturally. An alternative explanation would be the addition of precipitation to surface water that subsequently forms frazil ice. This process would lead to orbicular granular textures but leaves isotope concentration affected by the precipitation (i.e. negative values).
Figure 4 gives the δ18O profile and the stratigraphy of one of the few long ice cores retrieved during WWSP’86. Starting with the same sequence of δ18O values as the majority of our cores (cf. Fig. 3), there are two well-defined deviations to a slightly negative value at depths of about 0.7 and 2.4 m, corresponding to core sections texturally identified as orbicular granular and polygonal/ orbicular granular ice. This demonstrates the potential of 18O measurements in detecting contributions of meteoric ice in a sea-ice floe on the one hand, and in supporting and confirming the stratigraphie analysis on the other.
Profile of δ18O and ice texture as a function of depth in sea-ice core AN5221101.

Profile of δ18O and ice texture as a function of depth in sea-ice core AN5221501.

Profile of δ18O and ice texture as a function of depth in sea-ice core AN5223701.

As can be seen (Fig. 4), δ18O values vary significantly with varying ice texture. However, as demonstrated in the following figures, we hypothesize that a straightforward relation between single ice-textural units and their 18O concentrations cannot be identified. Figure 5 displays the same general trend of increasing δ18O values with increasing depth (i.e. parallel to the growth direction) as seen in Figure 4, despite the fact that the ice texture in core AN5221501 changes abruptly from columnar (0.13–0.28 m) to polygonal/orbicular granular (below 0.28 m).
Our hypothesis regarding the lack of clearly identifiable correlations between δ18O and ice texture is emphasized by the profile in Figure 6. This core (AN5223701; Fig. 6) most likely represents two rafted floes (above and below 0.23 m). The slightly negative δ18O value at the top of the second orbicular granular section probably indicates some meteoric ice contribution at the upper surface of the previously separate floe. While we would expect to see two independent δ18O profiles for each core section representing the originally unrafted floes, the measured values follow the same pattern as those found for single-unit floes. Extensive deformation and a high degree of rafting and ridging activity can be seen as a prerequisite for these composite floes. Observations during WWSP’86 clearly revealed the occurrence of such activities (Cassarini and Massom, 1987; Reference LangeLange and others, 1989).
The profiles shown in Figure 7 (AN5223401) represent a particularly interesting but puzzling observation. The core was retrieved from a refrozen lead, which showed clear signs of multiple (finger) rafting. Each of the orbicular granular-columnar sequences identified texturally most porbably depicts one slice of newly (and simultaneously) formed nilas, which subsequently became rafted to form the floe that was sampled. Thus, one would expect similar distributions of δ18O values for each combination of orbicular granular-columnar ice. However, while this might have been present initially (i.e. immediately after the rafting events), we observe the same steadily increasing δ18O values with increasing depth as in the other cores. Thus, post-deformational processes, such as redistribution of fluid phases in the composite floe, might have led to the observed δ18O profile. Another, less likely hypothesis, would be a change in δ18O values of the water during growth.
Profile of δ18O and ice texture as a function of depth in sea-ice core AN5223401.

Meteoric ice fractions in a sea-ice core in per cent of total ice thickness (a) based on model calculations (see section 2.2) for different combinations of the free parameters: ice-core section salinity (Si) and δ18O value for snow component (18Os) in a given core section (note that values are given in per cent and not in ppt). In (b) are given the fractions of sea-water, meteoric ice, and the sum of both components making up the sections with negative δ18O as computed for the minimum cases of Figure 8a.

3.2. Contribution of meteoric ice to the sea-ice cover
Using the formalism outlined in section 2.2, we estimated the contribution of meteoric ice (snow ice) to the total ice thickness of sampled floes. For ice-core sections with negative values of δ18O, we derived the snow fraction s, i.e. the mass fraction of meteoric ice in the considered ice-core section. Neglecting density differences between meteoric ice, sea ice, and sea-water (i.e. assuming a density of 1 Mg m−3), f s is multiplied by the ratio of the section length to the length of the core yielding the relative contribution of meteoric ice, Fm , to the total ice thickness. Where more than one section with negative δl8O is encountered, the individual contributions are added to yield the cumulative contribution Fm for the sampled core.
Figure 8a gives values for Fm for 12 of our cores, where we determined δ18O and salinities simultaneously (the other remaining cores are only incompletely sampled and are not included in the analysis). For each core, we give Fm for three different combinations of the “free” parameters Si and δ18Os. This yields a minimum, a standard, and a maximum value of Fm for Si and δ18Os being 7 and −25%, 10 and −17.5%, and 13 and −10%, respectively. Here, we regard a combination of 10 and −17.5% for Si and δ18Os as the most common values (cf. Fig. 2) found in the Weddell Sea, and thus representing a standard case. Also given are means and standard deviations of all available values.
As can be seen, there is a considerable scatter in the calculated values of Fm for the cores considered. It appears that a mean value of 3 ± 3% is a representative value for the contribution of meteoric ice to the total ice cover in the Weddell Sea. However, the complete effect of snow-ice formation on sea-ice growth includes the contribution of the sea-water fraction as well. Figure 8b gives the sea-water fraction for the minimum case (see above) along with the added sea-water-meteoric-ice fraction. As can be seen, even the smallest possible effect results in a significant fraction of an ice core (i.e. 7.1 ± 5.6% of the total ice cover) originating from snow-ice formation. Thus, we hypothesize that a mean ice thickness between 0.4 and 0.7 m (Reference Wadhams, Lange and AckleyWadhams and others, 1987) will result in 0.01–0.08 m of the total ice thickness being derived from the transformation of surface snow and sea-water to snow ice. We want to point out that, based on our procedure, this has to be regarded as the minimum contribution of meteoric ice to the total ice cover.
However, while the data can be regarded as representative for a significant part of the Weddell Sea, the sparse spatial resolution of our sampling somewhat limits the validity of this hypothesis. One means of gaining independent support lies in an estimate of the likelihood of flooding events on sea ice floes in the Weddell Sea, based on thickness and freeboard data. This will be addressed in the following section.
3.3. Potential for flooding events based on snow- and ice-thickness data
As outlined in section 2.3, an essential prerequisite for snow-ice formation is the depression of the snow-ice interface below the water line; i.e. a negative freeboard. The conditions required for this are given in Equation (11) in terms of snow density and snow and ice thicknesses.
As part of our field operations, we measured snow depths (at 1 m intervals) and snow densities along two perpendicularly crossing sections of about 20–25 m in length. Basic results of these measurements are given in Table I (Reference Ackley, Lange and WadhamsAckley and others, 1988). As a part of the thickness survey during the first leg of WWSP’86, about 4000 snow depths and ice thicknesses were measured at ice stations along the cruise track (for details, see Reference Wadhams, Lange and AckleyWadhams and others, 1987). The probability density function (=pdf) of all snow-depth data has a maximum at thicknesses between 0.06 and 0.15 m (Reference Wadhams, Lange and AckleyWadhams and others, 1987, fig. 13c). This range of thicknesses, in combination with a mean density of 0.3 Mg m−3 (cf. Table I) will lead to flooding (i.e. negative freeboard) for ice thicknesses π.45−0.6 m. This range corresponds to the already mentioned maximum in the pdf for ice thicknesses seen during WWSP’86 (Reference Wadhams, Lange and AckleyWadhams and others, 1987). Consequently, flooding should be a widespread phenomenon on sea-ice floes in the Weddell Sea. This is supported by our ice observations (Reference Casarini and MassomCasarini and Massom, 1987). It follows that snow-ice formation should indeed contribute significantly to sea-ice growth over the entire Weddell Sea (see above).
Snow depths and densities of antarctic sea ice

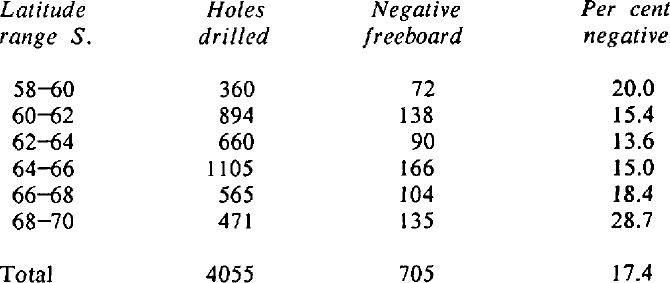
Additional support for this hypothesis is gained when measured freeboard heights are considered. Table II (Reference Wadhams, Lange and AckleyWadhams and others, 1987) gives the percentage of drilled holes with negative freeboard as a function of latitude. As can be seen, 705 (17.4%) out of a total of 4055 holes were found with the water line above the snow-ice interface.
Frequency of drilled holes with negative ice freeboards
This hypothesis is also supported on the basis of a different approach. Thickness changes, Δh/Δt, beneath an existing ice cover (assuming 100% ice concentration, i.e. no leads) are governed by (Reference Parkinson and WashingtonParkinson and Washington, 1979):

Here, L is the latent heat of melting (=302 MJ m−3), ki (=2 W m−1 K−1; Weeks and Ackley, 1982), and hi (=0.5 m) are mean thermal conductivity and mean thickness of the ice cover, respectively, and Tb (=271.2 Κ) and Ts are the temperatures at ice bottom and ice surface, respectively. Using a surface temperature Ts between −5° and −20°C (i.e. 268–253 K; this represents a typical range of surface temperatures observed during WWSP’86; Reference RabeRabe, 1987) and a value for the oceanic heat flow, F, between 2 and 40 W m−2 K−1, one can compute melting and freezing at the ice bottom, respectively (Fig. 9). Reference Hibler and AckleyHibler and Ackley (1983) used a value of 2 W m−2 K−1, while recent measurements during WEPOLEX (Reference Gordon, Chen and MetcalfGordon and others, 1984) suggested significantly larger values. Reference Gordon and HuberGordon and Huber (in press) concluded, based on an extensive survey during WWSP’86, that the winter mean oceanic heat flux lies at 25–30 Wm−2K−1 with a maximum of 41 W m−2 K−1.
Melting or freezing at the bottom of a sea-ice floe computed using Equation (12) for different combinations of surface temperature, Tsf, and oceanic heat flow, F (for details, see section 4).

Heat-flow values of this magnitude will result in melting or a very modest growth rate (Fig. 9). The observed growth rate of 0.4 cm d−1 (Reference Wadhams, Lange and AckleyWadhams and others, 1987) agrees well with this conclusion and implies mean surface temperatures in the range 258–260 K. However, as an alternative mechanism, we propose that snow-ice formation may be causing the observed thickening. This hypothesis, i.e. growth of the ice cover by snow-ice formation rather than by congelation growth, is supported by our textural analysis of retrieved ice cores. The majority of the mainly and predominantly frazil-ice cores, which represent the initially formed ice cover (via the pancake cycle), shows no additional congelation growth (i.e. ice with columnar texture) that could account for the increase in thickness.
In summary, these results strongly support the hypothesis that the snow cover in the Weddell Sea generally enhances the overall ice thickness rather than leading to decreasing growth rates throughout the austral winter months.
4. Conclusions
Our combined analysis on sea-ice cores from the winter Weddell Sea yields a number of unexpected results. The δ18O distribution in an ice core does not seem to be uniquely correlated with ice texture (cf. Figs 3–7). In general, we find an increase in δ18O values with increasing depth (i.e. direction of growth) in a core, regardless of the stratigraphy. The only exceptions are found in cores which represent two rafted floes. Here, deviations to decreasing (or negative) δ18O values (cf. Figs 4 and 6) are found close to the top parts of the individual floes. As expected, negative δ18O values are found in most of the ice-core sections of polygonal granular texture (snow ice). However, in many cases, negative values are also found in sections of orbicular granular texture. Explanations for these observations might lie in a post-deformational redistribution of heavy isotopes residing in fluid phases (brine) and in sections consisting of a meteoric ice (snow), sea-water, and sea-ice contribution to a particular ice-core section, but not showing any textural evidence for such a mixture.
We present the first quantitative estimate of snow ice to the Weddell Sea ice mass. While the meteoric-ice fraction in sea-ice cores obtained through our data and model calculations appears to represent only a moderate contribution, it nevertheless enhances the overall growth in the absence of appreciable congelation ice accretion after pancake-ice consolidation. This is strongly supported by our snow- and ice-thickness data (Reference Wadhams, Lange and AckleyWadhams and others, 1987). However, this hypothesis is in contrast to the common notion that a snow cover will lead to decreasing growth rates of a sea-ice cover. While our core data do not provide a sufficient spatial cover to generalize this statement, snow-thickness and snow-density data, as well as more numerous ice-freeboard measurements, allow extrapolation of this hypothesis to a major part of the Weddell Sea.
Akcnowledgements
We thank the officers and crew of RV Polarstern for help during the field program. We are grateful to K.O. Muennich for general support of this work and helpful discussions, and to C. Junghans (both at Universität Heidelberg) for performing the 18O measurements. We should like to thank P. Mursch and U. Vogel for technical assistance in the preparation of the sea-ice samples, and H. Hubberten and G. Meier (all at AWI Bremerhaven) for the 18O measurements on the snow samples. Constructive remarks by two reviewers have considerably improved the quality of our paper. M.A.L. and S.F.A. wish to acknowledge support by a NATO Collaborative Research Grant CRG 890452. P.W. acknowledges the support of the U.K. Natural Environmental Research Council. This is Alfred-Wegener-Institut für Polar- und Meeresforschung contribution 266.



