Introduction
Gentiana lutea L. (Gentianaceae) is a herbaceous perennial native to the mountains of Central, Eastern and Southern Europe. It grows in meadows and open slopes, usually on calcareous soils, at altitudes ranging from 800 to 2500 m. Rhizomes of the plant contain numerous biologically active substances such as iridoids, alkaloids, xanthones, flavonoids, phenol carbonic acids and anthocyanins used as a remedy for fever, hysteria, high blood pressure and also to prevent muscle spasms (Jensen and Schripsema, Reference Jensen, Schripsema, Struwe and Albert2002; Strashniuk et al., Reference Strashniuk, Les'kova, Zahrychuk, Mel'nyk and Kunakh2006).
Due to over-exploitation of the natural resources, G. lutea is treated as an endangered species under protection in most European countries, including Ukraine. The value of this medicinal plant and the potential demand for raw materials necessitate the assessment of its resources in Ukraine and finding possible ways for its preservation and restoration. To date, main populations of the species have been established and described in the Ukrainian Carpathians (Mayorova et al., Reference Mayorova, Grytsak, Terehova, Mel'nyk, Andreev and Drobyk2013). However, data on overall genetic resources and individual populations of G. lutea in Ukraine are still fragmentary (Mel'nyk et al., Reference Mel'nyk, Spiridonova, Andreev, Strashniuk and Kunakh2004; Mosula et al., Reference Mosula, Konvalyuk, Mel'nyk, Andreev, Bublyk, Drobyk and Kunakh2013; Mosula et al., Reference Mosula, Konvalyuk, Mel'nyk, Bublyk, Andreev, Drobyk and Kunakh2014). Nowadays, polymerase chain reaction (PCR)-based methods of molecular–genetic analysis provide one of the most effective tools for studying genetic variation in plants and animals. However, study of a new object requires a search for optimal molecular–genetic markers and evaluation of their efficiency.
A number of indices have been proposed to assess the efficiency of PCR primers intended to be used in genetic analysis. Polymorphism information content (PIC) was first suggested as a parameter to evaluate informativeness of marker loci (Botstein et al., Reference Botstein, White, Skolnick and Davis1980). Later, Powell et al. (Reference Powell, Morgante, Andre, Hanfey, Vogel, Tingey and Rafalski1996) used the same index calculated from the frequencies of individual polymorphic bands (expected heterozygosity, H e) along with multiplex ratio and marker index (MI) to evaluate the utility of different PCR-based marker systems. Prevost and Wilkinson (Reference Prevost and Wilkinson1999) have proposed resolving power (R p) as a new measure of the ability of primers or techniques to distinguish between genotypes and demonstrated that MI failed to correlate with this ability. Finally, Tessier et al. (Reference Tessier, David, This, Boursiquot and Charrier1999) suggested modification of PIC by calculating it from the frequencies of the different banding patterns generated by a primer and named it discriminating power (D L). Several studies on various organisms have compared different indices of primer efficiency by the correlation with the primer's ability to distinguish between the pairs of individuals in a given sample set (Prevost and Wilkinson, Reference Prevost and Wilkinson1999; Tessier et al., Reference Tessier, David, This, Boursiquot and Charrier1999; Saini et al., Reference Saini, Singh, Hussain and Sikka2010). The results of these studies indicate that discriminating power and resolving power (R p) have the highest correlation with the ability to distinguish individual genotypes. Furthermore, statistical approach proposed by Tessier et al. (Reference Tessier, David, This, Boursiquot and Charrier1999) was used recently to develop computer program for marker choice (Caroli et al., Reference Caroli, Santoni and Ronfort2011). The objectives of our study were to determine the usefulness of these indices in the assessment of informativeness of PCR primers and to select the set of molecular markers for efficient investigation of genetic diversity of G. lutea.
Materials and methods
Collection of plant materials
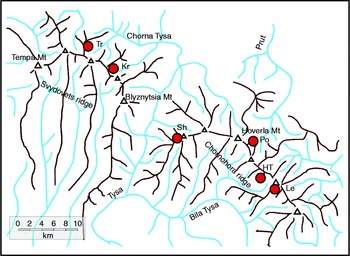
Thirty accessions of G. lutea used in the study to evaluate indices of primer informativeness were collected from two populations located on polonyna (mountain grassland) Krachuneska (Kr) and on the ridge slope between Troyaska and Tataruka Mountains (Tr) (Svydovets ridge, the Ukrainian Carpathians). These populations are growing in comparable ecological and geographical conditions as well as similar in population size and population density and mode of exploitation of natural environment (Mayorova et al., Reference Mayorova, Grytsak, Terehova, Mel'nyk, Andreev and Drobyk2013). To further evaluate the efficiency of selected primers on a larger sample, we used additional 56 samples of G. lutea from four other populations from the Chornohora ridge (Mayorova et al., Reference Mayorova, Grytsak, Terehova, Mel'nyk, Andreev and Drobyk2013) (Fig. 1).
Map of sampled populations of Gentiana lutea in the Ukrainian Carpathians (represented by grayed circles). Kr, polonyna Krachuneska; Tr, the ridge slope between Troyaska and Tataruka Mountains (Mts); Sh, Sheshul and Pavlyk Mts; Po, Pozhyzhevska Mt; HT, Hutyn Tomnatyk Mt; Le, polonyna Lemska.

DNA isolation and PCR amplification
DNA was isolated from fresh young leaves by the standard procedure (Rogers and Bendich, Reference Rogers and Bendich1985). In total, ten random amplified polymorphic DNA (RAPD) primers and nine inter simple sequence repeat (ISSR) primers earlier used in gentian studies (Twardovska et al., Reference Twardovska, Strashniuk, Mel'nyk, Konvalyuk and Kunakh2009; Konvalyuk et al., Reference Konvalyuk, Mel'nyk, Drobyk, Kravets, Twardovska and Kunakh2011), nine conserved DNA-derived polymorphism (CDDP) primers and seven pairs of resistance gene analog polymorphism (RGAP) primers described in Collard and Mackill (Reference Collard and Mackill2009) and Dong et al. (Reference Dong, Wei, Chen, Li, Nevo and Zheng2009), and five inter-retrotransposon amplified polymorphism (IRAP) primers kindly provided by Dr R. M. Kalendar (MTT/BI Plant Genomics, Institute of Biotechnology, University of Helsinki) were used in PCR. Primer sequences are listed in Table S1 (available online).
Amplifications were performed in Tertsyk MC2 thermocycler (Biotechnology, Russia). The 20 μl PCR mixture contained 20–30 ng of genomic DNA, 0.2 mM each dNTP (Fermentas, Lithuania), 1.25 U Taq DNA polymerase (AmpliSens, Russia), 0.5 μM of a primer, 1 × PCR buffer with (NH4)2SO4 and 2.5 mM MgCl2 (Fermentas, Lithuania). Reaction mix was layered with a drop of mineral oil to avoid evaporation. As a negative control for amplification, a reaction mixture containing sterile water instead of DNA was used. Each reaction was performed at least twice. The amplification conditions were as follows: RAPD-PCR: 94°C, 2 min, five cycles (94°C, 30 s; 37°C, 30 s; 72°C, 1 min); 35 cycles (94°C, 20 s; 37°C, 20 s; 72°C, 40 s); 72°C, 2.5 min; ISSR-PCR: 95°C, 2 min, 35 cycles (94°C, 30 s; 53°C, 30 s; 72°C, 1.5 min), 72°C, 2.5 min; IRAP-PCR: 94°C, 2 min, 35 cycles (94°C, 30 s; 58°C, 30 s; 72°C, 1.5 min), 72°C, 2 min; CDDP-PCR: 95°C, 2 min, 35 cycles (94°C, 30 s; 53°C, 60 s; 72°C, 1.5 min), 72°C, 2.5 min; RGAP-PCR: 95°C, 2 min, 40 cycles (94°C, 30 s; 53°C, 45 s; 72°C, 1 min), 72°C, 2.5 min.
The PCR products were separated by gel electrophoresis in 1.3 % agarose gel in 1 × sodium borate buffer (5 mM Na2B4O7, pH 8.5), visualized by staining with ethidium bromide and photographed under ultraviolet light.
Statistical analysis
Amplification products were scored as 1 (present) or 0 (absent) for individual plant samples and binary matrix was generated. Only distinct, reproducible fragments were scored.
To evaluate the effectiveness of a primer, resolving power (R p) (Prevost and Wilkinson, Reference Prevost and Wilkinson1999) and discriminating power (D L) (Tessier et al., Reference Tessier, David, This, Boursiquot and Charrier1999) were calculated as follows:
 $$\begin{eqnarray} R _{p} = \sum Ib , \end{eqnarray}$$
where Ib is the informativeness of a band that is determined based on the proportion of genotypes containing it (p):
 $$Ib = 1 - (2\cdot \vert 0\cdot 5 - p \vert ) $$
.
 $$\begin{eqnarray} D _{ L } = 1 - \sum p _{ i }^{2}, \end{eqnarray}$$
where p i is the frequency of the ith banding pattern generated by a primer. Also the number of non-differentiated pairs (ND) in a set of n genotypes was calculated for each primer from the frequency of generated banding patterns p i (Tessier et al., Reference Tessier, David, This, Boursiquot and Charrier1999):
 $$\begin{eqnarray} ND = ( n \cdot ( n - 1)/2)\cdot { \sum _{ i = 1}^{ n } }\, p _{ i }^{}\frac { n\cdot p _{ i } - 1}{ n - 1}. \end{eqnarray}$$
For a given combination of k primers, under hypotheses of independence of the formation of banding patterns for individual primers, this number (ND k ) is equal to:
 $$\begin{eqnarray} ND_{ k } = ( n \cdot ( n - 1)/2)\cdot { \prod _{ j = 1}^{ k } }\,{ \sum _{ i = 1}^{ n } }\, p _{ i }^{}\frac { n\cdot p _{ i } - 1}{ n - 1}. \end{eqnarray}$$
Proportion of polymorphic bands (P B), expected heterozygosity (H e) and Shannon index (S) were calculated using GenAlEx 6.5 software (Peakall and Smouse, 2006, Reference Peakall and Smouse2012). Jaccard's genetic distances (D j) were calculated and unweighted pair group method with arithmetic mean (UPGMA) trees were constructed using FAMD 1.3 (Schluter and Harris, Reference Schluter and Harris2006). The robustness of the UPGMA dendrograms was assessed with bootstrap analysis running 1000 iterations using the WinBoot software (Yap and Nelson, Reference Yap and Nelson1996).
Results
A total of 40 primers of different types were chosen for the study based on the results of preliminary assessment of quality and quantity of amplification products generated with template DNA from G. lutea (see online supplementary Table S1). These primers were applied to analyse the genetic variation in a set of 30 plants. As G. lutea belongs to the species with fragmented range which are at high risk for significant differentiation of the populations, we tried to account for the spatial character of the species distribution and included in this set plants originated from two isolated populations in the Svydovets ridge of the Ukrainian Carpathians.
Based on the generated PCR banding patterns, a binary matrix was constructed, and indices of informativeness were calculated for individual primers. In particular, for each primer, we determined the total number of generated bands (N t), the proportion of polymorphic bands (P B), the resolving power (R p), the discriminating power (D L) and the number of non-differentiated pairs (ND) (see online supplementary Table S1). N t ranged from 4 to 26 with a mean of 12.4, and P B ranged from 0 to 100% with a mean of 74.4%. A comparison of N t and P B values calculated for various subsets of plants reveals the differences among the individual populations and the total sample of plants. D L varied from 0 to 0.967 with a mean of 0.821, and R p had values from 0 to 12.3 with a mean of 5.5. The number of non-differentiated pairs ranged from 0 to 465, and only one primer was able to differentiate between all analysed genotypes (see online supplementary Table S1).
There was only moderate correlation between R p and D L (r= 0.611, P= 0.01), that can be explained by the specificity of distribution of polymorphic bands, in particular by the fact that the products of the primers that have a large difference between R p and D L showed mainly between-population differences, while their within-population variation was quite low. Considering the moderate correlation between R p and the number of non-differentiated pairs (r= 0.610, P= 0.01) compared with direct relationship between D L and ND, we excluded it from further analysis and selected primers based on the D L value.
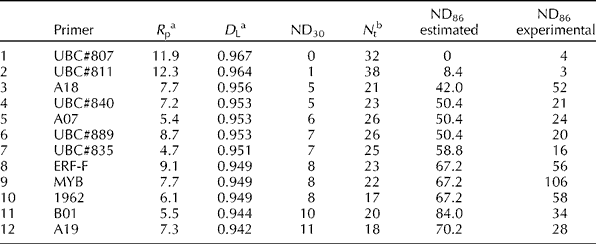
In total, 12 primers with the largest values of D L were chosen (Table 1). These included five ISSR, four RAPD, two CDDP and one IRAP primers. Primer UBC#807 allows discrimination of all plants from two populations under study, while the others can be used for this purpose in a combination of two or three.
Primers with the highest values of discriminating power (D L) selected for the use in population genetic studies of Gentiana lutea

R p, resolving power; ND30, experimental value number of non-differentiated pairs determined for the sample of 30 plants; N t, total number of generated bands; ND86, ND for the sample of 86 plants estimated from the frequencies of banding patterns generated in the sample of 30 plants (ND86 estimated) or determined experimentally (ND86 experimental).
a Value calculated for the sample of plants of two populations (n= 30).
b Value calculated for the sample of plants of six populations (n= 86).
To analyse the influence of the number of used markers on variation of the measures of genetic diversity, we compared their values calculated for the sample of plants from two populations using all primers or various combinations of primers with the largest D L as follows:
-
(1) 40 primers – all primers used in the study;
-
(2) 12-D L – UBC#807; UBC#811; A18; UBC#840; A07; UBC#889; UBC#835; ERF-F; MYB; 1962; B01; A19;
-
(3) 10-D L – UBC#807; UBC#811; A18; UBC#840; A07; UBC#889; UBC#835; ERF-F; MYB; 1962;
-
(4) 5-D L – UBC#807; UBC#811; A18; UBC#840; A07;
-
(5) 3-D L – UBC#807; UBC#811; A18;
-
(6) 1-D L – UBC#807.
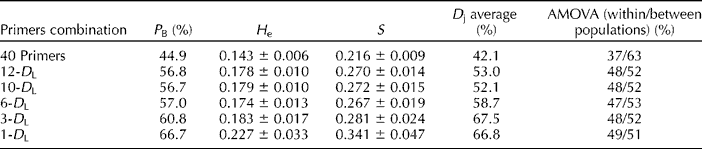
For each of the primer combinations, the main indices of genetic diversity (P B, H e, S and D j) were calculated, and analysis of molecular variance (AMOVA) was performed (Table 2). The H e ranged from 0.143 to 0.227 and the S varied between 0.216 and 0.341, when different primer combinations were used. The use of primers with the highest D L values in all cases resulted in increased genetic diversity indices compared with all primers, apparently due to the growth of the portion of highly polymorphic primers. The values of the indices also slightly increased with the further reduction of number of primers used in analysis, with the exception of small decrease in H e and S observed when using combination of six primers. However, this variation was insignificant when using different primer sets, except for the combination 1-D L.
Measures of genetic diversity in two populations of Gentiana lutea (average data) obtained using different combinations of primers with the highest values of D L

P B, proportion of polymorphic bands; H e, expected heterozygosity; S, Shannon index; D j, Jaccard's genetic distances; AMOVA, analysis of molecular variance.
AMOVA revealed significant genetic divergence of the populations, the difference between populations accounted for no less then 50% of total genetic variation. Decrease in the number of primers from 40 to 12 or less led to the change in distribution of genetic diversity towards the growth of variation within population. This is obviously associated with a specific distribution of polymorphic bands revealing mainly the differences among populations, which seem to be generated mostly by the primers with small percentage of polymorphic fragments. Nevertheless, the results of AMOVA did not vary significantly when using different number of selected primers (Table 2). Therefore, the use of any number of primers from 3 to 12 for assessment of genetic diversity is expected to give the comparable results.
To further test the informativeness of selected primers, as well as the effectiveness of discriminating power (D L) as an index of primer informativeness, we used them to analyse a set of 86 G. lutea plants from six populations from the Svydovets and the Chornohora ridges of the Ukrainian Carpathians. For each primer, we compared the experimental number of non-differentiated pairs with the value estimated from the frequencies of banding patterns generated in the set of 30 plants (see ND86 in Table 1). The estimated value was greater than the experimental one for most of the primers with the exception of UBC#807, A18 and MYB. An increase in the total number of fragments and proportion of polymorphic fragments resulted from the inclusion of additional plants of other populations in the study may be one of the reasons for this. We found strong correlation (r S= 0.75, P= 0.05) between the number of non-differentiated pairs of plants estimated from the analysis of polymorphism in the sample of plants from two populations (n= 30) and experimental value obtained for the sample of plants from six populations (n= 86). These results support the effectiveness of discriminating power as an index for evaluation of primers as well as demonstrate high informativeness of selected primers.
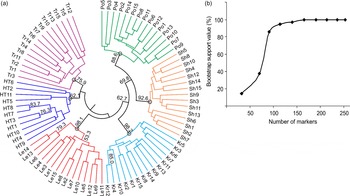
To determine the minimum number of primers (markers) required to resolve genetic relationships among G. lutea accessions from six populations, we constructed the UPGMA dendrogram based on the matrix of D j and estimated bootstrap support for key nodes, using for the analysis the data from different number of markers (Fig. 2(a)). Pairwise genetic distances between individual plants were calculated from the data generated using selected primers with the highest D L values. The analysis started with the primer UBC#807, and then the number of markers was gradually increased by adding data from successive primers listed in Table 1. Samples from the individual populations were grouped in the dendrogram together into clearly separated clusters. There was also no obvious grouping of populations from the same mountain ridge even in the case of relatively small distance between them.
(a) Relationships among 86 Gentiana lutea genotypes of six populations estimated from the data of 91 markers generated by three most informative primers (UBC#807; UBC#811; A18). The tree was constructed using the unweighted pair group method with arithmetic mean (UPGMA) algorithm based on Jaccard's genetic distances between individuals. Bootstrap values, calculated based on 1000 replicates, are presented for the six nodes of interest (circled). Bootstrap values greater than 50% are also shown. (b) Relationship between the number of markers used in analysis and the average bootstrap support across six key nodes including individual populations on UPGMA dendrogram. For the description of abbreviations, refer Fig. 1 legend.

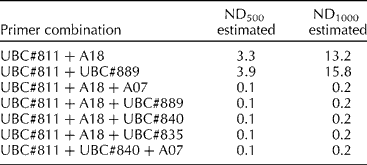
Bootstrap support was calculated for six key nodes that represent the clusters of individual populations. Relationship between the number of markers used in the analysis and the average bootstrap support across the key nodes is shown in Fig. 2(b). The average bootstrap value increased as the data were added to the analysis, and bootstrap support for all nodes of interest approached 90% even when the first three primers producing 91 markers in total were used, while six primers providing 166 markers gave the bootstrap support above 99%. Thus, only three selected primers with the highest D L generate the number of polymorphic PCR markers sufficient to assign the G. lutea plants to their population of origin with accuracy of more than 85%. Calculations made from the data of discriminating power show that combination of any three primers with the highest D L, under assumption of independence of the primers pattern, is theoretically enough to discriminate between all genotypes in a set of about 1000 G. lutea plants (Table 3).
Theoretical efficiency of various primer combinations calculated under hypothesis of independence of their patterns for 500 and 1000 accessions

Discussion
As a result of the study, we have selected the effective primers for the use in population genetic analysis of a rare plant species G. lutea and demonstrated their utility for the assessment of genetic diversity and analysis of genetic structure of the species populations. Several types of PCR-based markers were chosen for the study, including those that can be directly associated with protein coding regions of functionally important genes (such as CDDP and RGAP primers that are targeting conserved sequences of disease resistance genes and stress response genes). Our choice of the primers was based on consideration of possible use of the PCR-based marker system developed for ecogenetical investigations and studies on the adaptive genetic variation associated with environmental conditions.
Two indices were used to evaluate informativeness of individual primers, resolving power (Prevost and Wilkinson, Reference Prevost and Wilkinson1999) and discriminating power (Tessier et al., Reference Tessier, David, This, Boursiquot and Charrier1999). Both of them take into account the distribution of polymorphic alleles in studied set of genotypes. While R p is related to the distribution of individual amplified fragments, D L is calculated from the frequencies of banding patterns generated by a primer. Comparative analysis of the data revealed significant yet only moderate relationship between these indices as well as between R p and the number of non-differentiated pairs. This is primarily due to the fact that the R p calculation does not take into account potential non-independent distribution of bands in profiles of individual plants when the generation of one of the fragments is strongly associated with the presence of the other. The discriminating power is free from this limitation and directly associated with the number of pairs non-differentiated by a primer. The obtained results indicate that the resolving power is not always a reliable index of primer informativeness, namely the ability to discriminate between the different genotypes. This is especially true in the case of multilocus markers. The same conclusion was done by Saini et al. (Reference Saini, Singh, Hussain and Sikka2010) as a result of comparison of several different measures of PCR primers efficiency. They found that D L was the most effective index of primer informativeness in selection of molecular markers for identification of mung bean varieties. This index was also used successfully to develop algorithm and computer software for selection of minimal sets of molecular markers for accessions and variety identification (Caroli et al., Reference Caroli, Santoni and Ronfort2011; Fujii et al., Reference Fujii, Ogata, Shimada, Endo, Iketani, Shimizu, Yamamoto and Omura2013). Moreover, Fujii et al. (Reference Fujii, Ogata, Shimada, Endo, Iketani, Shimizu, Yamamoto and Omura2013) showed that the use of discrimination power in calculations may significantly accelerate computation speed when a large number of markers and varieties are involved.
Informativeness of the primers that were selected based on D L value was further confirmed using a larger set of plants from six populations located on two mountain ridges separated by a river valley of the Ukrainian Carpathians. Comparison of the number of non-differentiated pairs experimentally estimated and theoretically calculated from the frequencies of banding patterns revealed remarkable agreement between these values. Moreover, for some primers, the real number of non-distinguishable pairs turned out to be less than expected. These results indicate that discriminating power may be used to evaluate the informativeness of primers intended for the use in assessment of genetic diversity of the species. It allows selecting primers, which can be used both to identify individual genotypes and to differentiate between individual populations.
In total, 12 primers with the highest values of D L were selected for the use in further studies. However, calculations made from the data of discriminating power show that as little as three of these primers are enough to differentiate individual genotypes in a group including as many as 1000 G. lutea plants. Moreover, we have demonstrated that the use of different number of selected primers from 3 to 12 gives comparable measures of genetic diversity. Nevertheless, it should be mentioned that the values of such indices as the H e, S and genetic distance between individuals depends largely on the informativeness of used markers. In particular, when the most informative primers were used, these indices were 21–58% higher than when all the 40 screened primers were included in the analysis. This emphasizes the need to consider measures of informativeness of markers applied in the analysis when comparing estimates of genetic diversity made in different studies.
The analysis of relationship between the number of markers used in the study and the average bootstrap support for key nodes on dendrogram of 86 plants from six populations showed that the number of bands produced by three of the primers with the highest D L was sufficient to give bootstrap values over 85%, but with the use of six primers the average bootstrap value exceeded 99%. Obviously, an increase in the number of analysed genotypes will also require an increase in the number of primers used in the analysis. The optimal number of markers for use in molecular genetic analysis depends also on the goal of the study. For assessment of genetic diversity, surveys of population structure, genetic relatedness or assignment studies, there is usually an optimal number of markers that provide adequate statistical significance for obtained results and further increase in the number of markers does not necessarily improve the results of analysis. On the other hand, a search for loci exposed to natural selection or associated with a specific trait requires the use of as many markers as possible. Thus, a minimal set of three to six selected primers can be sufficient for quick assessment and subsequent monitoring of genetic diversity of G. lutea populations, depending on the sample size and degree of differentiation between populations, while the rest of the primers with the D L values above 0.8 may be used for ecogenetic surveys.
On the whole, the results of our preliminary studies carried out with selected primers demonstrated moderate level of genetic diversity within the samples from two populations as well as clear differentiation of all studied populations. This is evidenced by the data of AMOVA according to which among-population variation accounts for over 50% of total variance and grouping of the samples from individual populations in UPGMA dendrogram into the distinct clusters. In the future, we plan to conduct a more detailed analysis of genetic variation in the populations of G. lutea considering population and environmental parameters.
Supplementary material
To view supplementary material for this article, please visit http://dx.doi.org/10.1017/S147926211400104X
Acknowledgements
We thank Iryna Petrusha (Foreign Languages Department, Institute of International Relations, Kyiv National Taras Shevchenko University) and Volodymyr Adonin (Institute of Molecular Biology and Genetics of NAS of Ukraine) for assistance in translating the text into English. This study was financially supported by the National Academy of Sciences of Ukraine through the Targeted interdisciplinary programme of scientific research ‘Fundamentals of molecular and cellular biotechnology’ and from the Ministry of Education and Science of Ukraine in a framework of the project ‘Physiological, ecological and biotechnological bases of some Gentiana L. species conservation in vitro and in situ’.