

1. Introduction
People are motivated to understand the world around them, and for good reason. Having a functional model of how systems operate can lead to improved material outcomes. This awareness can be as minor as knowing how to make a pot of coffee, or as major as knowing which foods are nauseating—or even deadly. In all sorts of situations, it pays to know. However, people often act on what they think they know, which is imperfectly correlated with what they actually know. It is arguably better for a person to be calibrated and recognize what they don’t know, than to be miscalibrated and think they know more than they do. For example, it is better to admit to not knowing how to use a coffeemaker than to cause the machine to malfunction. Similarly, it is better to skip a meal you could be allergic to than to end up in the emergency room—or morgue. While it pays to know, it can pay more to know what one knows. This reality makes overconfidence particularly consequential and suggests that people should maximize knowledge calibration. Yet, people seem readily equipped to be miscalibrated: to fool themselves into thinking, they understand the world more than they really do. One example, and the focus of this manuscript, is the illusion of explanatory depth.
The illusion of explanatory depth occurs when a person overestimates their understanding of a topic (Rozenblit & Keil, Reference Rozenblit and Keil2002). This applies to various topics, including mechanical devices like toilets and zippers, and natural phenomena such as how snow forms and how earthquakes occur. However, certain topics, such as knowledge of the world’s capital cities, seem to be immune (Mills & Keil, Reference Mills and Keil2004; Rozenblit & Keil, Reference Rozenblit and Keil2002). These exceptions distinguish the illusion from general overconfidence (see Moore & Healy, Reference Moore and Healy2008).
When a person holds an illusion of explanatory depth, they can expose it by attempting to explain how the target phenomenon (of the illusion) works. For instance, if a person overestimates their knowledge of zippers, then having them explain how zippers work may reduce their estimate. This might be because the act of explaining forces the person to recognize the gaps in their knowledge of what they are explaining (Mills & Keil, Reference Mills and Keil2004; Rozenblit & Keil, Reference Rozenblit and Keil2002; Vitriol & Marsh, Reference Vitriol and Marsh2018). In turn, this constrains the person’s tendency to overestimate knowledge. Consider how the illusion is demonstrated empirically. In a standard procedure, people rate their knowledge of some phenomenon (e.g., how a zipper works), then attempt to explain how the phenomenon works (e.g., how a zipper attaches two pieces of material together), and then re-rate their knowledge of the phenomenon. The observed effect is that understanding ratings are lower after explaining compared to before.
There are several proposed mechanisms for why people tend to overestimate their knowledge of a phenomenon. We will address only some. When information is socially desirable to know, people are more likely to overestimate the degree to which they know it (Gaviria et al., Reference Gaviria, Corredor and Rendon2017; but see Rozenblit & Keil, Reference Rozenblit and Keil2002, for an opposing perspective). For example, people overestimate their knowledge of how inflation works more than their knowledge of how the stock market works, as knowledge of how inflation works is judged to be more socially desirable (Gaviria & Corredor, Reference Gaviria and Corredor2021). People may overestimate their understanding of a device, on the other hand, because they focus on its visible parts and neglect its hidden parts or because they mistake knowing what an object does for knowing how it works (Rozenblit & Keil, Reference Rozenblit and Keil2002).
Construing an object abstractly rather than concretely may also increase a person’s initial knowledge estimate as the comparatively lower fidelity of the abstract construal is likely to obscure gaps in their knowledge (Alter et al., Reference Alter, Oppenheimer and Zemla2010). Alternatively, people might overestimate their knowledge because they mistake having access to knowledge (e.g., having a cellphone with access to the internet) with holding knowledge (Rabb et al., Reference Rabb, Fernbach and Sloman2019). The illusion is complex, and the variety of mechanisms that may contribute to it underscore its intricacy.
Despite not definitively understanding how it works mechanistically, researchers continue to examine the consequences of exposing an illusion of explanatory depth (e.g., Cadario et al., Reference Cadario, Longoni and Morewedge2021; Crawford & Ruscio, Reference Crawford and Ruscio2021; Littrell et al., Reference Littrell, Meyers and Fugelsang2022; Meyers et al., Reference Meyers, Turpin, Bialek, Fugelsang and Koehler2020; Sloman & Vives, Reference Sloman and Vives2022). This is likely based on the intuitive plausibility of the assumptions underlying the illusion. One assumption, noted above, is that explaining makes people recognize the gaps in their knowledge of the phenomenon that they are explaining, and this exposes the illusion of explanatory depth. This claim is often found in the literature. For example, Vitriol and Marsh (Reference Vitriol and Marsh2018) state that ‘… trying to explain a phenomenon reveals to participants how little they actually understand about the workings of that phenomenon…’ and Mills and Keil (Reference Mills and Keil2004) note that ‘…when explaining how this might work, the participant recognizes a lack of awareness of the mechanism’. The basic idea is that explaining something makes us recognize that our knowledge of that thing is not as deep as previously thought. We term this the ‘specificity principle’.
The specificity principle has high face validity. The reader can probably recall a time when they suddenly felt less knowledgeable of a topic after trying to explain it. However, the principle also raises an interesting question: Is the illusion only exposed by explaining the specific phenomenon for which the illusion is held? The principle suggests the answer is yes, unless we expect people to generalize their experience of being ignorant about one phenomenon to another. This struck us as unlikely. For example, after failing to explain how a zipper works, we would expect a person to question their knowledge of zippers but not their knowledge of natural events (and vice versa). Also, people are often unaware of their biases (e.g., Pronin et al., Reference Pronin, Lin and Ross2002) and might not generalize perceptions of bias without that bias being explicitly described as broad or pervasive (Gretton, Reference Gretton2017). Generalization is also inconsistent with the dearth of robust far-transfer effects in which a person’s training in one area, such as chess, supposedly increases their capabilities in other areas, like working memory or concentration (Detterman, Reference Detterman, Detterman and Sternberg1993; Kassai et al., Reference Kassai, Futo, Demetrovics and Takacs2019; Sala & Gobet, Reference Sala and Gobet2017; cf. Bart, Reference Bart2014). In other words, people are not very good at transferring skills and knowledge from one context to another. This casts further doubt on people’s ability to correct their overestimation of one phenomenon after explaining a different one.
Recent work from our lab suggests that people may indeed transfer their feelings of ignorance to a phenomenon other than the one explained. We demonstrated that people revise their opinions on economic issues when exposed to professional economists’ perspectives rather than random members of the public (Meyers et al., Reference Meyers, Turpin, Bialek, Fugelsang and Koehler2020). This effect was observed specifically after participants failed to explain how the issue worked, in contrast to situations where no explanation was required. For example, failing to explain how trading with China affects the U.S. economy led to greater revision of opinion on the issue when provided the consensus among professional economists than when provided identical consensus among members of the public. Counterintuitively, we also found the same pattern when participants had previously been asked to explain unrelated phenomena such as how recycling works in a modern U.S. city and how a helicopter takes flight. That is, regardless of what was explained, explaining led participants to revise more to experts than the public. This suggests the possible existence of a ‘breadth principle’ wherein the illusion of explanatory depth can be exposed by explaining something other than the target of the illusion, contra the ‘specificity principle’.
Empirical research on learning provides additional evidence supporting the possibility of a breadth principle. Explaining a topic is often a more effective way to improve learning than other methods, such as reading the material twice (Chi et al., Reference Chi, De Leeuw, Chiu and Lavancher1994; Williams & Lombrozo, Reference Williams, Lombrozo, Ohlsson and Catrambone2010a; Wong et al., Reference Wong, Lawson and Keeves2002). This is in part because explanation promotes generalization, as it motivates a person to identify the underlying structure that unifies phenomena (Williams & Lombrozo, Reference Williams and Lombrozo2010b). Participants who explained why an item may belong to a certain category were more likely to detect the subtle rules that determine category membership than those who provided a careful description of the item (Williams & Lombrozo, Reference Williams and Lombrozo2010b). In a category learning task, explanation increases the chance of discovering the rules of category membership. However, in an illusion of explanatory depth task, generalization may increase the likelihood of recognizing the overestimation of one’s knowledge. Therefore, when attempting to explain a phenomenon, a person may generalize their sense of ignorance about that phenomenon to their general knowledge (i.e., questioning knowledge of one phenomenon transfers to other phenomena). Although this mechanism does not favor one principle over the other, it provides a mechanistic explanation for how a breadth principle could operate.
If the illusion of explanatory depth is based on the breadth principle rather than the specificity principle, the implications go beyond the illusion of explanatory depth literature. For example, if a student fails to explain a concept in one subject (e.g., Chemistry) and generalizes their feelings of ignorance to what they think they know overall, they may be more open to engaging with unrelated subjects (e.g., philosophy readings), at least temporarily, to the extent that they were previously overconfident (Meyers et al., Reference Meyers, Turpin, Bialek, Fugelsang and Koehler2020). This effect may exist more broadly, such that explanation could be an effective, nonconfrontational technique for challenging someone’s beliefs and reducing their confidence in those beliefs.
Given the promising benefits of establishing a breadth principle for education and belief change and our previous observation of similar downstream consequences (e.g., opinion revision to expert consensus) when exposing both topic-relevant and -irrelevant illusions, we aimed to systematically test whether similar upstream consequences (e.g., reporting less understanding of a phenomenon than originally believed) would also occur. One way to test this is to have participants re-evaluate their understanding of items they previously rated but did not explain. To the best of our knowledge, this had not been attempted before.
After completing this work, we became aware of an unpublished manuscript by Roeder and Nelson (Reference Roeder and Nelson2015), who explored the same question as ours. They conducted three experiments with methods similar to ours, especially their Experiment 2, and found that people reported knowing less about one phenomenon after attempting to explain another. For instance, explaining how a national flat tax might work led to a reduction in reported understanding of how to institute merit-based pay for teachers. However, they found mixed results as to whether explaining the same phenomenon or explaining a different one is more effective for exposing the illusion. One limitation of their work is that their experiments did not include a no-explanation control condition. Although they could compare participants who explained the same or different phenomena, they could not compare them to those who did not explain anything. It is possible that merely providing two ratings would lead to a reduction in reported understanding due to conversational norms (e.g., ‘I exaggerated my first rating of understanding’; Schwarz & Bless, Reference Schwarz, Bless, Martin and Tesser1992). Research on the initial elevation bias also suggests that ratings on subjective measures are often higher when first assessed compared with subsequent re-ratings, even without an intervention (Shrout et al., Reference Shrout, Stadler, Lane, McClure, Jackson, Clavél, Iida, Gleason, Xu and Bolger2018). Our work, primarily Experiments 2 and 3, which included a no-explanation comparison condition, thus extends the work of Roeder and Nelson (Reference Roeder and Nelson2015). We therefore believe our work represents the strongest test of whether attempting to explain a phenomenon can lead to reporting knowing less about another. We will further discuss Roeder and Nelson (Reference Roeder and Nelson2015) in the general discussion.
2. Experiment 1
2.1. Methods
The materials, data, and analysis script for each experiment are available on the Open Science Framework (OSF) website (https://osf.io/6huwq/). We preregistered each experiment. The preregistration for this experiment can be found on the OSF (https://osf.io/jvfhe). All experiments reported in this manuscript received ethics clearance by the University of Waterloo’s Office of Research Ethics (ORE#43203).
2.1.1. Participants
Following our preregistered plan to obtain 90% power to detect a within-subjects effect of d = 0.2, we recruited 240 participants via Mechanical Turk. The participants were residents of the United States or Canada, had a HIT approval rating of at least 99%, were over the age of 18, and passed a two-question prescreening questionnaire prior to beginning the experiment (Littrell et al., Reference Littrell, Risko and Fugelsang2021). All experiments reported in this paper followed these inclusion criteria. See Table 1 for descriptions of participant demographics in all three experiments.
Participant demographics in each experiment

Note: The response options for each demographic variable except for age are contained in the table. Age was an open-ended response. The ethnicity columns do not sum to 100. Any deviation reflects a combination of nonresponses and a small amount of rounding error.
2.1.2. Procedure
We modified a standard illusion of explanatory depth task to test the specificity principle. We will first explain the standard task and then highlight our modifications.
The standard task comprises three phases. In Understanding Rating 1, participants assess their understanding of how various mechanical devicesFootnote 1 work on a scale from 1 (very little understanding) to 7 (very thorough understanding). Prior to rating, participants receive instructions on using the scale.Footnote 2 Subsequently, participants rate their understanding of each provided device. After rating, participants proceed to the Explanation phase. They are prompted to explain, in as much detail as possible, how one of the devices works. Sometimes, they are prompted to explain more than one device. After explaining, participants enter Understanding Rating 2, where they re-rate their understanding of the explained item(s) only. For instance, if a participant initially rated their understanding of how a zipper, a can opener, and a speedometer work, but was only prompted to explain the can opener, Understanding Rating 2 would focus solely on their understanding of the can opener. After re-rating understanding for the relevant item, the task concludes. Our expanded task followed the same three-phase process, with minor modifications to Understanding Rating 1 and Understanding Rating 2. In Understanding Rating 1, we omitted the scale orientation information and instead instructed participants to rate their understanding of the six devices with no further instruction (see Table 2 for the instructions used in each experiment and Table 3 for the list of stimuli used in each experiment). The Explanation phase remained unchanged, where participants explain the functioning of one of the devices they had just rated. In Understanding Rating 2, participants re-rated their understanding of all the devices they had previously rated in Understanding Rating 1, rather than only the device they explained. The rating of each device took place on a single experiment page, with the devices presented in a random order. These were the sole distinctions between our expanded task and the standard task.
Primary task instructions

Note: The italicized Understanding Rating instructions were additionally included in Experiments 2 and 3. The control condition required participants to replicate the text given in an image. This text’s length approximates the average length of written explanations in our prior research. Experiment 1 did not contain a control condition.
Phenomena used in Experiments 1–3

Note: We obtained all ‘mechanical device’ and ‘natural phenomena’ items from Rozenblit and Keil (Reference Rozenblit and Keil2002, Experiments 1–6 and Experiment 10, respectively). We obtained ‘political/economic system’ from Meyers et al. (Reference Meyers, Turpin, Bialek, Fugelsang and Koehler2020).
Following the expanded task, participants rated the general similarity between all possible combinations of item pairs, on a scale from 1 (not at all similar), to 5 (extremely similar). Finally, participants provided demographic information, and the experiment concluded.
2.2. Results
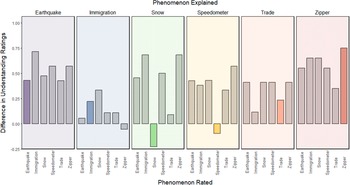
We deviated fromFootnote 5the preregistration protocol to present a simpler analysis.Footnote 3 After attempting to explain how a device works, participants reported knowing less about the device, t(239) = −4.62, p < .001.Footnote 4 However, participants also reported knowing less about the device after attempting to explain how a different device works, t(239) = −10.53, p < .001. In other words, participants reported more knowledge of a zipper (and other devices) before explanation compared to after. Table 4 presents the means and standard deviations of each Understanding Rating across conditions, including the effect size of the within-subjects comparison of the understanding ratings. The larger effect size for the General condition suggests that the reduction in understanding of, for example, a zipper (device) was somewhat greater when something other than a zipper was explained, which is an interpretation consistent with Figure 1. We caution against such an interpretation. This is because understanding ratings for some items appear to decrease more when the same device is explained, and others decrease more when a different device is explained. This can be observed in Figure 2, which displays the average difference in understanding ratings for each Phenomenon Rated by Phenomenon Explained.
Summary statistics of understanding ratings by condition

Note: Within each experiment, across conditions, participants rate the same six phenomena. Participants were randomly assigned to either the Explanation or the Control condition. The further levels of the Explanation condition (Specific, General) were within-subjects, and hence have the same n value. Because only one item was explained, the Explanation – Specific cell has only one phenomenon to be rated that fits the specific criterion (the one explained), whereas the Explanation – General cell has five phenomena to be rated that fit the general criterion (the ones not explained) and the Control cell has six phenomena to be rated (nothing explained). This means there are five times as many observations in Explanation – General and six times as many observations in Control compared to Explanation – Specific. This has implications for the variance of each condition, as there will be less variance in conditions with more observations. Rating 1 represents Understanding Rating 1. Rating 2 represents Understanding Rating 2. Each rating was made on a scale from 1 (little understanding) to 7 (very thorough understanding).
Mean difference in understanding ratings aggregated across phenomena for each condition (Control = dark, green-colored bars; E – General, which stands for ‘Explanation – General’ = teal-colored bars; E – Specific, which stands for ‘Explanation – Specific’ = light, blue-colored bars) across each experiment. This figure displays the differences in understanding ratings between two time points (Understanding Rating 1 – Understanding Rating 2) for each condition, with each bar representing the mean difference. A positive value indicates a reduction in understanding ratings over time. There was no control condition in Experiment 1.

The difference in understanding ratings for each Phenomenon Rated by Phenomenon Explained. The difference in understanding ratings reflects Understanding Rating 1 minus Understanding Rating 2. A larger value represents a greater reduction in reported understanding of the phenomenon. The panels (and respective participants) are separated by the randomly assigned Phenomenon Explained. Each gently colored panel represents one of the phenomena which is correspondingly labeled at the top of the panel. Each participant was asked to explain how their assigned phenomenon worked. As each participant rated all six phenomena regardless of what they explained, each Phenomenon Rated has a difference-score in each of the plots. Notably, whenever the Phenomenon Rated matched the Phenomenon Explained, the bar is appropriately colored (and all nonmatching phenomena are gray colored). The difference score for the phenomenon quartz watch when zipper was explained was .00 and so is not visible in the plot.

Table 5 displays the mean and standard deviations of the similarity ratings of each phenomenon. We did not find an effect of similarity on the reduction in understanding across explanation types (see Supplementary Material). This might be due to the devices being rated as generally similar. However, an ANOVA revealed that participants judged at least some of the device pairs (e.g., zipper and helicopter) as less similar than other device pairs (e.g., speedometer and quartz watch), F(14, 3346) = 39.46, p < .001.
Mean (SD) of similarity ratings between all device pairs

Note: Each device pair was judged on a 1 (not at all similar) to 5 (extremely similar) scale.
2.3. Discussion
Participants reported knowing less about how a device works after attempting to explain it, and this effect was also observed when they attempted to explain a different device. Importantly, the reduction in reported knowledge was similar regardless of whether the participants explained the same or a different device. For example, participants reported a reduced understanding of speedometers after explaining how they work, as well as after explaining how a piano produces noise, how a sewing machine works, or how a quartz watch keeps track of time. We found no evidence that the similarity between devices predicted the reduction of reported knowledge.
Despite item variations in similarity, we found no relationship between device pair similarity and understanding rating differences. This unexpected finding challenges the assumption that explaining a device’s operation exposes knowledge gaps. For example, while a zipper and a sewing machine share properties likely revealed during explanation, the same is not true for a zipper and a piano key. Our similarity judgments focused on general resemblance rather than functional similarity. Exploring the latter may yield different outcomes. Given the secondary focus on item similarity and cost considerations, subsequent experiments excluded similarity judgments.
Experiment 1 did not include a control condition, such as a condition where participants make two judgments without an intervening explanation task. This leaves room for alternative explanations for our observed effects. One such explanation is that providing a second judgment could inherently lead to a reduction in reported understanding. In making a second judgment, a participant may contemplate the device more deeply. This deeper reflection could reveal knowledge gaps, causing a drop in self-perceived understanding due to reconsideration. This draws parallels with the two-response paradigm often employed in reasoning experiments (Thompson et al., Reference Thompson, Prowse Turner and Pennycook2011), wherein participants first provide a speeded ‘intuitive’ response and then are given unlimited time to provide a second ‘reflective’ response. Often, the additional time to reflect leads to a participant changing their answer (Newman et al., Reference Newman, Gibb and Thompson2017; see also Shrout et al., Reference Shrout, Stadler, Lane, McClure, Jackson, Clavél, Iida, Gleason, Xu and Bolger2018). Thus, the reported reduction of understanding across judgments may have little to do with the explanation process and instead be the product of reasonable adjustments made after having additional time to reflect. This concern also applies to the work of Roeder and Nelson (Reference Roeder and Nelson2015). On the other hand, this concern is inconsistent with the illusion failing to apply to all domains of knowledge (Mills & Keil, Reference Mills and Keil2004; Rozenblit & Keil, Reference Rozenblit and Keil2002) as well as the usually null effects produced by various control conditions previously implemented (Crawford & Ruscio, Reference Crawford and Ruscio2021; Fernbach et al., Reference Fernbach, Rogers, Fox and Sloman2013; Kleinberg & Marsh, Reference Kleinberg and Marsh2020; Zeveney & Marsh, Reference Zeveney, Marsh, Papafragou, Grodner, Mirman and Trueswell2016). Because our design is meaningfully different from the designs that previously implemented a control condition, we cannot meaningfully rely on these previous findings. Therefore, we will attempt to rule out this explanation as well.
Another possible explanation is that participants’ interpretation of the understanding rating scale changes after the explanation task (Ostrom & Upshaw, Reference Ostrom, Upshaw, Greenwald, Brock and Ostrom1968; Petty & Wegener, Reference Petty and Wegener1993; Schwarz & Bless, Reference Schwarz, Bless, Martin and Tesser1992). During the pre-explanation judgment, participants are unlikely to consider understanding as including their ability to explain the precise causal chain of how the device works. However, a causal chain is what they are asked to provide when probed for an explanation. During the post-explanation judgment, participants may hold an updated definition of understanding, such that our results could reflect a change in participants’ interpretation of the scale between the two ratings. This is especially plausible, as we largely replaced the scale-rating instructions that are normally included, which could have otherwise prevented this potential issue. Therefore, in a preregistered Experiment 2, we attempt to replicate the results of Experiment 1 while ruling out the two aforementioned alternative explanations.
3. Experiment 2
3.1. Methods
Experiment 2 used the same procedure as Experiment 1, with an added between-subjects control condition and a clarified set of rating-scale instructions. This experiment was preregistered on OSF (https://osf.io/h3trk).
3.1.1. Participants
Following our preregistered plan to obtain 95% power to detect a within-subjects effect of d = 0.2, we recruited 327 participants via Mechanical Turk.
3.1.2. Procedure
We made three changes to the procedure of Experiment 1. First, we added a between-subjects control condition (see Table 2). In this condition, instead of explaining how a device works, participants reproduced a paragraph of text manually into a text box (the paragraph of text was contained in an image and could not be copied and pasted).Footnote 6 The text passage was descriptive in nature, detailing a room in a home, and reproducing it did not require any effort from the participant beyond reading and typing the exact words (i.e., no explanation of any sort was generated). Second, we added more detail to the understanding rating scale instructions to reduce the likelihood that the scale would be interpreted differently during the post-explanation judgment. These instructions included a sentence stating that when rating understanding, the participant should consider their ability to produce an explanation of the casual chain of how the device works. These changes can be reviewed in Table 2. Third and finally, we removed the similarity ratings. This produced a 2 (writing condition: control/experimental; between-subjects) × 2 (time: pre-explanation/post-explanation; within-subjects) mixed design.
3.2. Results
Consistent with Experiment 1, we deviated from the preregistration protocol to present a simpler analysis. After attempting to explain how a device works, participants reported knowing less about the device, t(155) = −3.92, p < .001. However, participants also reported knowing less about the device after attempting to explain how a different device works, t(155) = −7.08, p < .001. In other words, participants reported more knowledge of a zipper (and other devices) at time 1 (pre-explanation) compared to time 2 (post-explanation). This is observed in Figure 3. Surprisingly, participants who did not explain anything also reported knowing less about the device, t(171) = −5.63, p < .001. This suggests that some portion of the reduction in understanding is not attributable to having explained something. Importantly, the reduction in understanding was significantly greater both when the specific phenomenon was explained, t(198.18) = 1.69, p = .046,Footnote 7 and when a different phenomenon was explained, t(240.95) = 3.53, p < .001, compared to when nothing was explained. The reduction in reported knowledge in the control condition was half the size of the reduction in the explanation conditions. The results are also consistent across phenomena. Compared to when no explanation was required, understanding of a phenomenon dropped more both when the specific phenomenon was explained, t(5) = −2.40, p = .031, and when a different phenomenon was explained, t(5) = −7.07, p < .001.
The difference in understanding ratings for each Phenomenon Rated by Phenomenon Explained. The difference in understanding ratings reflects Understanding Rating 1 minus Understanding Rating 2. A larger value represents a greater reduction in reported understanding of the phenomenon. The panels (and respective participants) are separated by the randomly assigned Phenomenon Explained. Each gently colored panel represents one of the phenomena which is correspondingly labeled at the top of the panel. Each participant was asked to explain how their assigned phenomenon worked. As each participant rated all six phenomena regardless of what they explained, each Phenomenon Rated has a difference-score in each of the plots. Notably, whenever the Phenomenon Rated matched the Phenomenon Explained, the bar is appropriately colored (and all nonmatching phenomena are gray colored).

3.3. Discussion
Consistent with Experiment 1, participants reported knowing less about how a device works after attempting to explain it. Interestingly, they also reported knowing less about how a device works after attempting to explain how a different device works. For instance, participants reported knowing less about speedometers after attempting to explain how they work, but they also reported knowing less about speedometers after attempting to explain how a piano produces noise, how a sewing machine works, or how a helicopter flies. Participants who copied a block of irrelevant text instead of explaining a device also reported lower understanding. However, the reduction in reported understanding was greater when something was explained compared to when nothing was explained.
Experiment 2 calls into question two alternative explanations for these results. We examined whether the reduction in understanding was due to participants reinterpreting the understanding scale after explanation. Despite adding further detail to the instructions to minimize this possibility, participants still reported lower understanding of the devices after attempting explanation. We further assessed if the universal drop in understanding was just an effect of rendering a second judgment. While double judgment led to decreased reported understanding, it didn’t wholly account for the observed effect.
So far, our findings hint that the subject of explanation might be insignificant in revealing an illusion of explanatory depth, based on our studies with mechanical devices. We hypothesized that explaining unrelated phenomena, such as snow formation, could prompt someone to reassess their knowledge about something distinct, like a zipper’s mechanism. Alternatively, this illusion could be domain-specific, suggesting that its revelation occurs at a domain level. This implies that trying to explain any mechanical device (e.g., a sewing machine’s function) might expose an illusion about another mechanical device (e.g., a zipper), but not for unrelated phenomena (e.g., snow formation). Likewise, attempting to clarify one natural phenomenon (e.g., earthquakes) might dispel illusions about other natural phenomena (e.g., snow formation), but not about different domains (e.g., zippers). We explored these conflicting predictions in our preregistered Experiment 3.
4. Experiment 3
4.1. Methods
This experiment was preregistered on the OSF (https://osf.io/hvqes).
4.1.1. Participants
Following our preregistered plan to obtain approximately 90% power to detect a within-subjects effect of f = 0.1 (approximately equivalent to d = 0.2), we recruited 264 participants via Mechanical Turk.
4.1.2. Procedure
We made a single modification to the procedure of Experiment 2. We replaced four of the six device items with four items from two different domains of knowledge (see Table 3). The domains and items were natural phenomena (items: ‘How snow forms’, ‘How an earthquake occurs’) from Rozenblit and Keil (Reference Rozenblit and Keil2002), and political systems (items: ‘How trade with China affects the average U.S. citizen’, ‘How legal immigration affects the U.S. job market’) drawn from Meyers et al. (Reference Meyers, Turpin, Bialek, Fugelsang and Koehler2020).
4.2. Results
Consistent with the prior experiments, we deviated from the preregistration protocol to present a simpler analysis. Participants claimed lesser knowledge about a phenomenon post-explanation, t(118) = −1.76, p = .040, and even after they explained a different phenomenon, t(118) = −6.11, p < .001. Generally, explaining a different phenomenon led to lesser self-reported understanding (refer to Table 4), yet Figure 4 shows this effect is not consistent. Interestingly, as in Experiment 2, even non-explainers reported diminished understanding across the two ratings, t(144) = −3.62, p < .001, but this drop was steeper among those who attempted an explanation, t(195.43) = −2.85, p = .002. The results are also consistent across phenomena. Understanding of a phenomenon dropped more when a phenomenon was explained compared to when no explanation was required, t(5) = −6.26, p < .001.
The difference in understanding ratings for each Phenomenon Rated by Phenomenon Explained. The difference in understanding ratings reflects Understanding Rating 1 minus Understanding Rating 2. A larger value represents a greater reduction in reported understanding of the phenomenon. A negative value represents an increase in reported understanding. The panels (and respective participants) are separated by the randomly assigned Phenomenon Explained. Each gently colored panel represents one of the phenomena which is correspondingly labeled at the top of the panel. Each participant was asked to explain how their assigned phenomenon worked. As each participant rated all six phenomena regardless of what they explained, each Phenomenon Rated has a difference-score in each of the plots. Notably, whenever the Phenomenon Rated matched the Phenomenon Explained, the bar is appropriately colored (and all nonmatching phenomena are gray colored).

4.3. Discussion
We replicated the results of Experiments 1 and 2 using a set of items spanning three knowledge domains. Participants claimed lesser understanding of a phenomenon after trying to explaining that phenomenon—or a different one. For instance, knowledge claims about zippers dropped after explaining either how they work or how unrelated phenomena like speedometers, snow formation, or earthquakes work. Similarly, copying irrelevant text instead of explaining also lowered self-reported understanding, albeit the reduction was larger when explanation was involved.
5. General discussion
After attempting to explain how a zipper works, participants reported a decreased understanding of a zipper. They also reported a decreased understanding of a zipper after attempting to explain how helicopters fly (Experiments 1 and 2), how speedometers work (Experiments 1–3), how snow forms (Experiment 3), and several other phenomena. They adjusted their understanding for phenomena other than zippers in this manner too, including helicopters, sewing machines, and snow. It was unclear if explaining a specific phenomenon resulted in a larger knowledge claim reduction than explaining a different one. These results are in line with the findings of Roeder and Nelson (Reference Roeder and Nelson2015). Interestingly, participants also reported a decreased understanding of the zipper when they transcribed a block of descriptive text instead of attempting to explain it. However, the reduction in understanding was even greater when participants attempted to explain any phenomenon, regardless of whether it was the same or different than the zipper. These findings have important implications for understanding the functioning of the illusion of explanatory depth and the role of explanation in exposing it. Moreover, this study suggests that explanation may be an effective non-confrontational debiasing technique.
Our findings, which are generally consistent with those of Roeder and Nelson (Reference Roeder and Nelson2015), challenge a narrow model that posits the illusion only applies to a single phenomenon and can only be exposed by failing to explain how that particular phenomenon works. While this narrow model seems reasonable—we typically do not expect people to report knowing less about how snow forms after explaining how a speedometer works—our data do not support it. Hence, we must consider alternative models.
One alternative model suggests that the illusion of explanatory depth applies specifically to individual phenomena but is exposed generally. In other words, while the illusion might apply to different phenomena individually, attempting to explain just one phenomenon exposes a broader set of illusions held. According to this model, a person’s lack of knowledge about one phenomenon is generalized to other phenomena. This could result in a temporary increase in intellectual humility (Porter et al., Reference Porter, Elnakouri, Meyers, Shibayama, Jayawickreme and Grossmann2022), where people recognize the extent of their ignorance about the explained phenomenon (Meyers et al., Reference Meyers, Turpin, Bialek, Fugelsang and Koehler2020), which they then extend to their knowledge of other phenomena. For example, failing to explain how a zipper works might lead someone to question their understanding of how snow forms because they associate a general feeling of ignorance with the rest of their knowledge. This model does not view the illusion as an expression of general overconfidence, although reductions in confidence might occur alongside the exposure of the illusion. We refer to this model as the ‘linked illusions model’.
Another model suggests that the illusion represents a manifestation of general overconfidence and not a distinct phenomenon. According to this model, the illusion broadly applies, meaning that no domain of knowledge is immune to it at baseline. This model also assumes that failing to explain just one phenomenon should expose the entire illusion. We refer to this model as the ‘general overconfidence’ model.
The linked illusions model and general overconfidence model differ in the material that the illusion applies to and in the material that can expose the illusion. This raises the question of whether the illusion acts at a more general level applying to all or most phenomena, or at a more specific level applying only to certain phenomena. While the illusion is traditionally considered a specific type of overconfidence separate from general overconfidence, as it has been observed to predominantly apply to phenomena with a rich causal structure (e.g., how a speedometer works; Mills & Keil, Reference Mills and Keil2004; Rozenblit & Keil, Reference Rozenblit and Keil2002), it has also been observed in domains lacking such structure (e.g., how to administer a flat tax; Alter et al., Reference Alter, Oppenheimer and Zemla2010; Fernbach et al., Reference Fernbach, Rogers, Fox and Sloman2013). Therefore, it is unclear whether the illusion is an expression of general overconfidence. If there is not a privileged group of phenomena immune to the illusion, then the linked illusions model and the general overconfidence model are indistinguishable given how the illusion is usually assessed. Future research could use mechanical devices and procedures as stimuli to investigate this further, as procedures have appeared robust to the illusion (Mills & Keil, Reference Mills and Keil2004; Rozenblit & Keil, Reference Rozenblit and Keil2002, Experiment 8). For example, people do not report a lower understanding of how to make chocolate chip cookies after explaining the procedure. So, people could be asked to explain procedures, such as how to make chocolate chip cookies, to test the boundary conditions of our findings.Footnote 8
Our findings also highlight the need for control conditions in examinations of the illusion of explanatory depth. In the control conditions of Experiments 2 and 3, we found a significant but small reduction in judged understanding. This suggests that some portion of the observed reduction in understanding is not due to explaining anything. Despite being a very small effect (i.e., d = 0.10), repeated measurement might account for some explanatory depth effects published to date. For instance, it is possible that the effects of reflecting on one’s explanatory ability (stopping just before the actual explanation would be generated) can be largely explained by the act of providing two ratings (Johnson et al., Reference Johnson, Murphy and Messer2016). This could be because people tend to take advantage of the opportunity to change their answer after having additional time for reflection (Pennycook et al., Reference Pennycook, Trippas, Handley and Thompson2014; Thompson et al., Reference Thompson, Prowse Turner and Pennycook2011). It may also be because people’s understanding of the response scale (their understanding of the word ‘understanding’) shifts across ratings (see Ostrom & Upshaw, Reference Ostrom, Upshaw, Greenwald, Brock and Ostrom1968; Petty & Wegener, 1993). However, neither mechanism can fully account for why the process of explanation reduces self-reported understanding. Thus, future research should explore to what extent reductions in self-reported understanding are caused by processes other than explanation. One possibility is that due to conversational norms, a person may assume there is a specific reason why they are being asked the exact same question again (e.g., ‘I exaggerated my first rating of understanding’; Schwarz & Bless, Reference Schwarz, Bless, Martin and Tesser1992). Alternatively, the phenomenon might relate to the finding that the average of two guesses tends to be better than one guess alone (Vul & Pashler, Reference Vul and Pashler2008). If people initially overestimate their knowledge, then a second guess may be lower than the first. This does not suggest that the second guess is more accurate, but rather that the person’s true knowledge of the phenomenon lies around the average of their two guesses.
One concern is that our results may be attributed to demand effects. While the no-explanation comparison condition eliminates several potential demand explanations, it is plausible that the demands were not uniform across conditions. In other words, participants who provided an explanation for a phenomenon may have felt compelled to report a similarly adjusted understanding for the phenomena they did not explain. This could be because after explaining one phenomenon the participants were asked to re-evaluate their understanding of all six phenomena, which may have made it particularly salient that they should make the same adjustments for each phenomenon. However, if this were the case, then for each phenomenon explained, we should observe a similar reduction (or increase or no change) in understanding when that phenomenon is re-rated compared to when other phenomena are re-rated. The phenomena speedometer and snow in Experiment 3 suggest this is not the case. Figure 4 demonstrates that participants reported an increased understanding of speedometers after explaining how they work, and yet reported a decreased understanding of every other phenomenon. This same pattern emerged for the participants who explained how snow forms. These cases suggest that even if explaining a phenomenon does not make a person feel they understand it less, they may still feel they understand other phenomena less. Furthermore, it remains unclear which demand characteristic could account for the observed variability in the magnitude and direction of understanding changes due to the explanation of a phenomenon. Hence, we do not ascribe our results to demand effects.
Our work suggests that explanation might prove to be a robust, real-world debiasing technique. Research on science communication, misinformation, and pseudo-profound bullshit collectively highlight the importance that scientists place on what people understand, and critically, what people think they understand. This makes sense, as overestimating how much one knows is at the heart of pervasive cognitive biases (Kruger & Dunning, Reference Kruger and Dunning1999; Moore & Healy, Reference Moore and Healy2008). As such, there is no shortage of attempts to reduce people’s overconfidence (Arkes et al., Reference Arkes, Christensen, Lai and Blumer1987; Croskerry et al., Reference Croskerry, Singhal and Mamede2013; Ferretti et al., Reference Ferretti, Guney, Montibeller and von Winterfeldt2016). However, few techniques are widely effective. Explanation as a debiasing method can be indirect and nonconfrontational. This has implications for educational settings, where some students may find that explaining concepts in one subject, and experiencing difficulty, might help them engage with concepts and subjects for which they overestimated their knowledge. More broadly, people might be more willing to engage with information that contradicts their controversial or strongly held beliefs after failing to explain something unrelated. While people do not generally entrench further in their positions after being confronted (Nyhan, Reference Nyhan2021; Swire-Thompson et al., Reference Swire-Thompson, DeGutis and Lazer2020), they often fail to move after being confronted. Thus, explanation offers a way to avoid confrontation while still encouraging someone to question whether they know something. However, there are at least three limitations that should be considered. One is that the reported effects might only occur when questions of understanding are asked by an experimenter (although the experimenter was not physically present). Whether an educator, a parent, or a peer in the same role would observe the same effect deserves further study. A second limitation is that the debiasing effect might not apply to new phenomena introduced only after explanation, not before. In our work, participants reported knowing less about the phenomenon they had previously rated but did not explain. However, had they only rated the phenomenon after explanation, they may not have rated it any differently than they would have before explanation (i.e., like the first rating of the two made in the present studies). Thus, one promising avenue for future research is assessing the value of explanation as a debiasing technique outside of the lab. The third limitation is that our data do not indicate the duration of the debiasing effect. Our experience suggests the effect is more likely to be short-lived than long-lasting. Estimating the effect’s duration should be a focus of future research to better understand its usefulness as a debiasing technique. Fortunately, this future research can lead to deeper understanding of this illusion—rather than the mere illusion of understanding.
Supplementary material
The supplementary material for this article can be found at https://doi.org/10.1017/jdm.2023.24.
Data availability statement
The datasets generated by the survey research during and analyzed during the current study are available in the Open Science Framework, https://osf.io/6huwq/.
Funding statement
This work was financially supported through grants awarded by the Natural Sciences and Engineering Research Council of Canada to authors E.M., D.K., and J.F.
Competing interest
The authors have no competing interests to declare.




 Open access

