Introduction
Levels of genetic differentiation are expected to be low under widespread dispersal. Restricted gene flow will, on the other hand, result in high levels of differentiation (e.g., Drotz et al. Reference Drotz, Nilsson and Saura2001). Mayfly nymphs live in environments that are expected to give rise to different degrees of population structuring (Southwood Reference Southwood1962; Wagner and Liebherr Reference Wagner and Liebherr1992; Bilton et al. Reference Bilton, Freeland and Okamura2001). Standing water bodies differ not only in size but also in the pattern of patches available for mayfly nymphs, which may be continuous or discontinuous in ponds and lakes. Even though the environment may be patchy in flowing water, eggs and nymphs drift down the stream channel. In short, adult mayflies fly upstream and compensate for the passive downstream gene flow (Russev Reference Russev1973; Thomas Reference Thomas1975). Taken together, several mechanisms maintain population stability within a catchment (Syselman Reference Syselman1980). Among catchment, comparisons allow testing the extent of gene flow mediated by adult flight or passive dispersal; between years comparisons will show the temporal stability of a single patch in flowing water.
Mayfly nymphs are the most easily collected and may well be the most interesting stage in the mayfly life cycle (Lehmkuhl Reference Lehmkuhl1973). For example, Bauernfeind and Humpesch (Reference Bauernfeind and Humpesch2001) observed that the gills of Baetis macani, Baetis vernus Curtis, and Baetis tracheatus Keffermüller and Machel nymphs are considerably longer when they live in lake and pond habitats in comparison with nymphs from flowing water. In this context, Savolainen and Saaristo (Reference Savolainen and Saaristo1981) showed that two forms of B. macani inhabit northernmost Europe. The nymphs of one form live in flowing water and have narrow gills with inconspicuous tracheae, while the nymphs of the other form mostly live in stagnant water and have broad gills with visible tracheae.
Savolainen et al. (Reference Savolainen, Drotz, Hoffsten and Saura2007) and Ståhls and Savolainen (Reference Ståhls and Savolainen2008), showed that the lotic and lentic forms are reproductively isolated. Savolainen (Reference Savolainen2009a) showed that the lentic form with broad gills is a new species, Baetis jaervii. It may live also in slowly flowing water, in particular in slow flowing stretches of a river.
In this study, we examine the extent of gene flow estimated by allozymes and genetic differentiation estimated by mitochondrial DNA (mtDNA), within and among populations of the phylogenetically closely related lotic B. macani and lentic B. jaervii (Ståhls and Savolainen Reference Ståhls and Savolainen2008). In particular, we tried to determine whether there is genetic structuring within populations and whether the habitat, that is, flowing versus stagnant water, affects the genetic structure of populations. We address the following questions: do the observed genotype distributions of B. jaervii seen in a large lake differ from Hardy–Weinberg expectations (HWE) as contrasted to smaller lakes, where populations are expected to be closer to panmixia? Most insects living in flowing water show low levels of among-population genetic differentiation within and among catchments (e.g., Monaghan et al. Reference Monaghan, Spaak, Robinson and Ward2002; Hughes et al. Reference Hughes, Mather, Hillyer, Cleary and Peckarsky2003). We therefore assume that the levels of differentiation seen in lotic B. macani will be lower than in lentic B. jaervii and test this hypothesis with material from flowing water from the same geographical area. All populations of B. macani originate from flowing water. To test the effect of environmental and temporal patchiness in flowing water we sampled two populations in two successive years.
Material and methods
The species
Savolainen (Reference Savolainen1978) described mayfly swarming behaviour in northern Europe. Baetis are vertical swarmers: they fly actively up and glide then down with wings open in July and August over low vegetation in a vertical fashion from 0.5–4.0 m from the ground from afternoon until evening. Both B. macani and B. jaervii swarm close to the sedge belt or sedge tussocks where the nymphs live. Baetis macani was found in brooks that were all about 0.5–4.0 m in width. Baetis jaervii nymphs were only found within the sedge or reed belts in lakes varying in size from a few hectares up to tens of km2 (Savolainen Reference Savolainen2009a). These localities are exposed to wind so that B. jaervii adults can evidently be carried away with wind, whereas adults of B. macani may swarm over the entire length of a brook or along a marsh (Savolainen Reference Savolainen1978). A wind velocity of 0.5–1.0 m/second interferes with swarming and 1.5–2.0 m/second inhibits it completely (based on the personal observations of E.S.).
Study area and sample collection
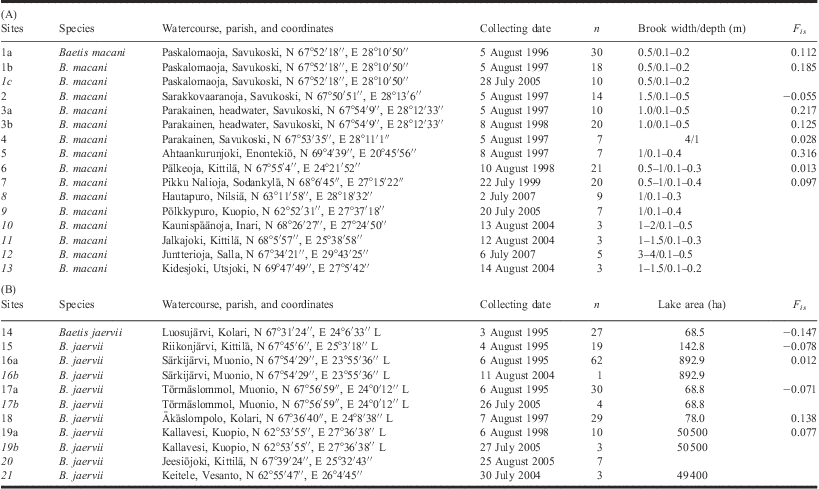
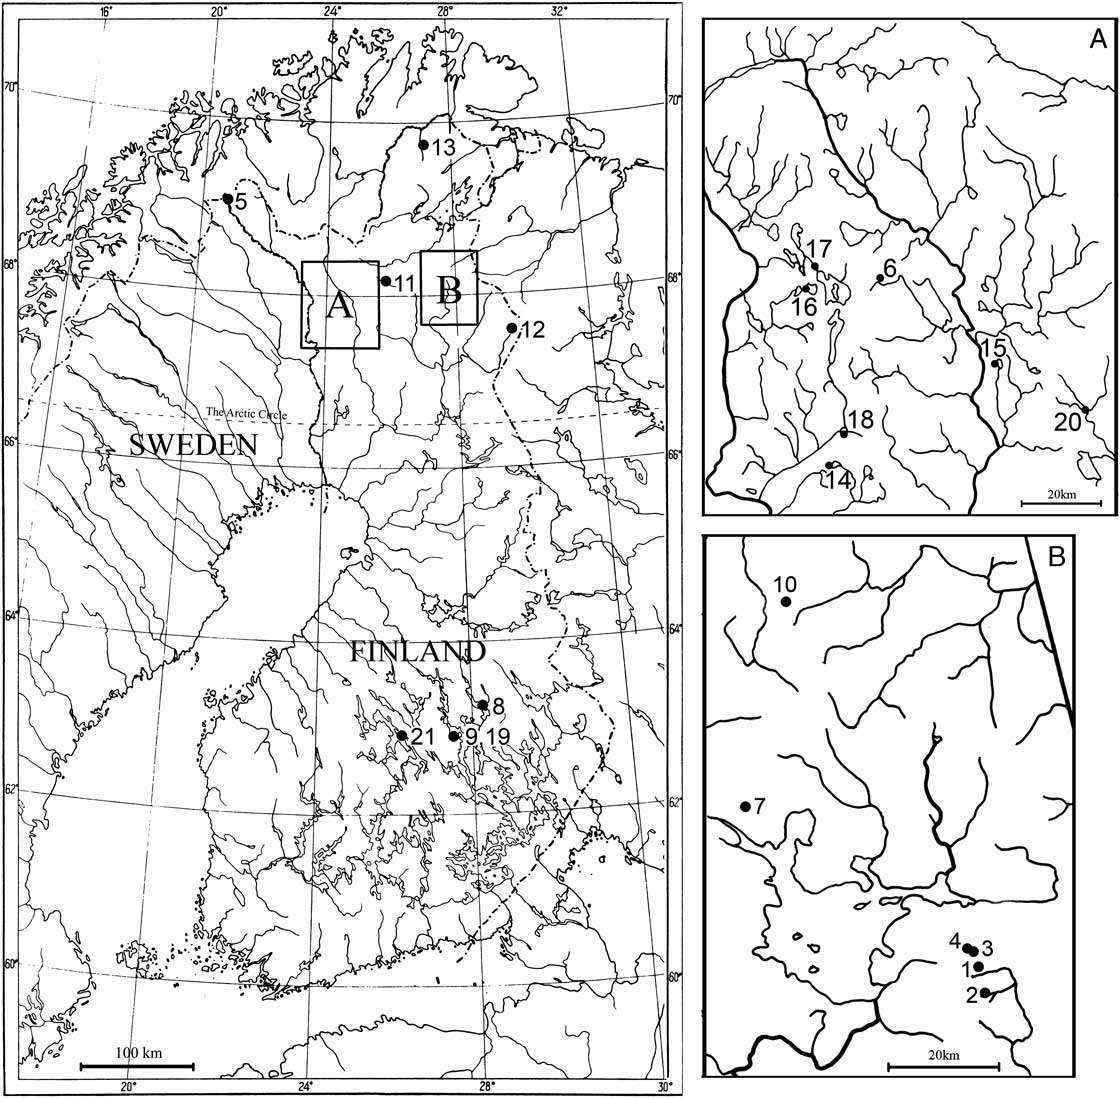
Savolainen collected mayfly nymphs from 1995–2005 from populations in central through northern Finland, an area extending in length over 800 km. The exact localities, collection dates, and sampled specimens are given in Table 1 and Figure 1. For the mtDNA cytochrome c oxidase subunit I gene (COI) sequencing, 28 specimens of B. macani and 15 specimens of B. jaervii were sampled; 324 specimens were analysed for the allozyme. Most lakes were rather shallow and had a continuous fringe of sedge vegetation all around, while the large oligotrophic lakes Kallavesi (site 19) and Keitele (site 21) had sedge or reed belts rather far apart from each other. Samples used for deoxyribonucleic acid (DNA) extraction are, in part, from Ståhls and Savolainen (Reference Ståhls and Savolainen2008). These are given in Table 1 together with 20 new samples. Material from three sites: (1) Paskalomaoja, Savukoski; (17) Törmäslommol, Muonio; and (19) Kallavesi, Kuopio were subjected both to protein electrophoresis and DNA sequencing. Two B. macani sites, numbers 1 and 3 were sampled in two consecutive years.
Site number (a–c = different samplings of same site), species name, species, watercourse, parish, location, habitat (B = brook, L = lake); collecting date and number of nymphs sampled; width/depth in metre for brooks (B) or area for lake (L) in ha; population substructure (F is).

Notes: Habitat area is not given for samples from rivers. Sites given in italics are used in the mitochondrial DNA analysis. (A) covers the lotic B. macani populations (1–13) and (B) covers the lentic B. jaervii (14–21). The population 20 is collected from the Jeesiöjoki, a slow-flowing river with extensive submerged vegetation. The river is from 10–15 m wide and from 0.5–1.0 m deep.
Study area and collection sites. Sites 1–13 represent the lotic Baetis macani samples and sites 14–21 the lentic Baetis jaervii samples.

Allozyme survey
The electrophoretic methods are described by Savolainen et al. (Reference Savolainen, Saura and Hantula1993). The following enzymes gave repeatable results: Acid phosphatase (Acph), Esterases (Est), Glutamate oxaloacetate transaminase (Got), Peptidase (Pep), Phosphoglucose isomerase (Pgi), and Triosephosphate isomerase (Tpi). Samples from different populations were run on the same gel so that the samples served as controls to each other. The differences in mobility were few and clear-cut so that using a single population as an internal standard gives repeatable results.
DNA amplification and sequencing
Shape and structure of mandibles, abdominal gills, and abdominal tergites (and the membranous area between them) are important in morphological species identification of the nymphs, therefore we used the thorax and legs for DNA extraction. DNA was extracted from these parts of individuals of the ethanol preserved specimens using the NucleoSpin Tissue DNA Extraction kit (Macherey-Nagel, Düren, Germany) following manufacturer's protocols and resuspended in 50 μL ultra-pure water. Remnants of the specimens were conserved in alcohol for the purpose of further morphological studies and are preserved as DNA voucher specimens, deposited at Finnish Museum of Natural History (MZH).
We used the primer pair LCO1490 (5′-GGTCAACAAATCATAAAGATATTGG-3′) and HCO2198 (5′-TAAACTTCAGGGTGACCAAAAAATCA-3′) (Folmer et al. Reference Folmer, Black, Hoeh, Lutz and Vrijenhoek1994) to amplify the 650 bp “Folmer fragment” or “COI barcode” of the 5′-end of the mitochondrial gene COI. Polymerase chain reaction (PCR) amplifications were carried out in 25 μL reactions containing 1–3 μL DNA extract, 1 μL of each primer (at 10 pmol/μL), 0.25 μL of Taq DNA polymerase (5 U/μL), 2–3 μL 2.5 mM MgCl2, 2.5 μL 10× Buffer II (Applied Biosystems, Foster City, California, United States of America), and 4 μL 200 mM dNTP (GeneAmp, Life Technologies Ltd., Paisley, Renfrewshire, United Kingdom) and ultra-pure water. Thermocycler conditions were initial denaturing at 95°C for 2 minutes, 29 cycles of 30 seconds denaturing at 94°C, 30 seconds annealing at 49°C, 2-minute extension at 72°C, followed by a final extension of 8 minutes at 72°C.
PCR products were purified using the GFX PCR Purification Kit (Amersham Biotech, Little Chalfont, United Kingdom). Amplified PCR was checked for size and products (bands) running 4 μL on a 1% agarose gel terminator and then sequenced (with the PCR primers) in both directions using the Big Dye Cycle Sequencing Kit version 1.1 (Applied Biosystems) at one-fourth of the recommended volumes on an ABI PRISM 377 (Applied Biosystems) sequencer. The sequences were inspected and edited for base-calling errors and assembled using Sequence Navigator™ (version 1.01, Applied Biosystems).
Statistical analysis
Deviation from linkage disequilibrium, the expected proportions of random association of alleles or genotypes over all populations and nuclear alleles – allozymes – in both species were tested as described in Goudet (Reference Goudet2001). Difference within species in mean observed heterozygosity was calculated for each population using the Biosys-1 software (Swofford and Selander Reference Swofford and Selander1981). Genetic diversity of each locus over population was calculated as described by Nei (Reference Nei1978). The degree of genetic relationship between individuals within a population in relation to all populations was calculated as described by Hamilton (Reference Hamilton1971).
Population substructuring F IS, measured as the expected degree of a reduction in heterozygosity from the HWE, and was tested with a permutation test of alleles between and within populations (Goudet et al. Reference Goudet, Raymond, de Meeus and Rousset1996). F-statistics were computed according to FSTAT of Goudet et al. (Reference Goudet, de Meeüs, Day and Gliddon1994) and Goudet (Reference Goudet2001). Population differentiation, within and between species and sites, was estimated with a multivariate ordination of subpopulations by principle component analysis (PCA) of allele frequencies with the PCAGEN software (Goudet Reference Goudet1999). An advantage of this analytic model is its independence from the Hardy–Weinberg assumption. It is also useful to visualise the genetic difference between sites. Genetic differentiation was also determined by estimating F ST, a measure of the relative fixation of alternative alleles in and between different subpopulations (Reynolds et al. Reference Reynolds, Weir and Cockerham1983; Weir and Cockerham Reference Weir and Cockerham1984) using FSTAT v2.93. Correction for multiple comparisons was done with Bonferroni correction. Confidence interval over loci and populations were estimated with Jackknifing and Bootstrapping, respectively.
We used the program NONA v2.0 (Goloboff Reference Goloboff1999) for the parsimony analysis spawn with the aid of Winclada (Nixon Reference Nixon2002) using the heuristic search algorithm (command line: hold 100000; mult*1000; hold/200) and for calculating the Bremer decay index (Bremer Reference Bremer1994). Measures of how well all individual characters fit on a phylogenetic tree is measured by the consistency index (CI). The average value is calculated by dividing the minimum possible number of steps by the observed number of steps on the tree. The retention index (RI) measures the amount of synapomorphy expected from a data set that is retained as synapomorphy on a tree. All base positions were treated as equally weighted characters. Baetis vernus was used as an outgroup (European Molecular Biology Laboratory [EMBL] accession numbers AM494667, AM494684-85). Of the COI sequences used within this study, 26 were previously used in Ståhls and Savolainen (Reference Ståhls and Savolainen2008) (EMBL accession numbers AM494609-45, AM494658-67, AM494672-87). Here we include 20 new sequences from 13 localities marked in italics in Table 1 (EMBL accession numbers GU727832-50). The COI data are free accessible via GeneBank (http://www.ncbi.nlm.nih.gov/) and EMBL (http://www.ebi.ac.uk/). The allozyme frequency data are available in the form of an electronic appendix (Drotz et al. Reference Drotz, Savolainen, Saura and Ståhls2012).
Results
Population structure within samples
F IS values were determined separately for each population (Table 1). The mean value over all B. macani populations was 0.135 ± 0.109 (mean and standard error) and −0.017 ± 0.037 in B. jaervii. The 95% confidence interval (CI) over loci in B. macani was 0.005 to 0.267 and −0.048 to 0.098 in B. jaervii. In B. jaervii each population is in agreement with the expectations of the Hardy–Weinberg equilibrium randomising alleles within samples based on 15 000 randomisations (P-value = 0.599). This means that there is no within population substructuring and that the populations are effectively panmictic. In contrast to the population samples of B. macani, which showed significant deviation from HWE (P-value = 0.005). However, not a single locus in both species exhibited a significant genotypic disequilibrium (adjusted P-value based on 200 permutations).
Population differentiation
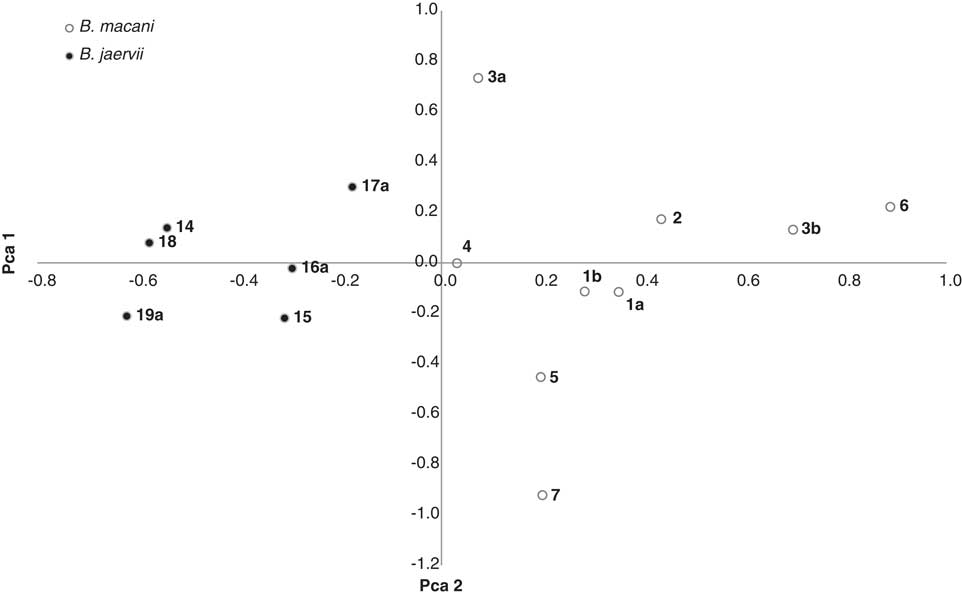
A total of 67.6% of the genetic variation was explained by the two PCA axes (Fig. 2). The global theta value (F ST) was 0.299. The first component (PC1: 46.7%) was significant and separates the two species, whereas the second component (PC2: 20.9%) separates populations within species but the differences are not significant. The theta value (F ST) over all populations and all loci, estimated according to F-statistics, had a value 0.294 ± 0.043 (mean and standard error). The 95% confidence interval (CI) over loci ranged from 0.154 to 0.334, which shows moderate genetic differentiation. The extent of genetic differentiation among populations of the two species ranges from small to large: in B. macani the mean F ST = 0.287 and in B. jaervii = 0.124. The difference in population structure between the lotic and lentic populations is significant (ANOVA: P-value = 0.049, F = 4.70).
Principal components analyses of allele frequencies in Baetis macani (ο: sites 1–7) and Baetis jaervii (•: sites 14–19a). Site number references as in Figure 1 and Table 1. Percentage of explained variation per axis, PC1: 46.7% and PC2: 20.9%. Global genetic differentiation between sample sites measured in F st : 0.299.

Genetic differentiation of B. macani
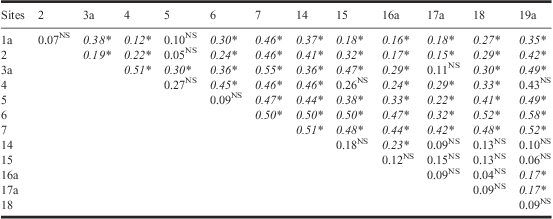
Our samples from Savukoski, eastern Lapland, sites 1 through 6, are geographically close to each other (Fig. 1). Sites 1 and 2 are only a few kilometres apart and lie within the same catchment, whereas sites 3 and 4 belong to different catchments. The genetic differences between samples from the first sites 1 and 2 are not significant (F ST = 0.07) while the differences between the samples from sites 3 and 4 are significant (F ST = 0.44, P > 0.05; Table 2). The genetic differences between these catchments are significant with a F ST value ranging from values of 0.12 to 0.38. This implies that samples from geographically adjacent populations collected within the same year may well differ significantly from each other. The largest genetic difference between geographically distributed localities was found between sites 6 and 7 and the other sites, 60 and 100 km away, respectively (Fig. 1). Between these populations genetic difference ranged between 0.24 and 0.50, pair-wise F ST value (Table 2). There is no relationship between habitat bank-full width and genetic differences or structuring measured by F IS (Table 1). There is not any relationship between habitat width and genetic differentiation either. Sites 1, 6, and 7 are habitats with a width of less than 1 m, whereas site 3 and 5 are 1 m bank-full width, and the remaining sites 2 and 4 have a width larger than 1 m (Table 1). The genetic variation within these three classes has a pair-wise F ST value from 0.10 to 0.50, 0.30, and 0.22, respectively. Clearly there is no increased relationship between genetic differentiation and the width of the sampled habitat.
Genetic differentiation of Baetis macani (sites 1–7) and Baetis jaervii (sites 14–19) populations was determined by estimating θ, a measure of the relative fixation of alternative alleles in different subpopulations (Reynolds et al. Reference Reynolds, Weir and Cockerham1983).
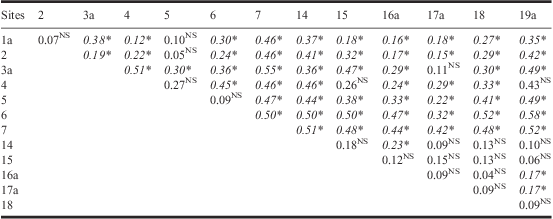
Notes: Sites as given in Table 1. P-values for F ST obtained after 1820 permutations. Asterisks indicate that the difference is significant at P > 0.05 level, while NS indicates that the difference is not significant.
Samples taken from the same site in two subsequent years show that considerable difference can take place in genetic structure. The difference between the samples from Paskalomaoja in Savukoski (site 1) was not significant, while the one between the two samples from Parakainen headwater in Savukoski (site 3) was significant with F ST = 0.301.
Genetic differentiation of B. jaervii
Samples from sites 16a and 17a from Muonio and samples from sites 14 and 18 from Kolari are pairs that are geographically close to each other, while the rest of the material for B. jaervii is geographically scattered (Fig. 1). The geographically adjacent samples do not differ significantly from each other (Table 2). The Muonio samples had a F ST value of 0.09, whereas the Kolari samples had 0.13. The sample from the largest lake (see Table 1), site 19 from Kallavesi, has nonsignificant differences compared with other samples except for the smallest lake from Muonio (F ST values to both samples was 0.17 and P < 0.05). Clearly lake size does not correlate to genetic differentiation.
mtDNA differences
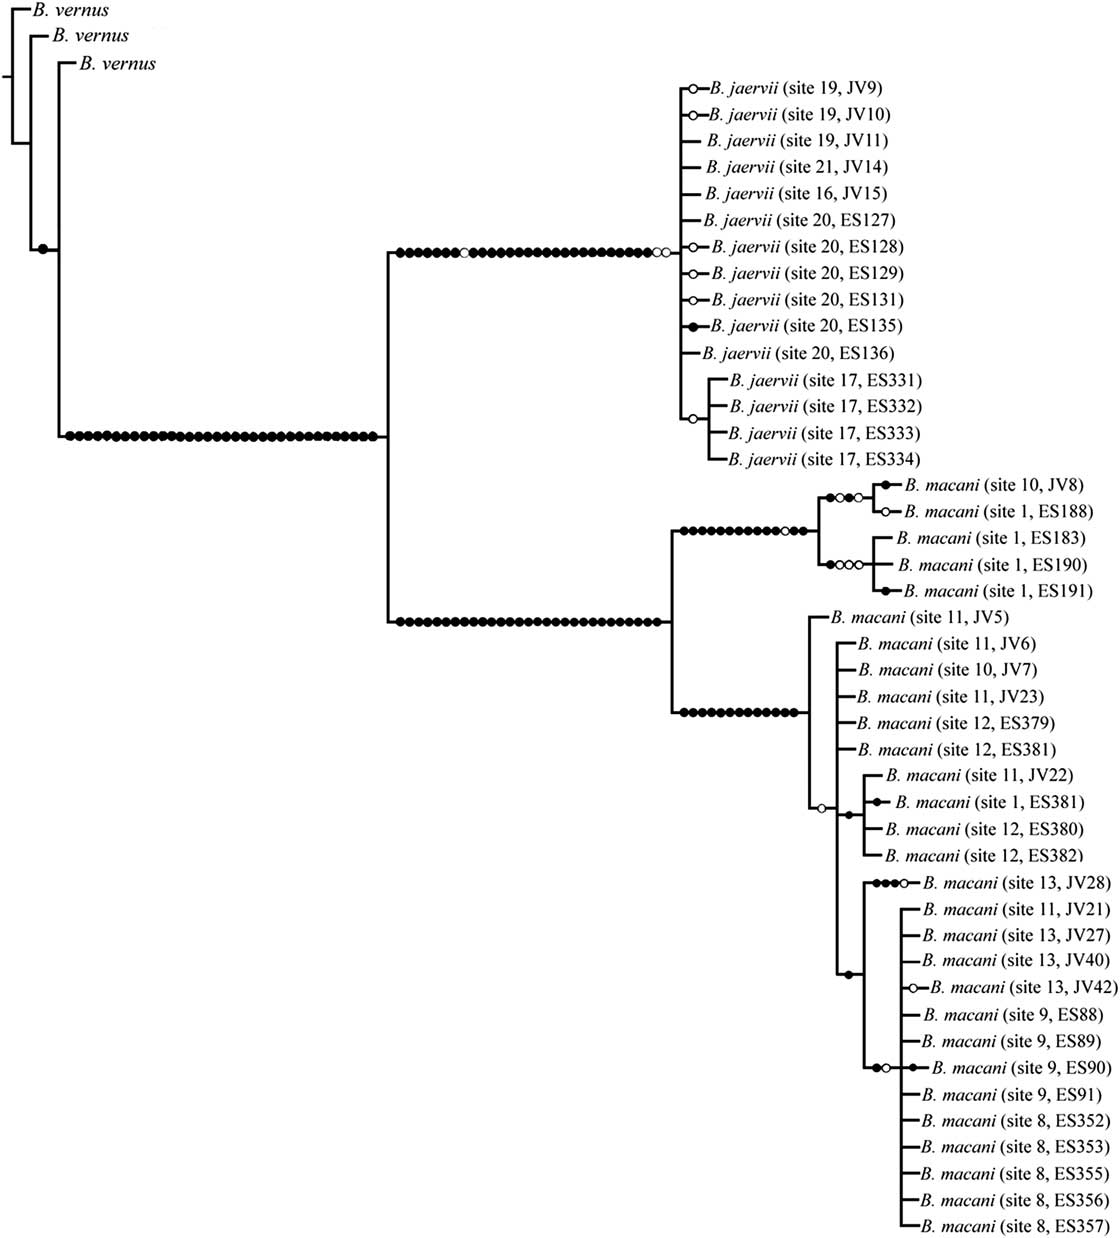
We obtained altogether 627 nucleotide sites for 44 samples of the partial COI sequences for B. macani and B. jaervii. The A+T content was 59%. No indels were observed. The parsimony analysis resulted in 24 equally parsimonious trees of 199 steps length, CI = 0.89, RI = 0.98. The strict consensus tree is shown in Figure 3 with localities for B. macani and B. jaervii according to Table 1. Nucleotide character transformations are indicated on branches; filled circles represent unique changes and open circles nonunique. All B. jaervii sequences belong to a monophyletic group with an uncorrected intraspecific COI sequence divergence that ranged between 0.16% and 0.54%. The sequences of B. macani, on the other hand, groups into two subclades within one monophyletic group. The sequence divergence between these two subclades was 5.2%–7.0%. Within each clade the sequence divergence ranged between 0.16% and 0.96%. These two well-supported subclades do not separate monophyletic groups, since specimens belonging to the site 1 and 10 are found within both subclades (Fig. 3).
Strict consensus cladogram of 24 equally parsimonious trees based on 627 bp of mitochondrial DNA cytochrome c oxidase subunit I gene sequences. Nucleotide changes indicated on branches, filled circles denote unique changes, open circles nonunique changes. Bremer support values are indicated above branches.

Discussion
Earlier studies on the genetic differentiation on Baetis have all been made on species that inhabit flowing water (e.g., Hughes et al. Reference Hughes, Bunn, Cleary and Hurwood2000, Reference Hughes, Mather, Hillyer, Cleary and Peckarsky2003; Monaghan et al. Reference Monaghan, Spaak, Robinson and Ward2001, Reference Monaghan, Spaak, Robinson and Ward2002). Baetis jaervii lives mostly in standing water. Here we show that this species exhibits little among population variation in mtDNA in comparison with B. macani, irrespective of the presence of two taxa included in the latter. Ståhls and Savolainen (Reference Ståhls and Savolainen2008) documented a relatively large uncorrected genetic differentiation between COI sequences of 13.1% to 14.4%. The result is congruent with the genetic differentiation in nuclear genes, allozyme frequencies, which among populations of B. jaervii, is just half of that among populations of B. macani. Accordingly, the lotic populations differ more than the lentic populations (Fig. 2). Studies in aquatic invertebrates show that lentic species have larger areas of dispersal than species living in running waters. In addition, they are least structured geographically and disperse with relative ease (Bilton et al. Reference Bilton, Freeland and Okamura2001; Ribera et al. Reference Ribera, Barraclough and Vogler2001; Monaghan et al. Reference Monaghan, Gatblliat, Sartori, Elouard, James and Derleth2005).
The lotic mayflies have mechanisms such as larval drift and compensatory flight that should counteract genetic differentiation, while the lentic forms do not have such mechanisms, so that the result is not intuitively self-evident. In addition, the size of the lake does not seem to affect the results appreciably.
Population structure within samples
We found that allele frequencies were quite uniform within a species over an extensive area. The pattern of genetic differentiation in Baetis mayflies has been studied within and among river systems (Schmidt et al. Reference Schmidt, Hughes and Bunn1995; Hughes et al. Reference Hughes, Bunn, Cleary and Hurwood2000, Reference Hughes, Mather, Hillyer, Cleary and Peckarsky2003; Monaghan et al. Reference Monaghan, Spaak, Robinson and Ward2001, Reference Monaghan, Spaak, Robinson and Ward2002). These studies were made in alpine environments that could be thought to give rise to geographic isolation between drainages or in subtropical environments with continuous vegetation. Nevertheless, the levels of genetic differentiation were in general low.
We did not find evidence for genetic structuring within populations within B. jaervii. This is in contrast to the results obtained on subtropical stream insects (Hughes et al. Reference Hughes, Bunn, Cleary and Hurwood2000, Reference Hughes, Mather, Hillyer, Cleary and Peckarsky2003) that showed evidence for patchy recruitment. This was explained by asynchronous hatching of adults; if the reproduction is synchronous, the effective population size will be larger. Hughes et al. (Reference Hughes, Mather, Hillyer, Cleary and Peckarsky2003) found, however, that populations of Baetis bicaudatus Dodds from the Rocky Mountains of North America also deviate from HWE. They explained the results in terms of different male and female dispersal patterns. These results are in more agreement with our findings of significant substructure within B. macani. Ståhls and Savolainen (Reference Ståhls and Savolainen2008) used mtDNA to show that Finnish B. macani comprises two species: B. macani and B. bundyae Lehmkuhl (formerly thought to be endemic to Canada).
Population differentiation
The vegetation of our study area is uniform; either boreal coniferous or subarctic birch forest; the general pattern of landscape is relatively even (at least in comparison with the Alps or the Rocky Mountains, where many other Baetis studies have been done). This relative uniformity of the terrain and vegetation comes close to the landscape in Queensland, Australia (Schmidt et al. Reference Schmidt, Hughes and Bunn1995; Hughes et al. Reference Hughes, Bunn, Cleary and Hurwood2000), but our Baetis swarm synchronously and the population sizes are evidently much larger than in Australia. Nevertheless, there is evidence for between year differentiations at a site. Again, we had evidence for both genetic similarities within drainage and also across short distances over terrain for Baetis.
Monaghan et al. (Reference Monaghan, Spaak, Robinson and Ward2002) studied the population structure of three alpine stream insects, including Baetis alpinus Pictet and Rhithrogena lyolaea Navás (Heptageniidae). Rhithrogena showed little genetic differentiation, while the limnephilid Allogamus auricollis Pictet did not show any at all. Baetis alpinus had F ST values that showed moderate to substantial differentiation among streams; a result that agrees with our observations on B. macani (Table 2). We think that the differences among stream insects can be explained through dispersal and behaviour (Savolainen Reference Savolainen1978; Drotz et al. Reference Drotz, Nilsson and Saura2001; Drotz Reference Drotz2003; Brodin et al. Reference Brodin, Johansson and Bergsten2006). In addition, the patchiness of the environment affects the genetic composition of populations to a considerable extent (Southwood Reference Southwood1962; Wagner and Liebherr Reference Wagner and Liebherr1992; Bilton et al. Reference Bilton, Freeland and Okamura2001).
Egg-laying Baetis females fly up along the watercourse; dip their abdomen to the water surface and dive under water to fasten eggs on suitable places among stones (Bauernfeind and Humpesch Reference Bauernfeind and Humpesch2001). Accordingly, the eggs are not expected to float down the stream, as would be the case with most other mayflies. Baetis nymphs are also known for their ability to swim upstream. Evidently, the adult females have to compensate for this, at least when we consider the low level of differentiation among populations of the heptageniid Rhithrogena in contrast to Baetis observed by Monaghan et al. (Reference Monaghan, Spaak, Robinson and Ward2002).
In contrast to the extensive differentiation seen among lotic populations of B. macani, the genetic differentiation among populations of the lentic B. jaervii is half of that seen among the former. We observed once a between year difference in the lotic form, which evidently indicates the effect of population size. This agrees with the results of Monaghan et al. (Reference Monaghan, Spaak, Robinson and Ward2001) who assumed that local populations of the lotic B. alpinus are small. Giberson et al. (Reference Giberson, Burian and Shouldice2007) have made an extensive study on the ecology of Baetis bundyae in arctic Canada. They were found in ponds and streams and show adaptations to complete their development within the short arctic summer. A similar situation is found in north Scandinavia. In our area of study, rainfall varies by a factor of about 20 in July and August between summers (Johansson and Nilsson Reference Johansson and Nilsson1994; Savolainen Reference Savolainen2009b). The brooks where the lotic B. macani was found are all small (Table 1). These brooks periodically dry out in the summer and freeze to the bottom in winter, save for their deepest parts (Dr. Milla Rautio, University of Québec, Laboratoire des sciences aquatiques, personal communication). The eggs are freeze-tolerant and they represent the overwintering stage. The nymphs develop rapidly after the ice-out but they are susceptible to drought (Brittain Reference Brittain1975; Johansson and Nilsson Reference Johansson and Nilsson1994; and, in particular, Giberson et al. Reference Giberson, Burian and Shouldice2007). More than 80% of the samples of B. macani collected from 1995–2005 were taken from sites of flowing water less than 1 m wide, while the rest were from wider stretches, up to 4 m wide (Table 1). Any mayflies living in such circumstances should experience highly variable population sizes (e.g., Hughes et al. Reference Hughes, Bunn, Cleary and Hurwood2000).
Lakes in which B. jaervii exist are stable; if there is temporary exposure on the shore, the nymphs swim away to deeper water within the sedge tussock where they live. The nymphs seem to use a similar strategy to escape freezing as the lotic B. macani. Mayflies do not inhabit ponds that are so shallow that they freeze all the way to the bottom. Consequently the population size is expected to remain stable from year to year. The circumstances described above would then explain the patchiness and differentiation seen among lotic populations in contrast to the lentic B. jaervii. Swarming behaviour may, however, be a factor that helps to stabilise incipient speciation in mayflies (Savolainen Reference Savolainen1978; Savolainen et al. Reference Savolainen, Saura and Hantula1993). Baetis are good dispersers (Corkum Reference Corkum1987). This evidently contributes to the small genetic differentiation between populations in lakes but is probably of little importance along brooks within a forest. Mayflies exhibit swarming behaviour that may facilitate speciation. It is, however, in general difficult to observe since they swarm by night. In the far north, darkness does not interfere with observation, and behavioural differentiation can be observed (Savolainen et al. Reference Savolainen, Saura and Hantula1993).
Sequence variation
The within population variation of B. macani is extensive, whereas B. jaervii is virtually invariable (Table 1, Fig. 3). Taken together, these observations agree with the result on genetic differentiation from the nuclear genes: the lotic forms show differentiation while the lentic form is stable. The phylogenetic relationships within the B. vernus have earlier been studied by Ståhls and Savolainen (Reference Ståhls and Savolainen2008). They point out that there are, in addition to described species, cryptic taxa, the status of which remains unsettled.
Acknowledgements
M.K.D. thanks the municipality of Lidköping for financial support. E.S. thanks the Finnish Ministry of Environment for financial support within a project involved in mapping threatened animal species in Finland and A.S. thanks the Natural Science Research Council of Sweden. Dr. Donna J. Giberson has kindly sent Canadian material to us. Dr. Pertti Renvall has helped us to solve technical and theoretical questions. We wish to thank Eva Engblom for encouragement, continuous support, and help in determining mayflies and Astrid Höglund for technical assistance.