



Introduction
The Antarctic Peninsula responds very quickly to environmental changes. In recent decades, there have been substantial environmental changes in the area, both in the Southern Ocean (surface water temperature and sea ice changes; Andukhov et al. Reference Andukhov, Lagun, Černyh and Jagovkina2006) and on land (progressive deglaciation and ice-shelf disintegration; Kejna et al. Reference Kejna, Láska and Caputa1998, Birkenmajer Reference Birkenmajer2002, Rückamp et al. Reference Rückamp, Braun, Suckro and Blindow2011). The mean rate of glacial retreat across the Antarctic Peninsula has been increasing since 1945. The standard deviations of retreat and advance rates over the entire domain are considerable (up to 150 m yr-1), but due to the diverse behaviour of the individual glaciers this is to be expected (Cook et al. Reference Cook, Fox, Vaughan and Ferrigno2005). It is clear that the ice cap on King George Island has been reduced, which is closely linked to the widespread retreat of tidewater glaciers along the western coast of the Antarctic Peninsula (Kejna et al. Reference Kejna, Láska and Caputa1998, Cook et al. Reference Cook, Fox, Vaughan and Ferrigno2005, Rückamp et al. Reference Rückamp, Blindow, Suckro, Braun and Humbert2010, Reference Rückamp, Braun, Suckro and Blindow2011).
The ice cap that covers most of King George Island is particularly sensitive to climate change (Blindow et al. Reference Blindow, Suckro, Rückamp, Braun, Schindler, Breuer, Saurer, Simões and Lange2010). From 1948–2012, the air temperature on King George Island increased by 1.2°C (0.19°C per decade). The specific nature and climatic conditions on King George Island make it a very important contemporary climate change laboratory. It is an area where interactions between the cryosphere and natural environment, with all their effects, are particularly evident. Surface changes in the modern glacial areas are especially visible.
The Antarctic Peninsula is a heavily glaciated region, with c. 80% of its area classified as melt and percolation zones (Rau & Braun Reference Rau and Braun2002). The equilibrium line altitudes (ELA) observed during the 1990s on King George Island revealed considerably higher values than those measured in the 1970s. This increase is consistent with higher mean air temperatures recorded during the 1990s (Braun & Gossmann Reference Braun and Gossmann2002).
Changes in glacial mass balance in the Admiralty Bay region of King George Island have been recorded in recent years (Rückamp et al. Reference Rückamp, Braun, Suckro and Blindow2011). For example, glaciers in the Martel Inlet lost c. 6.64 km2 (13.2% of the total area), without any advances from 1979–2011. The tidewater glacier Dobrowolski (0.076 km2 yr-1) experienced the highest retreat rate, with 17.27% of its area lost during this period. The land terminus glaciers Wanda (31.27%), Dragon (53.84%) and Professor (39.71%) presented the highest area loss during the period (Rosa et al. Reference Rosa, Vieira, Mendes Junior, Souza Junior and Simões2013). From 1979–2007, the tongues of the individual glaciers in the Admiralty Bay region retreated by 200–900 m (Pudełko Reference Pudełko2003).
The history of the cartographic representation of the Admiralty Bay region, with particular reference to the Ecology and Sphinx glacier system (ESGS) associated with the Arctowski Ice field, and the possibilities of using aerial photographs and thematic maps in relation to glacial fluctuations have been discussed by Kejna et al. (Reference Kejna, Láska and Caputa1998), Braun & Gossmann (Reference Braun and Gossmann2002), Simões et al. (Reference Simões, Dani, Bremer, Aquino and Arigony-Neto2004), Pudełko (Reference Pudełko2007) and Rückamp et al. (Reference Rückamp, Blindow, Suckro, Braun and Humbert2010, Reference Rückamp, Braun, Suckro and Blindow2011).
From 1961–96, the maximum recession of the Ecology Glacier was c. 480 m in the land-terminating northern part, 380 m in the southern part and as much as 620 m in the central part where the glacier meets the sea. The average retreat rate of this glacier varied from 8.8 m yr-1 for 1961–78 to 30–40 m yr-1 for 1978–96, with a mean of 17.7 m yr-1 for 1961–96 (Kejna et al. Reference Kejna, Láska and Caputa1998). This is mainly determined by of the retreat of the glacier’s central front, which had a maximum recession of c. 270 m from 1956–1992 (Braun Reference Braun2001).
Glaciological research on the ESGS has included studies on ablation, temporal changes, location of the glacier tongue, mass balance and meteorological conditions. Estimation of the mass balance of the ESGS was made with repeated point measurements at the glacier surface. This approach involved estimating the local mass balance using ablation poles and snow thickness measurements.
The primary aim of the present research was to assess the nature of the temporal variability and spatial structure of the mass balance of the ESGS, with a focus on changes in ice front position since 1979, as well as possible links between climate change and glacial retreat and changes in mass balance. The secondary aims of the study were to measure temporal variability in: i) the near-surface ice temperature in the ablation zones of the Ecology and Sphinx glaciers, ii) the ELA of Ecology Glacier, and iii) the vertical profiles. It is generally accepted that the thermal regime of a glacier directly controls glacier mass balance, hydrology and dynamics (Reijmer & Hock Reference Reijmer and Hock2008, Sobota Reference Sobota2009, Reference Sobota2011, Reference Sobota2013). Unfortunately, direct measurements of thermal regimes are available for very few glaciers worldwide. The majority of the glaciers on the King George Island ice cap can be regarded as temperate (Macheret & Moskalevsky Reference Macheret and Moskalevsky1999, Blindow et al. Reference Blindow, Suckro, Rückamp, Braun, Schindler, Breuer, Saurer, Simões and Lange2010).
Study area
King George Island (Fig. 1) is located at the northern tip of the Antarctic Peninsula and is the largest of the South Shetland Islands. King George Island is characterized by some of the greatest temporal variations in climate conditions in the Southern Hemisphere (Kejna Reference Kejna2003, Reference Kejna2008, Vaughan et al. Reference Vaughan, Marshall, Connolley, Parkinson, Mulvaney, Hodgson, King, Pudsey and Turner2003, Steig et al. Reference Steig, Schneider, Rutherford, Mann, Comiso and Shindell2009, Araźny et al. Reference Araźny, Kejna and Sobota2013, Kejna et al. Reference Kejna, Araźny and Sobota2013). These variations result from the feedback between the sea surface temperature, sea ice and atmosphere. The island is predominately ice-covered (93%; Simões et al. Reference Simões, Bremer, Aquino and Ferron1999), consisting of several connected ice fields with pronounced outlet glaciers. The highest elevation reaches slightly more than 720 m to a dominant central dome. The average ice thickness in the Arctowski Ice field is 250 m and the maximum thickness is 420 m (Blindow et al. Reference Blindow, Suckro, Rückamp, Braun, Schindler, Breuer, Saurer, Simões and Lange2010). The snowline varies from 140–210 m a.s.l. (Birkenmajer Reference Birkenmajer2002). The ice-free areas are either nunataks or coastal oases (Marsz Reference Marsz2000).
Measurement sites on the Ecology and Sphinx glacier system (based on an orthophotomap by Pudełko (Reference Pudełko2007)) and weather stations on King George Island. BS=Bellingshausen Station, FS=Ferraz Station, HA=Arctowski Station (photo by I. Sobota). Explanations also in Table I.

The study was conducted in the northern part of the Site of Special Scientific Interest (SSSI) No. 8 (Antarctic Specially Managed Area No. 128). The site was established in 1979, at the request of the Polish government, to protect the unique diversity of flora and fauna typical of the marine ecosystem (Rakusa-Suszczewski Reference Rakusa-Suszczewski2003). It has an area of c. 13 km2 and includes the west coast of Admiralty Bay. Characterized by great geographical diversity, its area is cut by glaciers flowing from the Warszawa Ice field. These glaciers are the Ecology, Sphinx, Baranowski, Tower and Windy. Two major glacier types can be distinguished in this region: land-terminating and tidewater glaciers.
Ecology Glacier is a valley glacier with a tongue flowing from the Warszawa Ice field to Admiralty Bay. On the northern and southern sides, the glacier has created marginal zones with numerous lateral and frontal moraines. In the middle part, the glacier has the character of a glacial cliff, in front of which a marine bay has formed. Sphinx Glacier is located south of Ecology Glacier and its tongue terminates on land.
The Ecology and Sphinx glaciers were treated as a single glacial system (the ESGS) (Fig. 1). The analysis included the ablation zone, snow percolation zone, the ELA and the accumulation zone, which is part of the ice field. It is bordered by the Błaszczyk moraine to the south and by mountain ranges in the north. The ESGS covers an area of 4.96 km2.
Methods
Changes in air temperature in the King George Island area were analysed using combined data series from the following stations: Admiralty Bay (1948–60), Deception (1948–67), Bellingshausen (1968–2012) and Ferraz (1986–2010) (Fig. 2). The thermal relationship between these stations varies during the year. The method of combination of these series is described by Kejna et al. (Reference Kejna, Araźny and Sobota2013).
Trend in air temperature (T) on King George Island, 1948–2012 (combined data from Admiralty Bay, Deception and Bellingshausen stations), and precipitation (P) at the Bellingshausen Station, 1968–2012. The method of combination of these series is described in Kejna et al. (Reference Kejna, Araźny and Sobota2013).

Detailed topoclimatic studies were carried out in the region of the ESGS from January 2012 to February 2013. Selected meteorological parameters were measured by an automatic weather station and data loggers in several parts of the region (Fig. 1, Table I). Three characteristic research facilities were selected: the non-glaciated Arctowski Oasis (the Arctowski Station, 3 m a.s.l.), Ecology Glacier (E2, E4) and its forefield (E0), and Sphinx Glacier (S2) and its forefield (S0). The main meteorological measurements were conducted at the meteorological site of the Arctowski Station (HA), located at 62°09'33.0"S, 58°28'05.9"W. Data were obtained with a Davis Vantage Pro+ automatic weather station and HOBO automatic loggers. Measurements were carried out from February 2012 to February 2013. Detailed information about the measurement points is shown in Table I, and their locations are indicated in Fig. 1.
Sites and measurement ranges at Arctowski Station and on the Ecology and Sphinx glacier system.

Vantage Pro+: air pressure, wind direction and velocity, air temperature and humidity, precipitation, solar radiation and UV, RHTemp101A: air temperature and humidity, HOBO: ground temperature (HA), U30-NRC Station: near-surface ice temperature.
Direct measurements of the mass balance of the ESGS were taken in 2012–13. Surface ablation was measured at 13 points on the glacier in January and February of each year (Fig. 1, Table I). Measurements of snow thickness were taken at many points during the study. The balance year adopted for this project ran from January 2012 to February 2013 (stratigraphic system), including the entire accumulation and ablation seasons. This remains the most precise and most frequently used glaciological method (Cogley et al. Reference Cogley, Hock, Rasmussen, Arendt, Bauder, Braithwaite, Jansson, Kaser, Möller, Nicholson and Zemp2011).
To assess change in area of the ESGS, the cartographic method was used. The maps used (including Francelino et al. Reference Francelino, Schaefer and Fernandes Filho2003, Pudełko Reference Pudełko2007) were made between 1979 and 2007.
In 2012, GPS measurements were also taken. Clear delimitation of the range of the glaciers was provided by the optical differentiation of areas of uncovered glacier and areas covered with moraine which ended with a clear edge (Sobota Reference Sobota2013). Measurements were made using the World Geodetic System (WGS84) in accordance with UTM zone 21E. The percentage area changes are relative to 1979, which was used as the reference for all areas.
To study the near-surface ice thermal structure of the ESGS, thermistors were installed on the glacier during the summer in 2012 (Fig. 1). Temperature measurements were made from February to June 2012, to depths of 10 m. The thermistors (HOBO) automatically register the ice temperature at 1 hour intervals and store data in a data logger. The accuracy and resolution of the thermistors are ±0.2°C and 0.03°C, respectively, with a range of -40°C to +75°C. The locations of the measurement sites were chosen to enable investigation of the thermal structure of the near-surface layers of the ESGS.
Results
Meteorological conditions in 2012–13
An increase in air temperature, and in particular an increase in the number of days with positive air temperature, led to higher ablation rates. However, during the same period, the volume of precipitation did not increase (Fig. 2).
From 19 January to 31 December 2012, 2985.3 MJm-2 (8.60 MJm-2 day-1) of solar radiation reached the surface at HA (Fig. 3a). The greatest monthly sums were recorded in December 2012, reaching 567.8 MJm-2 (18.3 MJm-2 day-1), and the lowest in June, 10.4 MJm-2 (0.4 MJm-2 day-1). The greatest daily sums were recorded in November, December and January exceeding 25–30 MJm-2, reaching, for example, 33.4 MJm-2 on 15 December 2012. In contrast, in June and July, values did not exceed 1 MJm-2 day-1.
Meteorological conditions at Arctowski Station from January 2012 to February 2013. a. Total global radiation (SR). b. Air temperature (T). c. Relative humidity (f). d. Wind speed (V). e. Maximum snow cover thickness (Smax).

The South Shetland Islands are characterized by the mildest thermal conditions in the Antarctic. In 2012, the air temperature at Arctowski Station averaged -1.5°C, with the highest monthly mean occurring in January (2.4°C), and the lowest in June (-5.6°C; see Fig. 3b and Table II). In the summer, the weather was more stable, whereas in the winter dramatic rises and falls in temperature occurred, sometimes exceeding 10°C per day. In 2012, the highest air temperature was recorded on 2 March (9.6°C) and the lowest on 10 June (-17.2°C). Relative air humidity in the area of the Arctowski Station is high due to the prevalence of maritime air masses. In 2012, the mean relative humidity was 83% (Fig. 3c).
Monthly meteorological measurements at Arctowski Station (HA) from 1 January 2012 to 22 February 2013 (Araźny et al. Reference Araźny, Kejna and Sobota2013).

F=relative humidity, Smax=maximum depth of snow cover, SR=total global radiation, Ti=average air temperature, Tmax=maximum air temperature, Tmin=minimum air temperature, V=wind speed.
*At 2 m a.s.l., **19–31 January, ***19 January to 31 December, ****1–22 February.
The highest average air temperatures were recorded on the sea terrace at Arctowski Station (HA). The Ecology and Sphinx glaciers are, on average, colder than at Arctowski Station. The air temperature in front of the glaciers was lower than at HA due to the recurrent flow of cool air formed over the glaciers and the influence of glacial ground. During the summer (for example, in February 2012) the difference in air temperature between HA and the glacier forefields (E0 and S0) was c. 1.1–1.2°C. The largest difference (2.8°C) occurred between HA and the upper glacial station E4 (the centre of the ESGS). The average air temperature gradient in February 2012 between E4 and HA was 1.4°C 100 m-1.
The coldest month in the area was June. The temperatures recorded in this month reached -5.6°C in HA, -7.1°C at Sphinx Glacier (S0), and -8.1 to -9.0°C (E2 and E4, respectively) at Ecology Glacier (Fig. 4). The average vertical air temperature gradient in the middle of winter (June 2012) between the central part of Ecology Glacier (E4) and HA was 1.7°C 100 m-1.
Monthly air temperature at selected sites of the Arctowski Station and Ecology and Sphinx glacier system.

Mass balance and glacial retreat
The spatial pattern of the mass balance of the ESGS is influenced mainly by local weather conditions, morphology and, especially, snow conditions. In February 2012, ablation of Ecology Glacier reached>70 cm w.e. (Fig. 5).
Ablation map of the Ecology and Sphinx glacier system for February 2012.

In 2013, the net mass balance in the ablation area of the glaciers was>-240 cm w.e. Some negative values were also obtained for the entire ablation zone of Ecology Glacier. The area of negative net balance in the ablation zone of Sphinx Glacier was smaller than for Ecology Glacier (Fig. 6). At altitudes above 100–150 m, melting is more intensive than at immediately lower elevations (Fig. 7).
Mass balance map of the Ecology and Sphinx glacier system in 2012–13.

Mass balance of the Ecology and Sphinx glacier system versus altitude (2012–13).

Glaciers flowing from the ice cap are characterized by large differences in altitude between the melting ablation and accumulation zones. The average ELA on the ESGS for 2012–13 was 156 m a.s.l.
The mean net mass balance of the ESGS in 2012–13 was +17.8 cm w.e. The mass balance of glaciers for the area up to 50 m a.s.l. was -204 cm w.e. and up to 150 m a.s.l. was -30 cm w.e. The accumulation area ratio of the ESGS was 0.82.
Relative to its area in 1979, the ESGS had lost 41% by 2012. Between 2007 and 2012, the ESGS area decreased by 3% (Fig. 8). Between 2007 and 2012, Ecology Glacier retreated by 20–68 m in the central part of the ice cliff and 128 m in the northern part (Fig. 9). Sphinx Glacier retreated by 14–154 m in the northern part and 0–50 m in the southern part (Fig. 9). The average retreat rate of the ESGS between 2007 and 2012 was 16.6 m yr-1.
Area changes of the Ecology and Sphinx glacier system from 1979–2012. Data for 1979 and 2007 are based on the western shore of Admiralty Bay orthophotomap (Pudełko Reference Pudełko2007).

Retreat of a. Ecology Glacier and b. Sphinx Glacier since 1979. The background image is based on non-conventional aerial photographs obtained during the 2002–03 summer (Francelino et al. Reference Francelino, Schaefer and Fernandes Filho2003). Borders of glaciers in 1979 and 2007 are based on the western shore of Admiralty Bay orthophotomap (Pudełko Reference Pudełko2007).

Temperature of surface ice layers
The near-surface ice temperatures of Ecology Glacier changed markedly throughout the research period from February to June 2012. In early February, in the ablation zone, the ice temperature fell significantly with a minimum of -0.4°C recorded at the lowest thermistor at 10 m depth (Fig. 10). The mean amplitude of the monthly ice temperature was 0.1°C at 10 m depth (Figs 11 & 12).
Temporal variations in a. daily near-surface ice temperature at 10 m depth of the Ecology and Sphinx glacier system and b. snow thickness for February to June 2012.

Near-surface ice temperature (°C) of the Ecology and Sphinx glacier system for February to June 2012. a. Ablation zone of Ecology Glacier (E2). b. Equilibrium line of Ecology Glacier (E2). c. Ablation zone of Sphinx Glacier (S2).
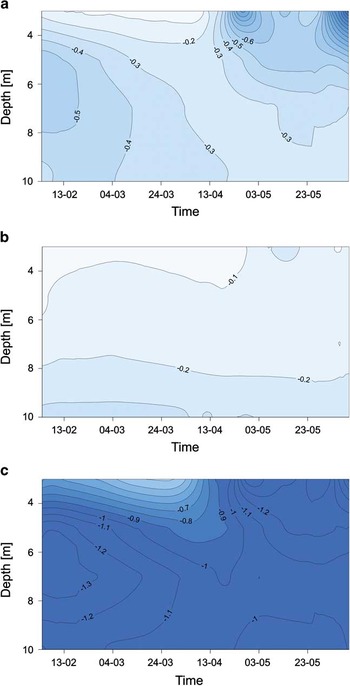
Temperature profiles in selected parts of the Ecology and Sphinx glacier system for February to June 2012 (II–VI). a. Ablation zone of the Ecology Glacier (E2). b. Equilibrium line of Ecology Glacier (E4). c. Ablation zone of Sphinx Glacier (S2).

At the ELA of Ecology Glacier (E4), the mean amplitude of monthly ice temperature was 0.06°C at 10 m depth (Fig. 12).
The near-surface ice temperatures of Sphinx Glacier also changed throughout the research period (Fig. 11), with a mean amplitude of monthly ice temperature of 0.1°C at 10 m depth (Fig. 12).
Temperatures of Ecology Glacier at 10 m depth ranged from c. -0.3 to -0.4°C. In the ablation area of Ecology Glacier, the ice temperature was higher than in the same zone of Sphinx Glacier. Additionally, it is highly characteristic of the ELA of Ecology Glacier that, during the observed period, the monthly and daily ice temperature was aligned and clearly close to the melting point. In addition to meteorological conditions (air temperature), snow cover has an important influence on the temperature of the near-surface glacier ice, acting as an isolation layer between the atmosphere and the ice. Snow cover was observed at the measurement points throughout the majority of the study period (February–June 2012) (Fig. 10).
Discussion and conclusions
The climatic conditions of King George Island undergo considerable year-to-year variability. From 1948–2012, a statistically significant (at a level of 0.05) increase in mean annual air temperature occurred, reaching 1.2°C (0.19°C per decade. This warming affected all seasons except for spring. In winter, the warming rate was more than twice as rapid as in summer (Kejna et al. Reference Kejna, Araźny and Sobota2013). In recent years, however, this warming has ceased. In the twenty-first century there has also been a series of cool years (Table III).
Mean meteorological measurements at Arctowski Station in 2012 and 1977–98*.

*Marsz & Styszyńska Reference Marsz and Styszyńska2000, **Marsz & Styszyńska Reference Marsz and Styszyńska1994, ***Prošek et al. Reference Prošek, Janouch and Kruszewski1996, ****Kejna & Láska Reference Kejna and Láska1999.
#18–31 January.
The meteorological conditions in 2012 were not typical. Compared to the average values for recent years, 2012 was characterized by lower air pressure and lower incoming solar radiation. Large temperature anomalies in each month, especially summer 2012–13, which tended to be very cold with lengthy periods of snow cover.
The ESGS shows a spatial distribution of mass balance depending on the depth of the snow cover, which is variable over the glaciers. In the accumulation zones, the main factor influencing the depth of snow cover is precipitation, whereas redistribution by wind is important on the lower parts of the glacier. Positive mass balance was recorded at altitudes >125 m a.s.l.
From 2012 to 2013, the mass balance of the ESGS was +17.8 cm w.e. This was primarily the result of weather conditions and snow cover thickness. In summer, with the exception of the front part of the Ecology Glacier, snow cover was observed over the entire area. Despite intensive melting, the snow cover was present until the end of the ablation season.
Between 1979 and 2012 the area loss for Ecology Glacier was 0.207 km2 and for Sphinx Glacier was 0.233 km2. In total, the ESGS lost 41% of its area. The average retreat rate of the ESGS throughout the entire analysed period of 2007–12 was 16.6 m yr-1. For 1961–96, the area loss for Ecology Glacier was 0.677 km2, producing a similar annual average loss rate (Table IV). An increase in air temperature in the South Shetland Islands region is considered to be responsible for the recession of Ecology Glacier in recent years.
Area changes at Ecology Glacier, Sphinx Glacier and the Ecology and Sphinx glacier system.

* Ecology Glacier tongue and southern part.
From February to June 2012, the mean near-surface ice temperature at 10 m depth was higher than the annual mean air temperature by 3.1°C for Ecology Glacier and 1.5°C for Sphinx Glacier. The mean air temperature was -3.2°C and -1.6°C, respectively, whereas for the near-surface ice it was c. -0.1°C. At all measurement points to 10 m depth, the mean amplitude of monthly temperature was c. 0.1°C indicating that the near-surface ice temperature of the glaciers does not exceed 1°C. This is similar to the King George Island ice cap in a firn profile at c. 619 m a.s.l. in 1999–2000, which was also c. -0.3°C (Blindow et al. Reference Blindow, Suckro, Rückamp, Braun, Schindler, Breuer, Saurer, Simões and Lange2010).
Throughout most of the research period (February–June 2012), the mean monthly ice temperature at the ablation zone of Ecology and Sphinx glaciers tended to increase with depth. Only during the summer did temperature fall with depth. This is presumably related to the process of ice warming at the near-surface of the glacier.
The thermal structure of the near-surface layer of the ESGS indicates that, in the summer, the glacier’s temperature is close to the melting point, and decreases with increasing depth below the surface. Throughout the rest of the year, the near-surface layer of the ice is also temperate. This confirms that most of the glaciers in the King George Island ice cap can be regarded as temperate.
The ESGS had a positive mass balance during 2012–13. Moreover, the tongue retreated and the glaciers showed a decrease in surface area in the long term. Hence, single-year measurements should be treated with some caution when extrapolating to longer time periods, to other or larger regions or when comparing different years. However, the direction of the mass changes can be determined only on the basis of detailed research in future years. Therefore, this investigation of the mass balance of the ESGS is especially important, as it offers one of only a few records available throughout King George Island, the Antarctic Peninsula and the Antarctic. Glaciological studies of the ESGS are an important component in the estimation of recent changes in the cryosphere of the King George Island region.
Acknowledgements
These observations were carried out as part of the ‘Climatic and glaciological interactions in the context of global warming. Study based on the example of SSSI No. 8 (King George Island, West Antarctica)’ study, funded by the National Science Centre (NN 306 722540). The authors wish to thank the Participants of the 36th and the 37th Antarctic Expeditions of the Polish Academy of Sciences for their logistical support with the observations in the area of the Arctowski Station. The authors would also like to thank the anonymous reviewers and Editor for the valuable comments and suggestions that helped to improve the paper.
Author contribution
I.S. described all glaciological problems and partly climate issues, and wrote the manuscript. M.K. and A.A. interpreted the meteorological data. I.S., M.K. and A.A. performed the field measurements. All authors contributed significantly to the interpretation of the data and revision of the manuscript.



