1 Introduction
In this paper, I present a numerical study of passive scalar transport in turbulent channel flow subject to spanwise system rotation. A passive scalar does not influence the flow and can represent, for example, a contaminant or small temperature variation. The present investigation is therefore related to heat and mass transfer in rotating flows found in many industrial apparatus like turbo-machinery, separators and chemical reactors.
Brethouwer (Reference Brethouwer2005) and Kassinos, Knaepen & Carati (Reference Kassinos, Knaepen and Carati2007) studied by direct numerical simulations (DNS) passive scalar transport in homogeneous turbulent shear flow subject to rotation about an axis normal to the mean shear plane and found that rotation has a large impact on the scalar fluctuation intensity and turbulent scalar transport direction. With a transverse mean scalar gradient, scalar transport is mainly in the streamwise direction if the flow is non-rotating whereas it is nearly aligned with the mean scalar gradient if system rotation exactly counteracts rotation induced by the mean shear. Rotation can also strongly reduce the turbulent Prandtl number (Brethouwer Reference Brethouwer2005). Many of these rotation effects are also shown by rapid distortion theory.
A generic case to study the influence of rotation on mass or heat transfer in wall flows is turbulent plane channel flow with a passive scalar subject to spanwise system rotation. The effect of spanwise rotation on turbulent channel flow has already been thoroughly investigated numerically (Kristoffersen & Andersson Reference Kristoffersen and Andersson1993; Grundestam, Wallin & Johansson Reference Grundestam, Wallin and Johansson2008; Xia, Shi & Chen Reference Xia, Shi and Chen2016) and experimentally (Johnston, Halleen & Lezius Reference Johnston, Halleen and Lezius1972). Most numerical studies are limited to
 $Re_{\unicode[STIX]{x1D70F}}=u_{\unicode[STIX]{x1D70F}}h/\unicode[STIX]{x1D708}\leqslant 194$
, where
 $u_{\unicode[STIX]{x1D70F}}$
is the friction velocity,
 $h$
the half channel gap width and
 $\unicode[STIX]{x1D708}$
the viscosity, but recently the study of spanwise-rotating channel flow has been extended to
 $Re=U_{b}h/\unicode[STIX]{x1D708}=31\,600$
and a wide range of rotation numbers
 $Ro=2\unicode[STIX]{x1D6FA}h/U_{b}$
(Brethouwer Reference Brethouwer2017). Here,
 $U_{b}$
is the bulk mean velocity and
 $\unicode[STIX]{x1D6FA}$
the system rotation rate. These studies show that at moderate
 $Ro$
turbulence and especially the wall-normal velocity fluctuations are augmented on the channel side where the system rotation is anticyclonic, i.e. in the direction opposite to the rotation induced by the mean shear, while they are damped on the channel side where the rotation is cyclonic (Xia et al.
Reference Xia, Shi and Chen2016). These channel sides are from now on called the unstable and stable sides, respectively. Large streamwise roll cells, also called Taylor–Görtler vortices, are observed on the unstable channel side at low to moderate
 $Ro$
(Liu & Lu Reference Liu and Lu2007; Dai, Huang & Xu Reference Dai, Huang and Xu2016; Brethouwer Reference Brethouwer2017). The flow on the stable side relaminarizes partly to fully at moderate
 $Ro$
, whereas in the limit of high
 $Ro$
the whole channel relaminarizes (Grundestam et al.
Reference Grundestam, Wallin and Johansson2008; Wallin, Grundestam & Johansson Reference Wallin, Grundestam and Johansson2013; Brethouwer Reference Brethouwer2017). A key feature of spanwise-rotating channel flow is the development of a linear part in the mean streamwise velocity profile on the unstable side where the absolute mean vorticity is nearly zero (Grundestam et al.
Reference Grundestam, Wallin and Johansson2008; Xia et al.
Reference Xia, Shi and Chen2016). Another remarkable feature is the occurrence of a linear instability in a bounded range of
 $Re$
and
 $Ro$
, leading to recurring strong bursts of turbulence on the stable channel side (Brethouwer et al.
Reference Brethouwer, Schlatter, Duguet, Henningson and Johansson2014; Brethouwer Reference Brethouwer2016).
Passive scalar transport in non-rotating turbulent channel flow has also been studied extensively by DNS (see e.g. Kawamura et al.
Reference Kawamura, Ohsaka, Abe and Yamamoto1998; Johansson & Wikström Reference Johansson and Wikström1999; Kawamura, Abe & Matsuo Reference Kawamura, Abe and Matsuo1999). The velocity and scalar fields show several similarities, especially near the wall (Abe & Antonia Reference Abe and Antonia2009; Antonia, Abe & Kawamura Reference Antonia, Abe and Kawamura2009). Pirozzoli, Bernardini & Orlandi (Reference Pirozzoli, Bernardini and Orlandi2016) carried out DNS of passive scalar transport in turbulent channel flow for
 $Re_{\unicode[STIX]{x1D70F}}$
up to 4088 and Prandtl number
 $Pr=\unicode[STIX]{x1D708}/\unicode[STIX]{x1D6FC}$
between 0.2 and 1, where
 $\unicode[STIX]{x1D6FC}$
is the scalar diffusivity. They observed that the mean scalar profile follows a logarithmic law and that large scalar structures are present in the outer layer. The turbulent Prandtl number was close to 0.85 in a large part of the channel, suggesting that the Reynolds analogy for scalar-momentum transfer is valid.
Scalar transport in rotating channel flow has been much less examined. Matsubara & Alfredsson (Reference Matsubara and Alfredsson1996) have experimentally investigated momentum and heat transfer in laminar rotating channel flow. They found that streamwise roll cells when present have a profound effect on heat transfer, and concluded that the Reynolds analogy is not valid since the Nusselt number changes in contrast to the skin friction due to rotation. Nagano & Hattori (Reference Nagano and Hattori2003) and Liu & Lu (Reference Liu and Lu2007) carried out DNS of passive scalar transport in spanwise-rotating turbulent channel flow at
 $Re_{\unicode[STIX]{x1D70F}}=150$
and 194, respectively, for
 $Ro\lesssim 0.5$
. They observed a reduced turbulent scalar transport on the stable channel side, resulting in steep mean scalar gradients and strong scalar fluctuations. Liu & Lu (Reference Liu and Lu2007) also found that the streamwise turbulent scalar transport is reduced by rotation, like in rotating homogeneous turbulent shear flow (Brethouwer Reference Brethouwer2005). The Nusselt number showed a moderate decline with
 $Ro$
. Wu & Kasagi (Reference Wu and Kasagi2004) studied by DNS scalar transport in turbulent channel flow at
 $Re=2280$
subject to system rotation with varying directions. Also in their DNS, rotation has a large impact on the direction and rate of turbulent scalar transport. Yang et al. (Reference Yang, Cui, Xu and Zhang2011) observed that the velocity and scalar field are strongly correlated on the unstable side and weakly on the stable side in DNS of spanwise-rotating channel flow at
 $Re=2666$
.
The objective of this study is to investigate by DNS passive scalar transport in plane turbulent channel flow subject to spanwise system rotation at higher
 $Re$
and for a wider range of
 $Ro$
than in previous studies to obtain a better understanding of turbulent heat and mass transfer in rotating wall-bounded flows. I will show that rotation weakens the similarity between the scalar and velocity field and that the Reynolds analogy is not necessarily valid in rotating channel flow. With my study, I aim to assist the development of models for transport and mixing in rotating turbulent flows. Several models for turbulent scalar and heat transfer in rotating wall flows have been proposed (Nagano & Hattori Reference Nagano and Hattori2003; Hattori et al.
Reference Hattori, Ohiwa, Kozuka and Nagano2009; Müller, Younis & Weigand Reference Müller, Younis and Weigand2015; Hsieh, Biringen & Kucala Reference Hsieh, Biringen and Kucala2016) and data on scalar transport in rotating channel flow may be used to validate them.
Flow configuration and coordinate system.

2 Numerical procedure
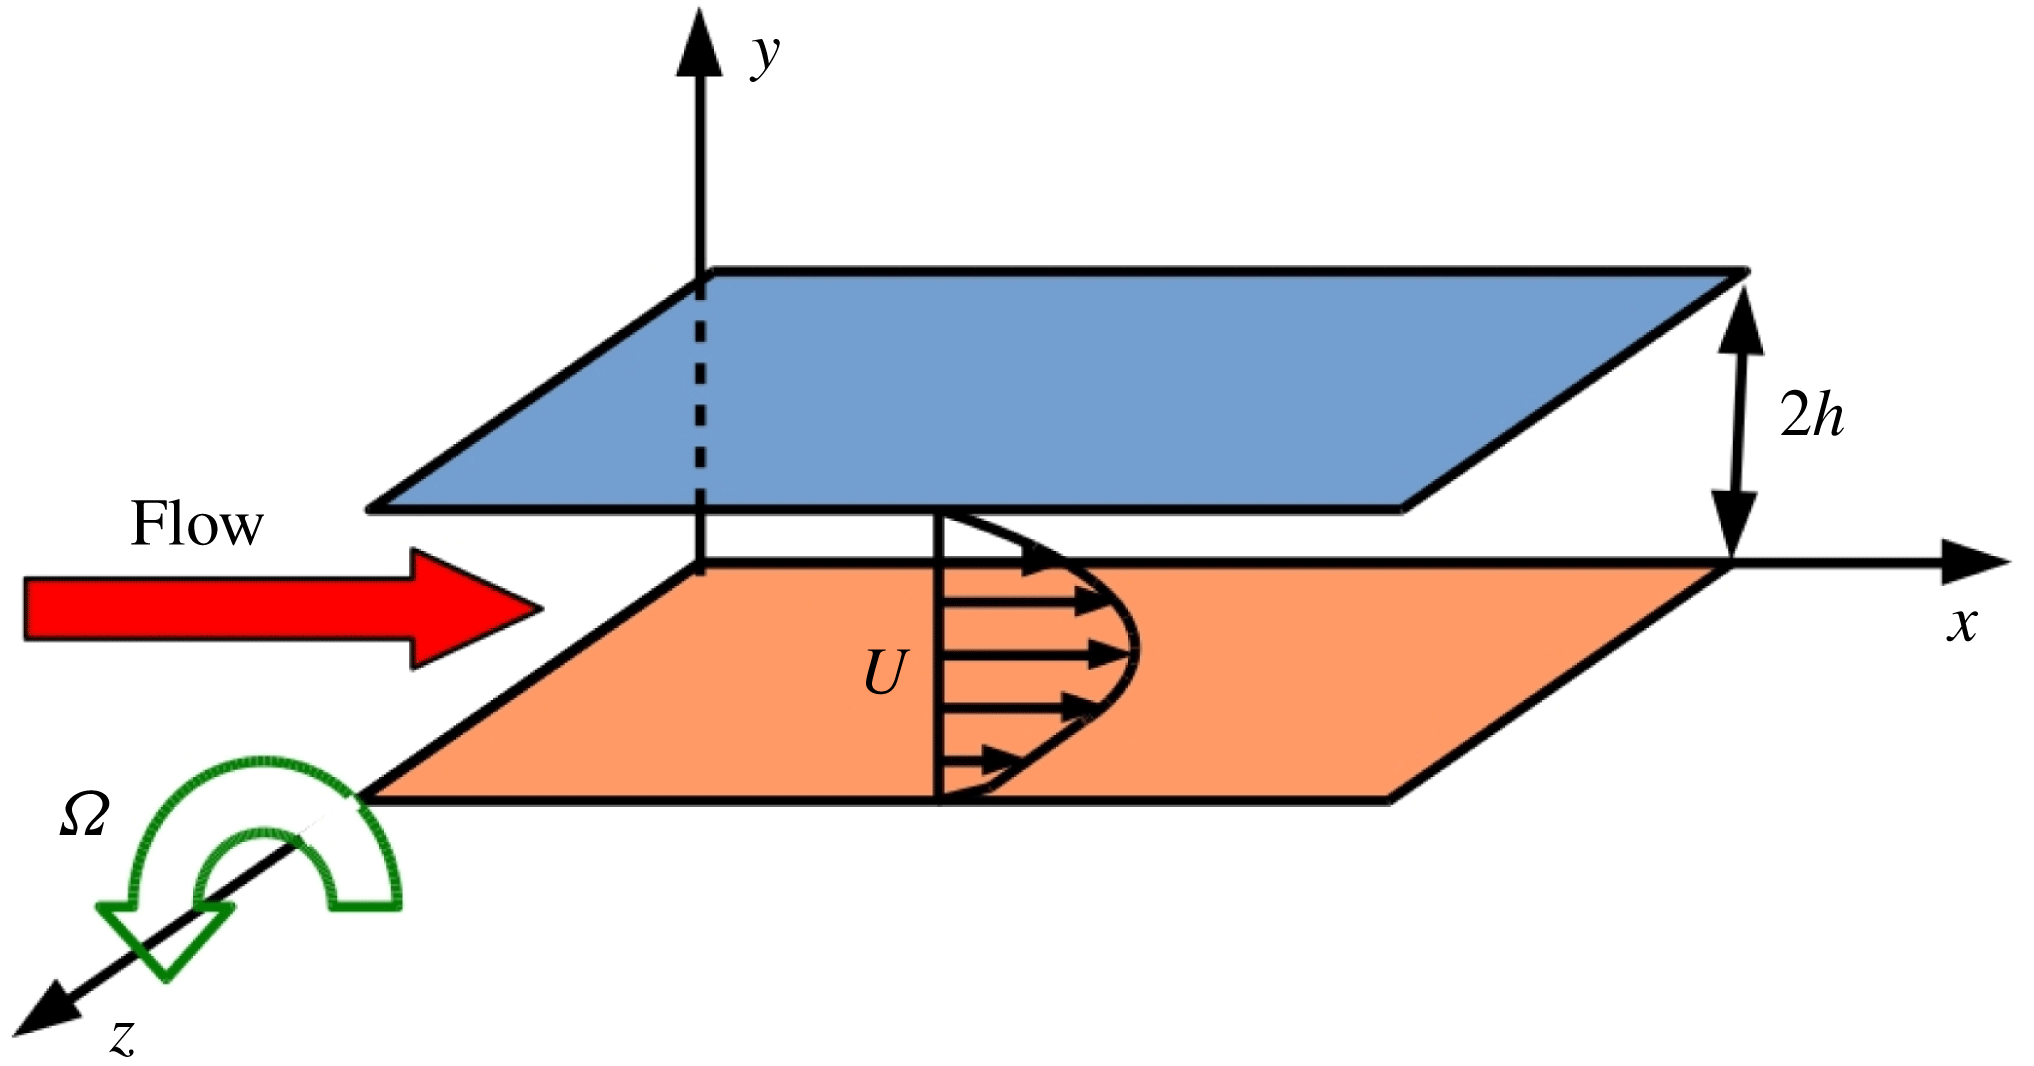
I have carried out DNS of plane turbulent channel flow with a passive scalar subject to rotation about the spanwise direction. The flow geometry and coordinate system are shown in figure 1. The incompressible Navier–Stokes equations (Brethouwer Reference Brethouwer2016) are solved with a pseudo-spectral code, as in Brethouwer (Reference Brethouwer2016, Reference Brethouwer2017), with Fourier expansions in the streamwise
 $x$
- and spanwise
 $z$
-directions and Chebyshev polynomials in the wall-normal
 $y$
-direction (Chevalier et al.
Reference Chevalier, Schlatter, Lundbladh and Henningson2014). Together with the Navier–Stokes, the code solves the advection–diffusion equation for a passive scalar,
 $$\begin{eqnarray}\frac{\unicode[STIX]{x2202}\unicode[STIX]{x1D6E9}^{\prime }}{\unicode[STIX]{x2202}t}+\boldsymbol{U}^{\prime }\boldsymbol{\cdot }\unicode[STIX]{x1D735}\unicode[STIX]{x1D6E9}^{\prime }=\frac{1}{Re\,Pr}\unicode[STIX]{x1D6FB}^{2}\unicode[STIX]{x1D6E9}^{\prime },\end{eqnarray}$$
where
 $\boldsymbol{U}^{\prime }$
is the dimensionless velocity and
 $\unicode[STIX]{x1D6E9}^{\prime }$
the scalar value. In the
 $x$
- and
 $z$
-directions, periodic boundary conditions are used for the scalar and velocity, and no-slip conditions for the velocity at the walls. Further,
 $\unicode[STIX]{x1D6E9}^{\prime }=0$
at one wall at
 $y=-1$
and
 $\unicode[STIX]{x1D6E9}^{\prime }=1$
at the other wall at
 $y=1$
, where
 $y$
is made non-dimensional with
 $h$
. The scalar is thus kept at constant but different values at the wall, as in Johansson & Wikström (Reference Johansson and Wikström1999) and Nagano & Hattori (Reference Nagano and Hattori2003). In the statistically stationary state, the mean scalar fluxes are equal at both walls.
In the DNS the flow rate and thus
 $Re$
is kept constant at
 $20\,000$
and
 $Pr=0.71$
. The domain size is
 $8\unicode[STIX]{x03C0}h$
,
 $2h$
and
 $3\unicode[STIX]{x03C0}h$
in the
 $x$
-,
 $y$
- and
 $z$
-directions, respectively, and the spatial resolution is similar to that of other DNS of turbulent channel flow (Lee & Moser Reference Lee and Moser2015). The computational domain is large enough to capture the large roll cells found at moderate
 $Ro$
(Brethouwer Reference Brethouwer2017). The rotation number
 $Ro$
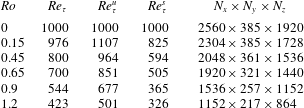
was varied from 0 (no rotation) to a quite high value of 1.2. The parameters of the DNS are listed in table 1. The friction velocity is defined as
 $u_{\unicode[STIX]{x1D70F}}=[u_{\unicode[STIX]{x1D70F}u}^{2}/2+u_{\unicode[STIX]{x1D70F}s}^{2}/2]^{1/2}$
, where
 $u_{\unicode[STIX]{x1D70F}u}$
and
 $u_{\unicode[STIX]{x1D70F}s}$
are the friction velocity of unstable and stable channel side, respectively (Grundestam et al.
Reference Grundestam, Wallin and Johansson2008). Reynolds numbers
 $Re_{\unicode[STIX]{x1D70F}}^{u}$
and
 $Re_{\unicode[STIX]{x1D70F}}^{s}$
are those based on
 $u_{\unicode[STIX]{x1D70F}u}$
and
 $u_{\unicode[STIX]{x1D70F}s}$
, respectively.
DNS parameters:
 $N_{x}$
,
 $N_{y}$
and
 $N_{z}$
are the number of modes in the streamwise, wall-normal and spanwise direction, respectively.
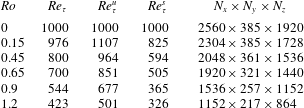
Before the statistics were collected, I ran the DNS for a sufficiently long time to reach a statistically stationary state with a constant mean scalar flux. I experienced that it can take a long time before the scalar field reaches such a state when the channel rotates.
3 Results
I will first discuss the instabilities. At
 $Re=20\,000$
a linear instability of Tollmien–Schlichting-like waves occurs when
 $Ro\geqslant 0.9$
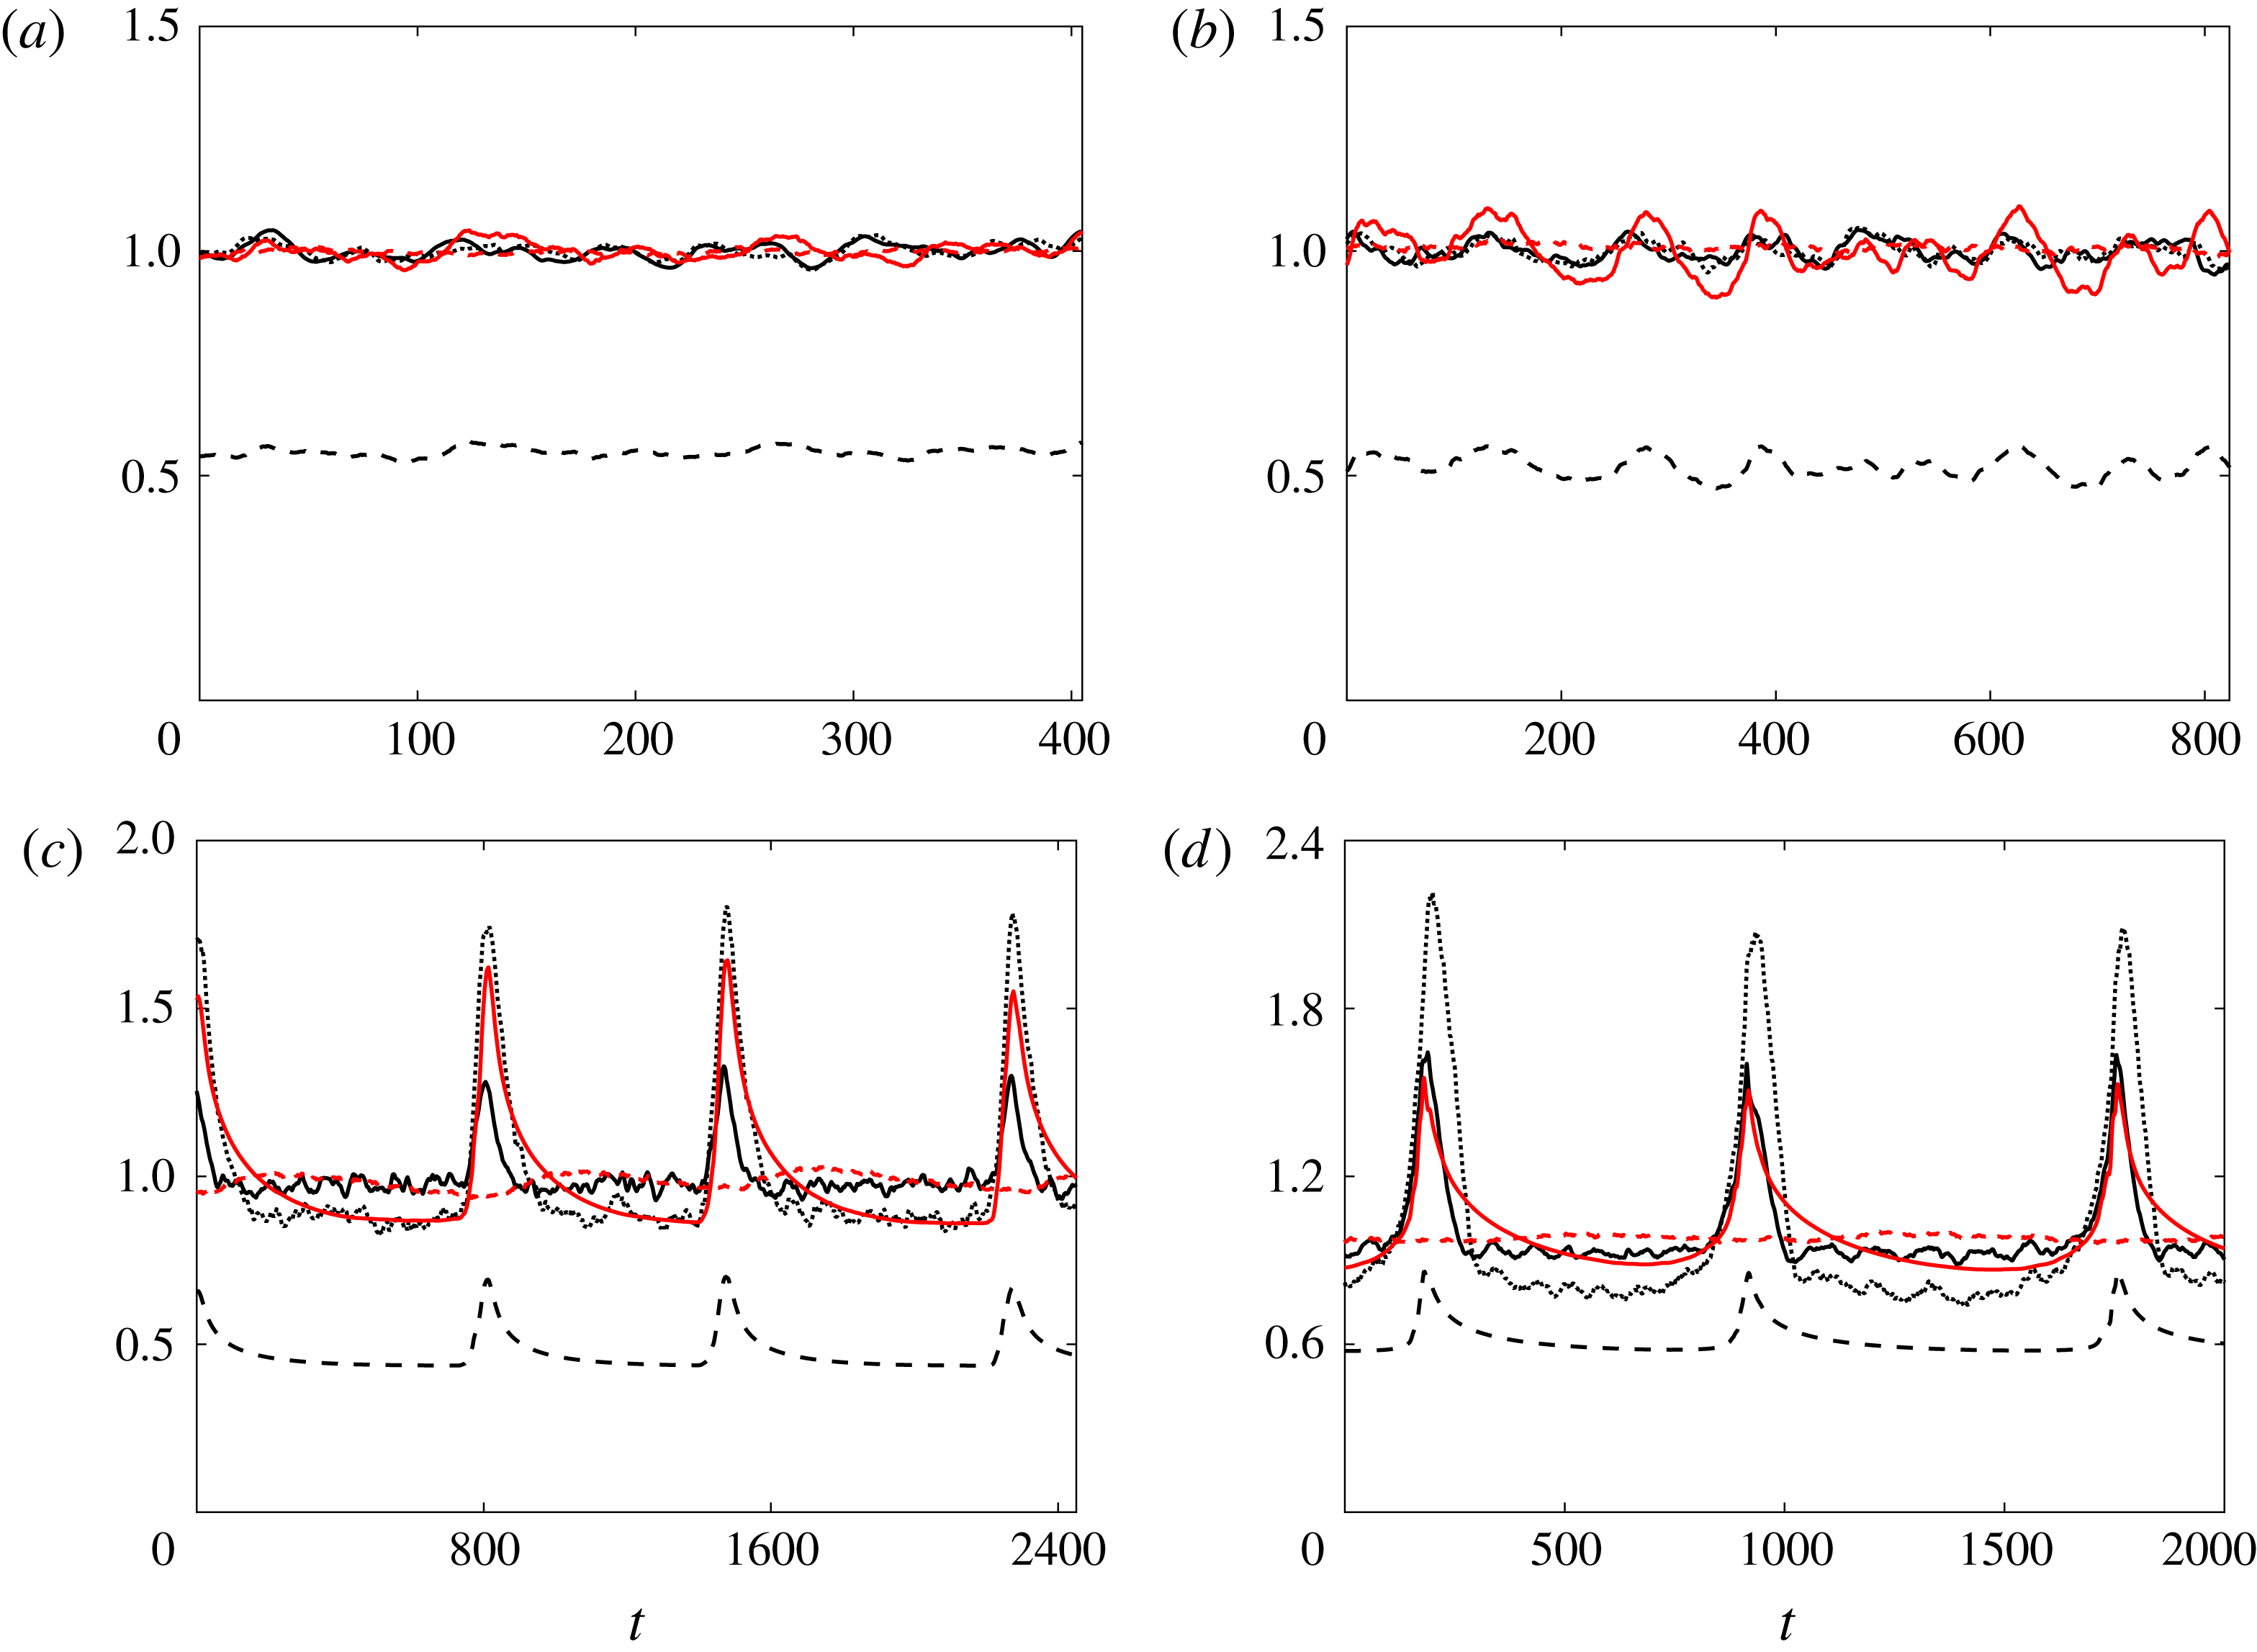
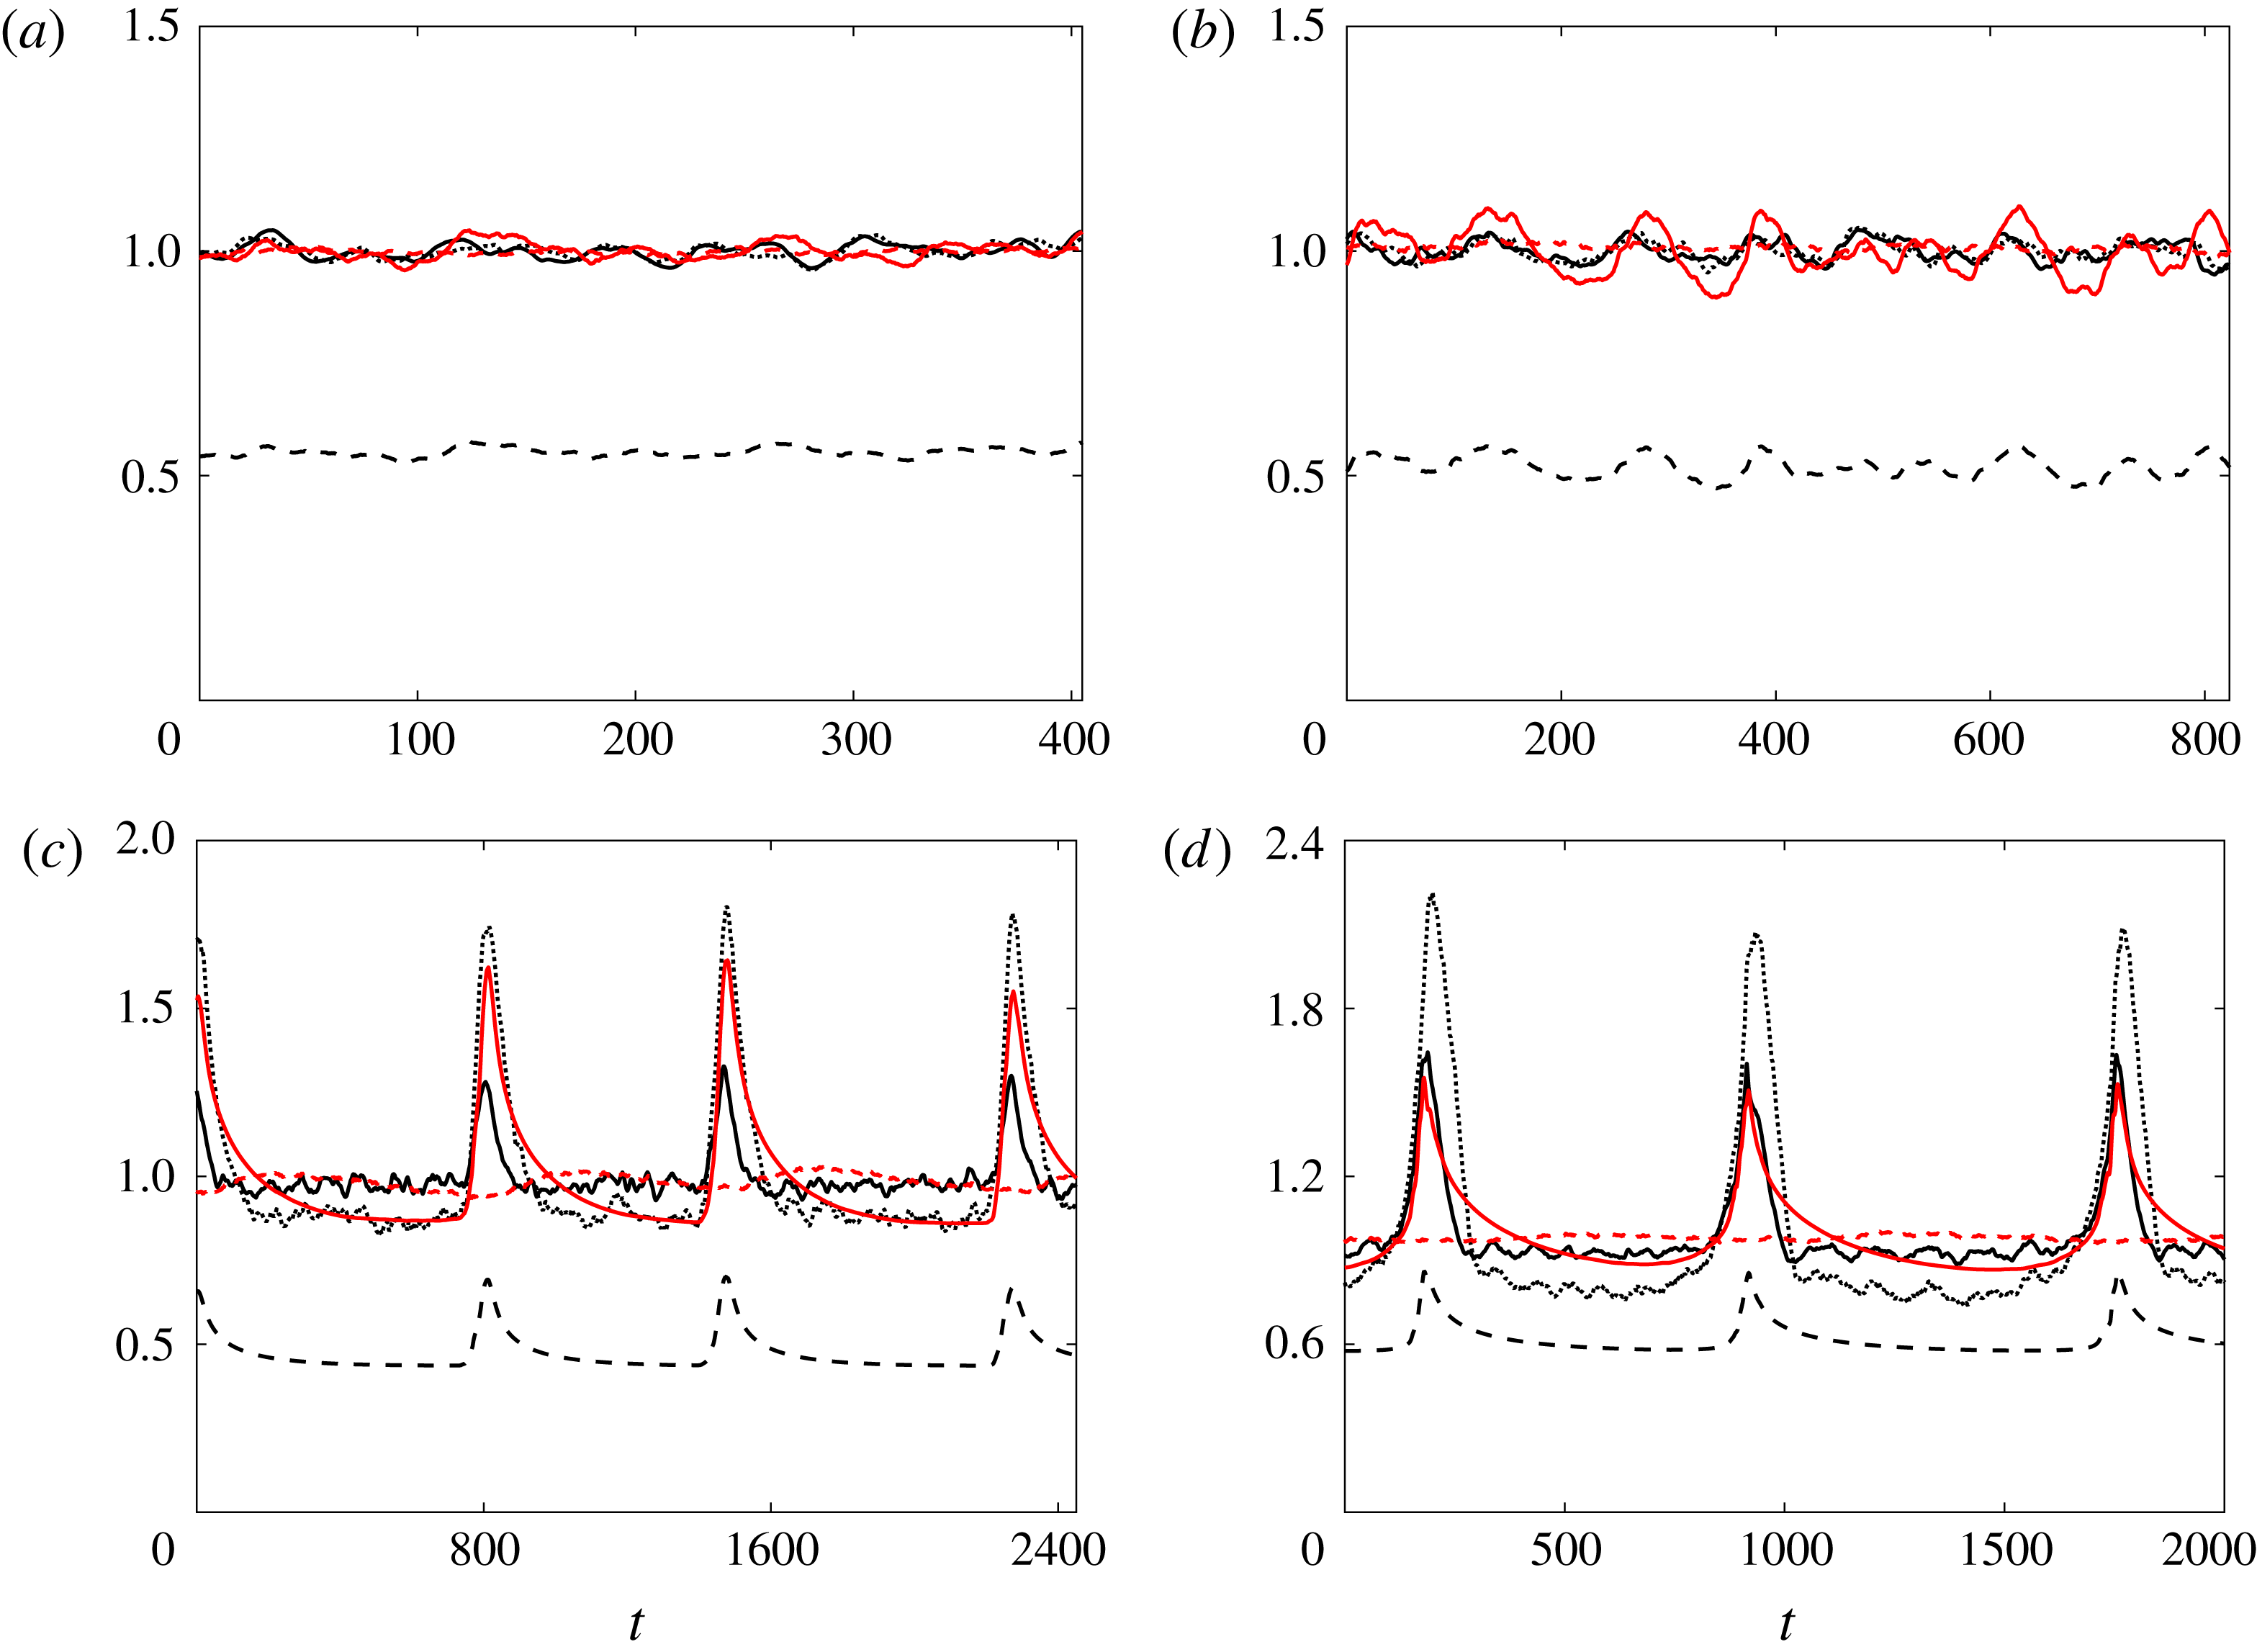
(Brethouwer Reference Brethouwer2016). This instability, whose mechanism is examined in Brethouwer et al. (Reference Brethouwer, Schlatter, Duguet, Henningson and Johansson2014) and Brethouwer (Reference Brethouwer2016), causes recurring bursts of turbulence mostly confined to the stable channel side. The instability and strong bursts naturally affect the scalar field, as shown by figure 2. In this figure, time series of the volume-averaged turbulent kinetic energy
 $K_{m}$
and root-mean-square of the scalar fluctuations
 $\unicode[STIX]{x1D703}_{m}$
are presented as well as the wall shear stress
 $\unicode[STIX]{x1D70F}_{ws}$
at
 $y=1$
and wall temperature gradients
 $(\text{d}\unicode[STIX]{x1D6E9}/\text{d}y)_{u}$
and
 $(\text{d}\unicode[STIX]{x1D6E9}/\text{d}y)_{s}$
at
 $y=-1$
and
 $y=1$
, respectively. The unstable and stable wall sides correspond to
 $y=-1$
and 1, respectively. The stress and gradients are averaged over the wall and the time
 $t$
is scaled by
 $h/U_{b}$
. When
 $Ro\leqslant 0.45$
all these quantities are approximately constant in time (figure 2
a), but at
 $Ro=0.65$
,
 $\unicode[STIX]{x1D70F}_{ws}$
and
 $(\text{d}\unicode[STIX]{x1D6E9}/\text{d}y)_{s}$
display noticeable variations caused by the growing and shrinking of the turbulent areas on the stable channel side, as discussed later. Dai et al. (Reference Dai, Huang and Xu2016) have observed similar variations of
 $\unicode[STIX]{x1D70F}_{ws}$
in their DNS and attributed these to the dynamics of streamwise roll cells. At
 $Ro=0.9$
and 1.2 time series of
 $\unicode[STIX]{x1D703}_{m}$
and
 $(\text{d}\unicode[STIX]{x1D6E9}/\text{d}y)_{s}$
show simultaneously with
 $K_{m}$
and
 $\unicode[STIX]{x1D70F}_{ws}$
recurring sharp peaks with a time interval of approximately
 $700t$
, whereas
 $(\text{d}\unicode[STIX]{x1D6E9}/\text{d}y)_{u}$
and the wall shear stress at
 $y=-1$
(not shown) stay approximately constant. This shows that the bursts of turbulence triggered by the linear instability cause sharp and significant but relatively short surges in the scalar fluctuations and scalar flux at the wall on the stable channel side. Such recurring bursts are also observed at higher
 $Ro$
. However, when
 $Ro\geqslant 2.1$
and turbulence is weak in the whole channel (Brethouwer Reference Brethouwer2017), the bursts trigger sharp spikes in the scalar flux not only at the wall at
 $y=1$
but also at the other wall (not shown). The long interval between the bursts is related to the slow growth of the linear instability (Brethouwer Reference Brethouwer2016).
Time series at (a)
 $R=0.45$
, (b)
 $R=0.65$
, (c)
 $R=0.9$
and (d)
 $R=1.2$
of the volume-averaged
 $K_{m}$
(solid black) and
 $\unicode[STIX]{x1D703}_{m}$
(dotted), and wall gradients
 $\unicode[STIX]{x1D70F}_{ws}$
(dashed black),
 $(\text{d}\unicode[STIX]{x1D6E9}/\text{d}y)_{u}$
(dashed red) and
 $(\text{d}\unicode[STIX]{x1D6E9}/\text{d}y)_{s}$
(solid red). Here
 $\unicode[STIX]{x1D70F}_{ws}$
is normalized with the time-averaged wall shear on both walls, whereas the other quantities are normalized with their respective time-averaged values.
Although interesting, I will not further explore these recurring bursts in the DNS at
 $Ro\geqslant 0.9$
but focus in the rest of the paper in these DNS on the relatively calm periods between the bursts. From a modelling point of view these calm periods are more relevant and give a better fundamental insight into the influence of rotation on turbulent scalar transport. Including the bursts would add further complexity to the problem. I therefore compute the velocity and scalar statistics from the statistics collected during the calm periods between the bursts. In Brethouwer (Reference Brethouwer2017) I explain in more detail how I exclude the periods with the bursts from the statistics.
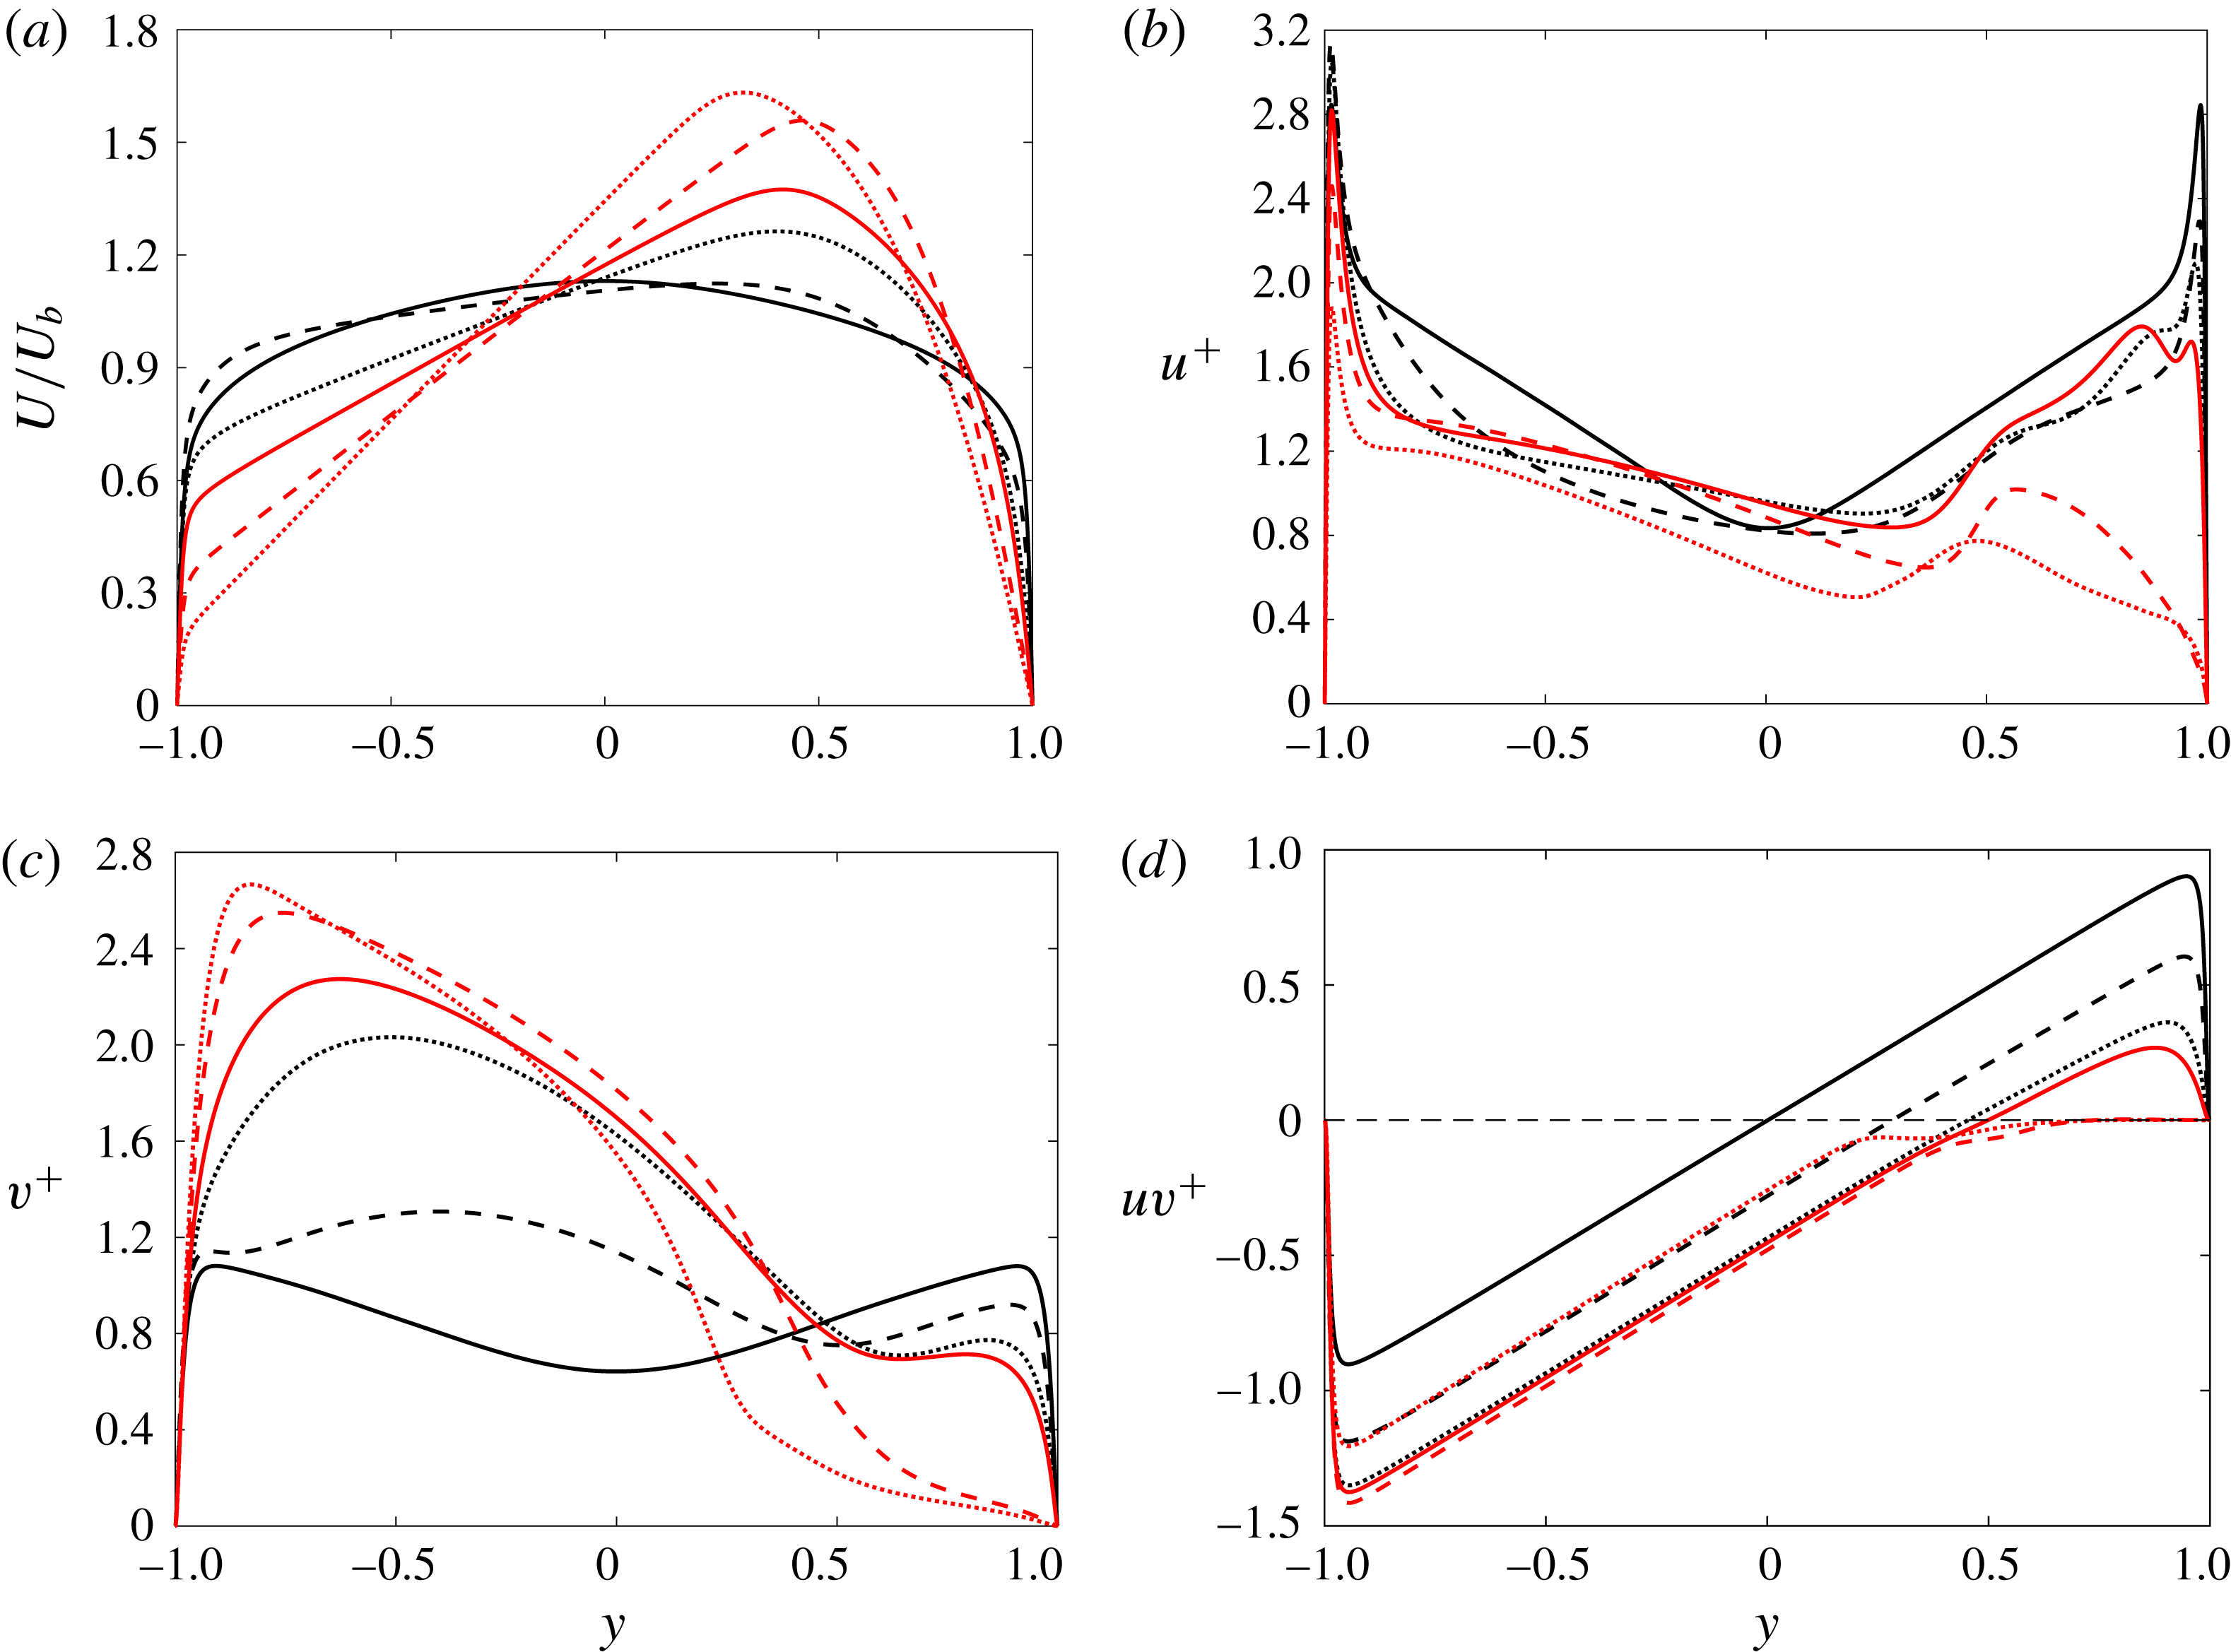
Profiles of (a)
 $U/U_{b}$
, (b)
 $u^{+}$
, (c)
 $v^{+}$
and (d)
 $uv^{+}$
for
 $Ro=0$
(solid black),
 $Ro=0.15$
(dashed black),
 $Ro=0.45$
(dotted black),
 $Ro=0.65$
(solid red),
 $Ro=0.9$
(dashed red) and
 $Ro=1.2$
(dotted red).

3.1 Flow statistics
Before discussing results on scalar transport, I will briefly discuss some one-point flow statistics. Further studies of rotating channel flow are presented in Brethouwer (Reference Brethouwer2016, Reference Brethouwer2017) and publications cited in the introduction. Note that in this paper I show results for
 $Re=20\,000$
whereas in Brethouwer (Reference Brethouwer2017) I often show results for other
 $Re$
. Here below,
 $U$
denotes the mean streamwise velocity and
 $u$
,
 $v$
and
 $w$
the streamwise, wall-normal and spanwise velocity fluctuations, respectively. An overbar implies averaging over time and homogeneous
 $x$
- and
 $z$
-directions.
Figure 3(a) shows that profiles of
 $U/U_{b}$
for
 $Ro>0$
are skewed and have a linear slope part with
 $\text{d}U/\text{d}y\simeq 2\unicode[STIX]{x1D6FA}$
on the unstable side. Figure 3(b,c) shows profiles of the root-mean-square of the streamwise and wall-normal velocity fluctuations
 $u^{+}$
and
 $v^{+}$
respectively scaled by
 $u_{\unicode[STIX]{x1D70F}}$
. On the stable side
 $u^{+}$
is strongly reduced by rotation and the sharp near-wall peak disappears. The maximum of
 $v^{+}$
grows (respectively, decays) monotonically with
 $Ro$
on the unstable (respectively, stable) side, while the normalized Reynolds shear stress,
 $uv^{+}=\overline{uv}/u_{\unicode[STIX]{x1D70F}}^{2}$
, decays with
 $Ro$
on the stable side (figure 3
d). Both
 $v^{+}$
and
 $uv^{+}$
are small or nearly zero on the stable side if
 $Ro\geqslant 0.9$
. When
 $Ro$
is further raised, turbulence also becomes weak on the unstable side, and if
 $Ro\geqslant 2.4$
turbulent momentum transfer is negligible and the flow approaches a laminar state (Brethouwer Reference Brethouwer2017). In the DNS
 $Re$
is constant but
 $Re_{\unicode[STIX]{x1D70F}}$
decreases with
 $Ro$
(see table 1), owing to the declining Reynolds stresses. Before decaying, the wall friction and related
 $Re_{\unicode[STIX]{x1D70F}}^{u}$
on the unstable side rise at first with
 $Ro$
, which is probably related to large roll cells that notably contribute to the Reynolds stresses at these
 $Ro$
(Kristoffersen & Andersson Reference Kristoffersen and Andersson1993).
3.2 Visualizations of the scalar field
One-dimensional velocity spectra at
 $Re=20\,000$
and
 $0\leqslant Ro\leqslant 0.9$
and visualizations of the instantaneous flow field are presented in Brethouwer (Reference Brethouwer2017). These show the presence of long streamwise counter-rotating roll cells on the unstable channel side at
 $Ro=0.15$
with a spanwise size of
 $\unicode[STIX]{x03C0}h/2$
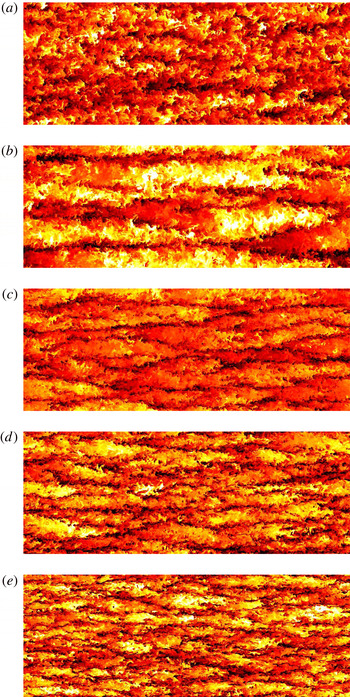
. The roll cells have an impact on the scalar field visualized in figure 4. Whereas no clear coherent structures can be seen in the scalar field at
 $Ro=0$
(figure 4
a), narrow streaks with low scalar values aligned with the flow direction caused by updrafts between the counter-rotating roll cells are observed in the
 $x$
–
 $z$
plane on the unstable side at
 $Ro=0.15$
in the outer layer (figure 4
b). With increasing
 $Ro$
roll cells tend to become smaller and less obvious. Accordingly, the streaks with low scalar values become less coherent and the spanwise distance between them diminishes (figure 4
c,d) and at
 $Ro=0.9$
roll cells are hardly perceptible (figure 4
e). These observations are consistent with energy spectra presented in Brethouwer (Reference Brethouwer2017).
Visualizations of the instantaneous scalar field in an
 $x$
–
 $z$
plane at (a)
 $Ro=0$
and
 $y=-0.6$
, (b)
 $Ro=0.15$
and
 $y=-0.6$
, (c)
 $Ro=0.45$
and
 $y=-0.8$
, (d)
 $Ro=0.65$
and
 $y=-0.8$
, and (e)
 $Ro=0.9$
and
 $y=-0.85$
. Dark colours correspond to low scalar values and the
 $x$
-direction is horizontal.

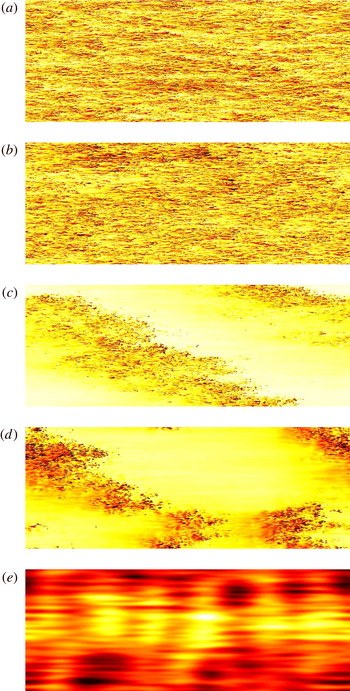
Figure 5 shows the instantaneous scalar gradient at the wall at
 $y=1$
on the stable side. Fluctuations in the scalar gradient show that the flow is fully turbulent if
 $Ro\leqslant 0.15$
(figure 5
a,b), but at
 $Ro=0.45$
it partly relaminarizes on the stable side and oblique banded patterns develop with alternating turbulent and laminar-like flow (Brethouwer Reference Brethouwer2017). A corresponding pattern emerges in the scalar field with oblique banded regions with strong scalar gradient fluctuations induced by turbulence and regions where these gradient fluctuations are mostly absent since the flow is locally laminar-like (figure 5
c). Similar oblique turbulent–laminar patterns have been observed in several flow types (Duguet, Schlatter & Henningson Reference Duguet, Schlatter and Henningson2010; Brethouwer, Duguet & Schlatter Reference Brethouwer, Duguet and Schlatter2012; Deusebio et al.
Reference Deusebio, Brethouwer, Schlatter and Lindborg2014). A distinguishing feature in the present case is that the patterns do not span the whole channel but are found only on the stable side. The angle of the oblique patterns with respect to the flow direction is set by the aspect ratio of the computational domain owing to the periodic boundary conditions but is nonetheless similar to other flow cases and DNS with larger domains (Duguet et al.
Reference Duguet, Schlatter and Henningson2010; Brethouwer et al.
Reference Brethouwer, Duguet and Schlatter2012). At a higher
 $Ro=0.65$
the patterns with turbulence and strong scalar gradient fluctuations become less coherent (figure 5
d). They also appear to become more unsteady and their size varies in time, as indicated by other visualizations (not shown) and temporal variations in the mean scalar gradient and skin friction at
 $y=1$
, shown before. When the computational domain is enlarged, the number of turbulent bands or spots grows (Brethouwer et al.
Reference Brethouwer, Duguet and Schlatter2012), which could have some influence on scalar statistics, but this influence is expected to be limited since at least one band or spot is captured by the present DNS. However, statistics are possibly severely affected if the computational domain is reduced and the patterns not resolved any longer. When
 $Ro\geqslant 0.9$
, fluctuations are weak on the stable side and small-scale fluctuations in the scalar gradient field cannot be observed (figure 5
e), implying that near-wall turbulence is suppressed by rotation.
Visualizations of the instantaneous scalar gradient at
 $y=1$
at (a)
 $Ro=0$
, (b)
 $Ro=0.15$
, (c)
 $Ro=0.45$
, (d)
 $Ro=0.65$
and (e)
 $Ro=0.9$
. Dark colours correspond to large scalar gradients and the
 $x$
-direction is horizontal.

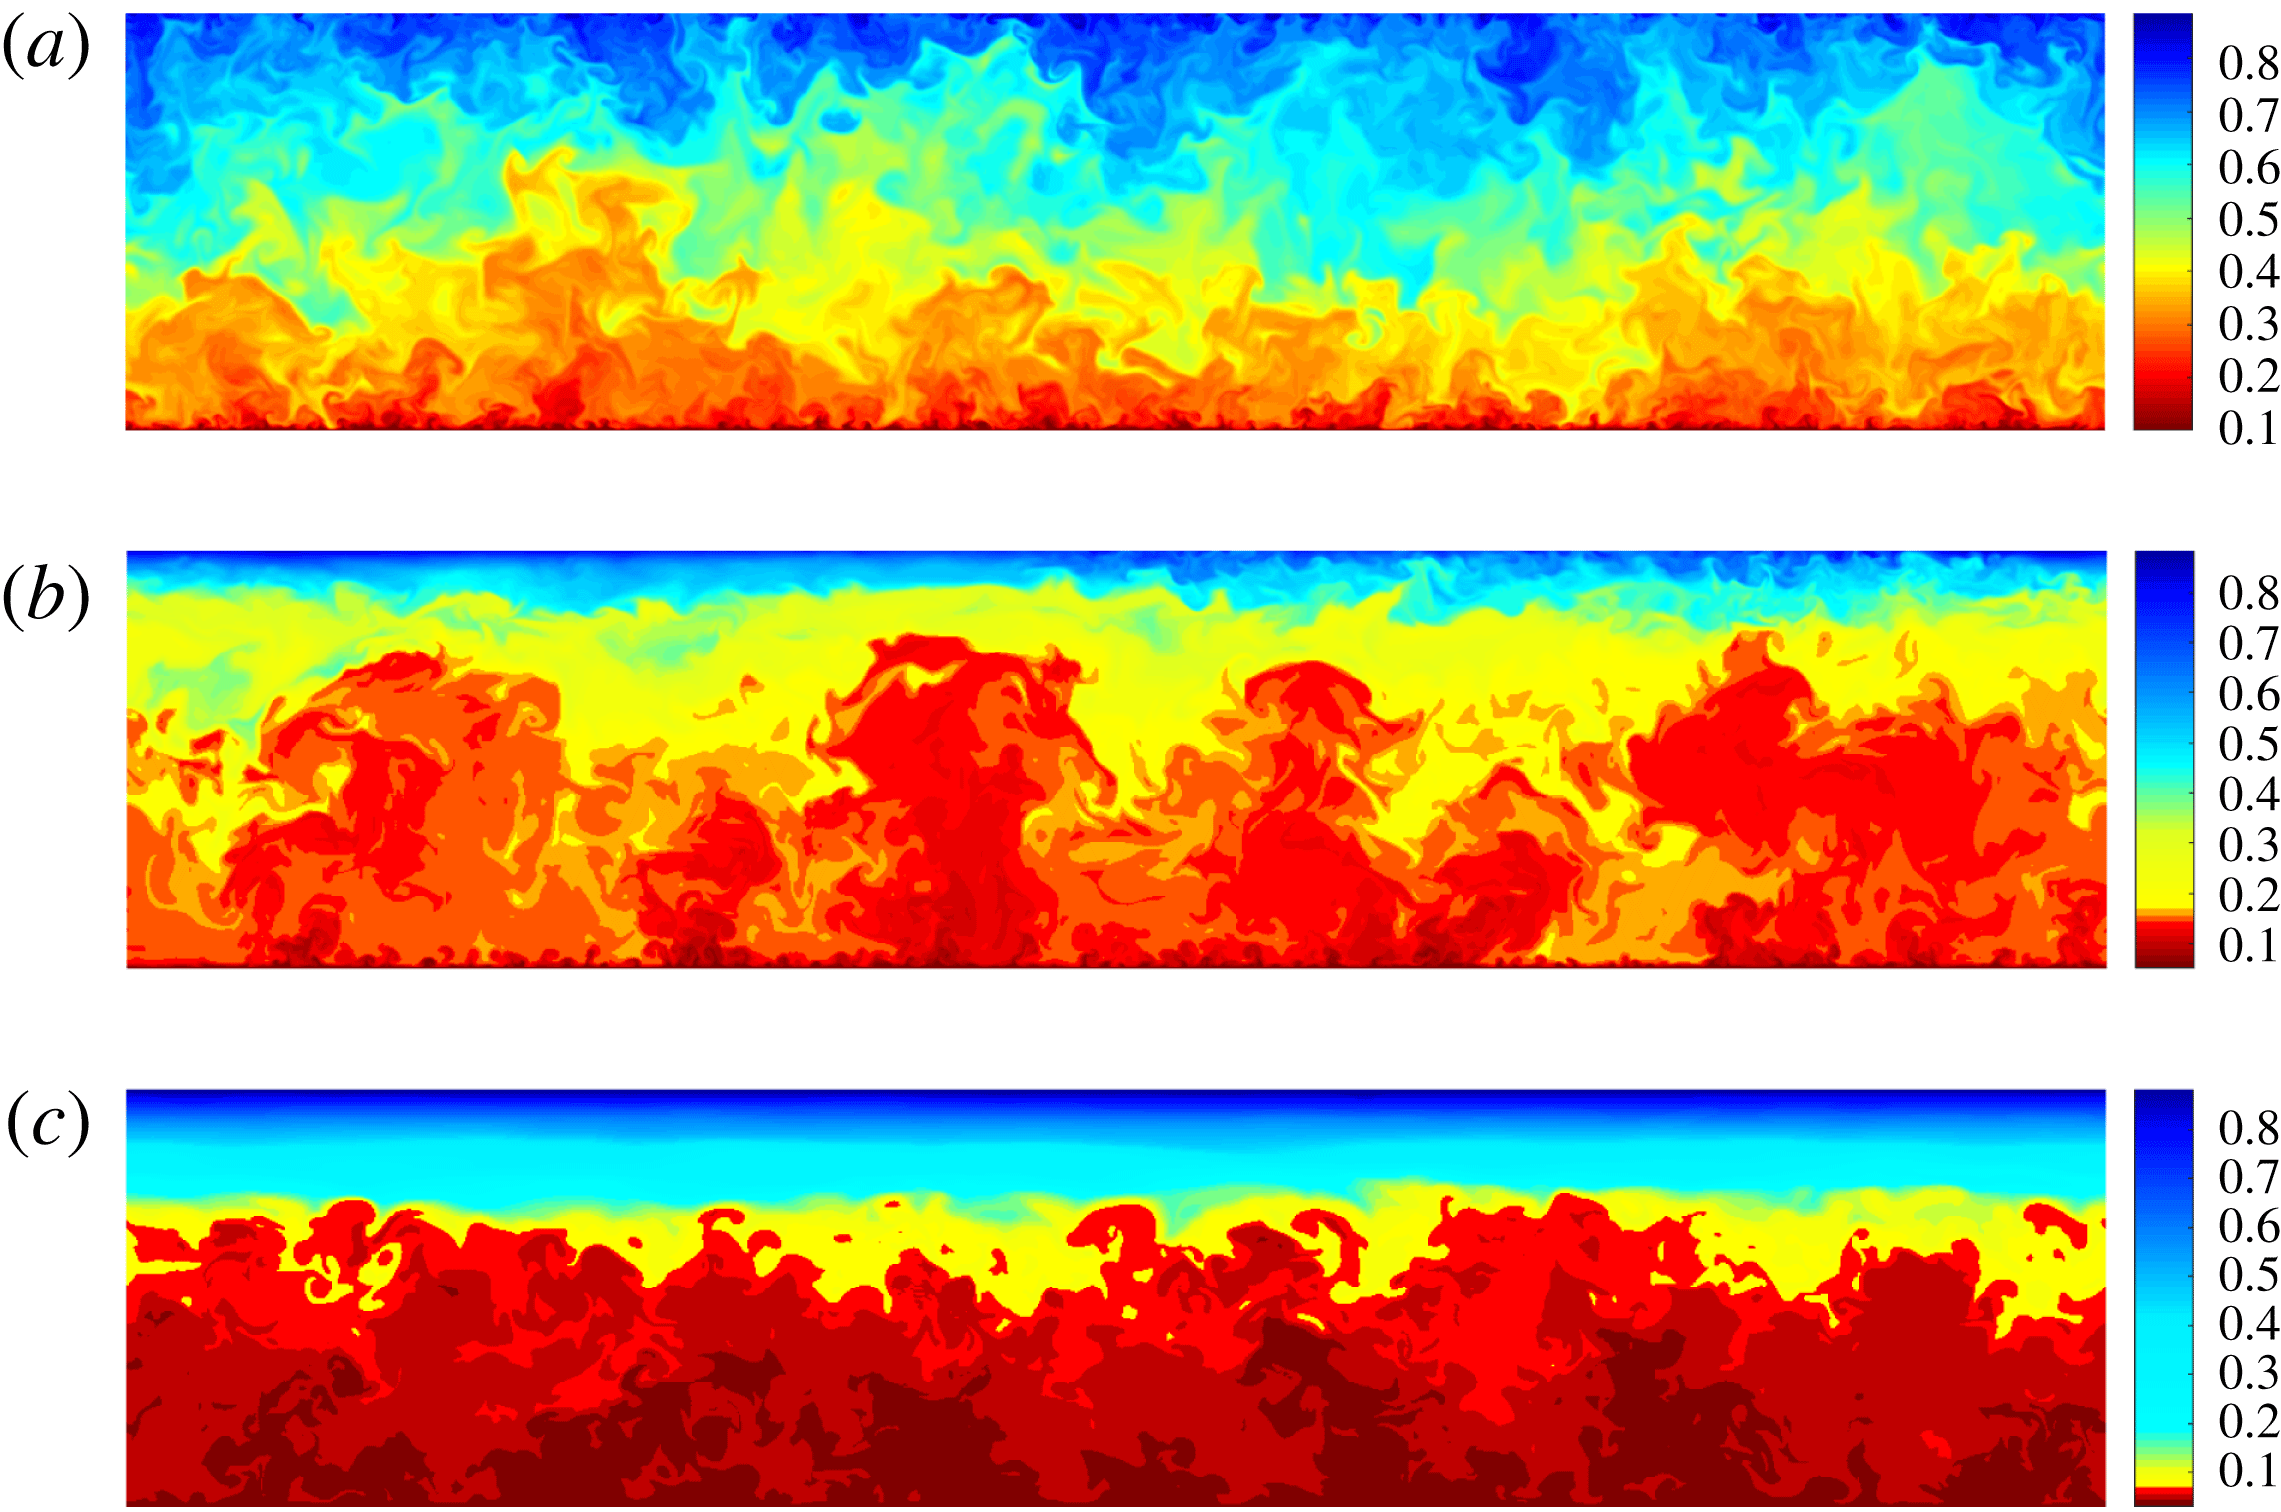
Instantaneous plots of the scalar field in a
 $y$
–
 $z$
plane at
 $Ro=0$
, 0.45 and 0.9 are shown in figure 6. At
 $Ro=0.45$
, the visualization reveals large plume-like structures (figure 6
b), which are probably caused by the large streamwise roll cells. At higher
 $Ro$
and
 $Ro=0$
, roll cells are absent or much smaller (Brethouwer Reference Brethouwer2017) and accordingly no or less large plumes are seen in the scalar field (figure 6
a,c). Large jumps in the scalar field are observed when
 $Ro>0$
in the core region near the interface between the stable and unstable side where the mean scalar gradient is large, as shown later. This interface appears quite sharp at higher
 $Ro$
when the flow relaminarizes on the stable side (Brethouwer Reference Brethouwer2017) and shifts to the unstable side with
 $Ro$
. Small-scale fluctuations related to turbulence appear absent on the stable side at
 $Ro=0.9$
(figure 6
c).
Visualizations of the instantaneous scalar field in a
 $y$
–
 $z$
plane at (a)
 $Ro=0$
, (b)
 $Ro=0.45$
and (c)
 $Ro=0.9$
. Red and blue colours correspond to low and high scalar values, respectively, and
 $y$
is in the vertical direction.

3.3 Passive scalar transport
In this section, I discuss basic statistics of the scalar field and scalar transport. Here below,
 $\unicode[STIX]{x1D6E9}$
is used to denote the mean scalar averaged over time and
 $x$
- and
 $z$
-directions, and
 $\unicode[STIX]{x1D703}$
the scalar fluctuation. A superscript
 $+$
implies, unless stated otherwise, scaling in terms of wall units
 $\unicode[STIX]{x1D708}$
,
 $u_{\unicode[STIX]{x1D70F}}$
and
 $\unicode[STIX]{x1D703}_{\unicode[STIX]{x1D70F}}=Q_{w}/u_{\unicode[STIX]{x1D70F}}$
, where
 $Q_{w}=\unicode[STIX]{x1D6FC}(\text{d}\unicode[STIX]{x1D6E9}/\text{d}y)_{w}$
is the mean scalar flux at the wall, which is equal at both walls in the statistically stationary state.
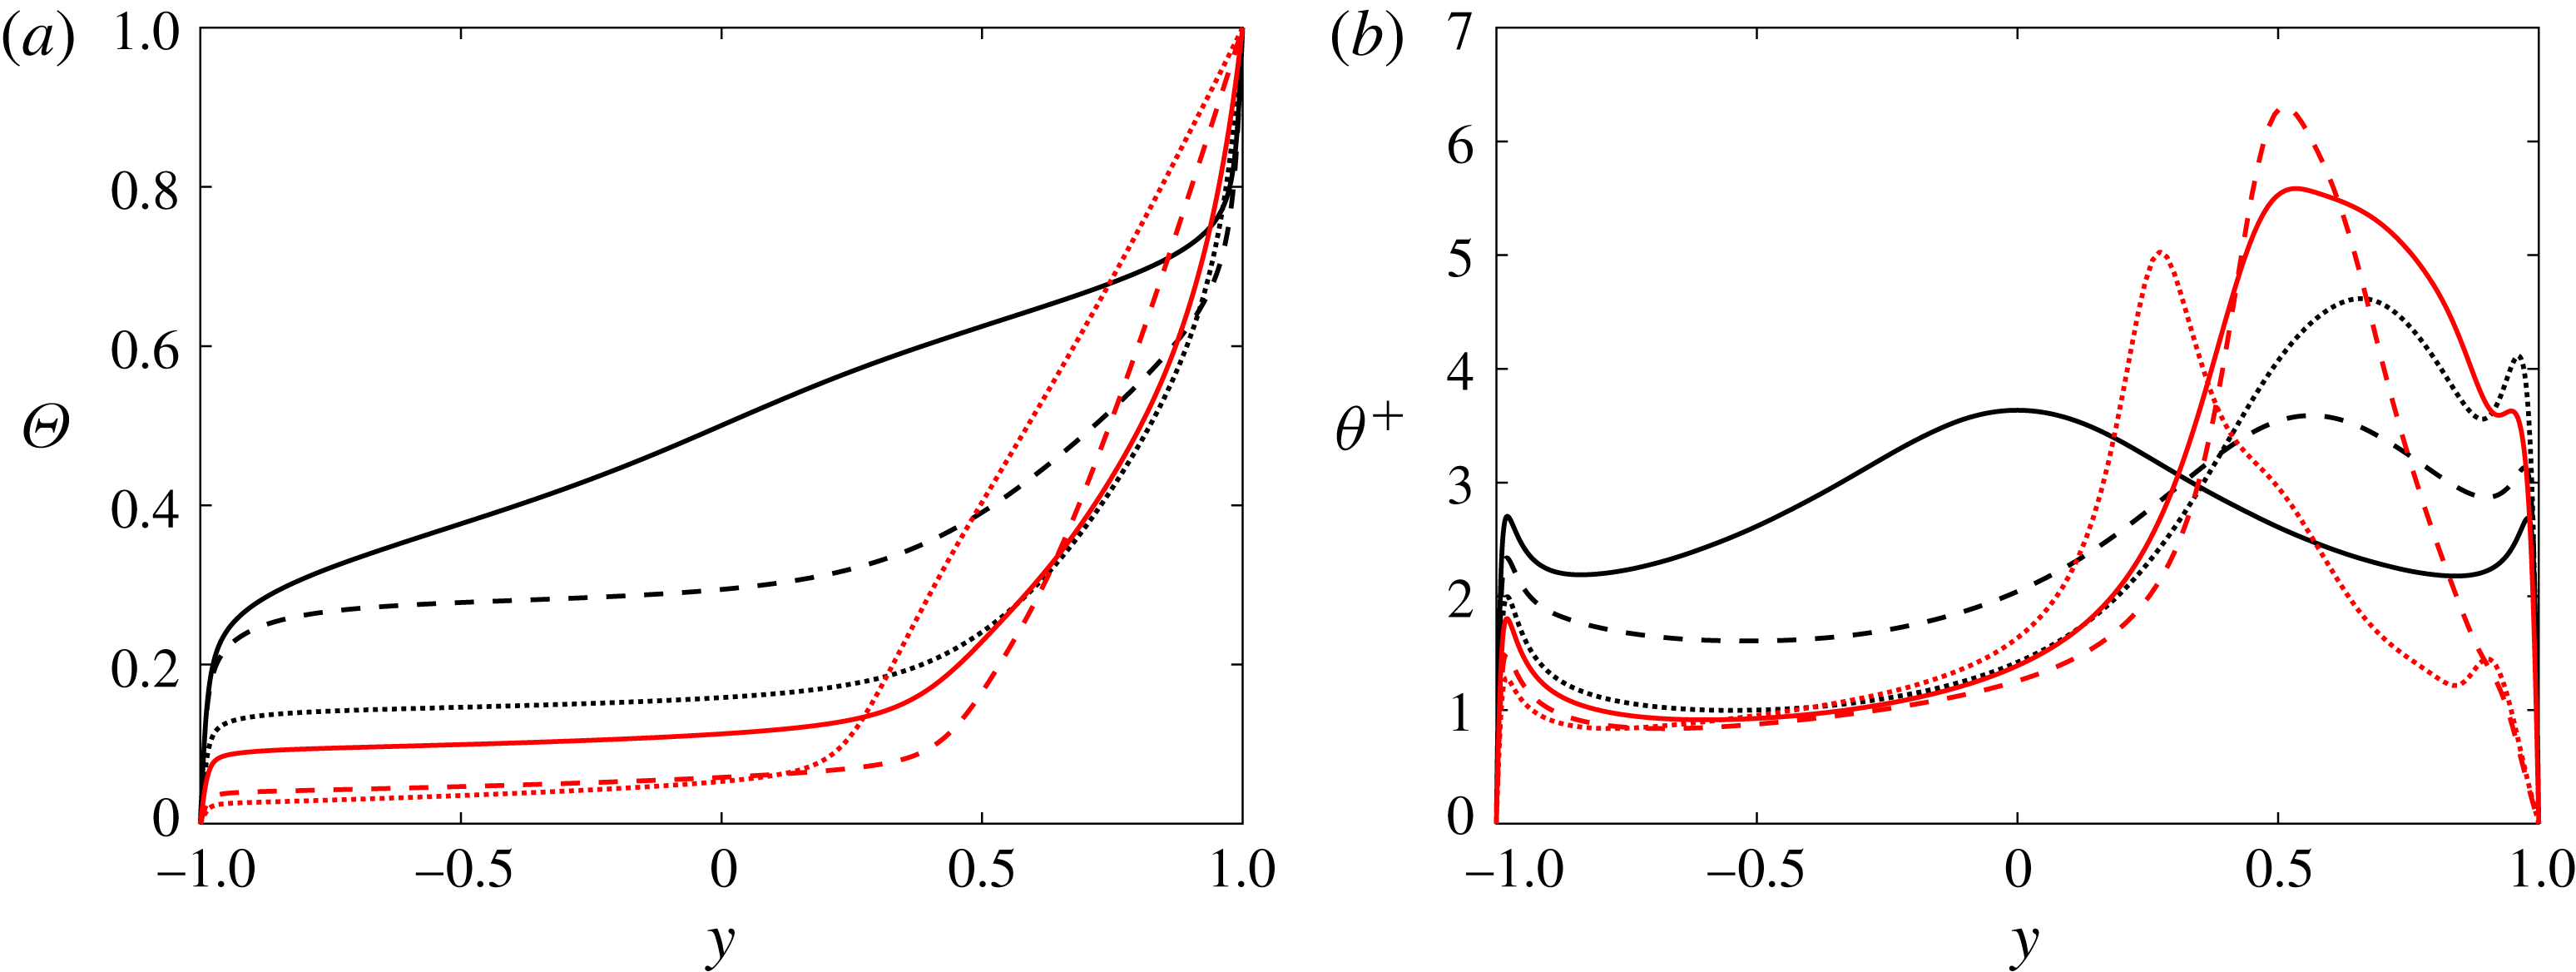
Figure 7(a) shows profiles of
 $\unicode[STIX]{x1D6E9}$
at different
 $Ro$
. The mean scalar
 $\unicode[STIX]{x1D6E9}$
goes down monotonically with
 $Ro$
on the unstable channel side, while on the stable side the mean scalar gradient becomes steep. This can be understood by considering the steady-state mean scalar transport across the channel in wall units,
 $$\begin{eqnarray}\frac{1}{Pr}\frac{\text{d}\unicode[STIX]{x1D6E9}^{+}}{\text{d}y^{+}}-\overline{v\unicode[STIX]{x1D703}}^{+}=1.\end{eqnarray}$$
If
 $Ro>0$
,
 $\overline{v\unicode[STIX]{x1D703}}$
is reduced on the stable side, as shown later, which naturally implies a large
 $\text{d}\unicode[STIX]{x1D6E9}/\text{d}y$
to maintain the scalar flux balance. Profiles of the root-mean-square of the scalar fluctuations
 $\unicode[STIX]{x1D703}^{+}$
are shown in figure 7(b). At
 $Ro=0$
the profile of
 $\unicode[STIX]{x1D703}^{+}$
not only has peaks near both walls caused by intense near-wall turbulence but also has a maximum at the centre as a result of a large
 $\text{d}\unicode[STIX]{x1D6E9}/\text{d}y$
and related high production of scalar fluctuations, as shown later. When
 $0.15\leqslant Ro\leqslant 0.65$
,
 $\unicode[STIX]{x1D703}^{+}$
including the near-wall peak on the unstable side declines with
 $Ro$
but grows on the stable side owing to a high production of scalar fluctuations, as shown later. The cause of the high production is a large
 $\text{d}\unicode[STIX]{x1D6E9}/\text{d}y$
together with a significant
 $\overline{v\unicode[STIX]{x1D703}}$
on the stable side at these
 $Ro$
, although turbulence is here weakened by rotation. At higher
 $Ro$
,
 $\unicode[STIX]{x1D703}^{+}$
declines in the near-wall region of the stable side owing to the relaminarization of the flow while it is large further away from the wall where
 $\overline{v\unicode[STIX]{x1D703}}$
is still considerable and
 $\text{d}\unicode[STIX]{x1D6E9}/\text{d}y$
large. Quite similar trends for the profiles of
 $\unicode[STIX]{x1D6E9}$
and
 $\unicode[STIX]{x1D703}^{+}$
are observed at low
 $Re$
(Nagano & Hattori Reference Nagano and Hattori2003; Liu & Lu Reference Liu and Lu2007).
Profiles of (a)
 $\unicode[STIX]{x1D6E9}$
and (b)
 $\unicode[STIX]{x1D703}^{+}$
. Lines as in figure 3.

Figure 8 shows
 $U^{+}$
and
 $\unicode[STIX]{x1D6E9}^{+}$
profiles on the unstable side as a function of the distance to the wall in wall units
 $y^{+}$
. The
 $U^{+}$
profile at
 $Ro=0$
follows approximately a log-law behaviour between the near-wall and centre region. This is not observed if
 $Ro>0$
and cannot be expected since the velocity profile depends on
 $Ro$
. Previous studies have shown that in the overlap region of non-rotating channel flow the
 $\unicode[STIX]{x1D6E9}^{+}$
profile has a similar log-law behaviour as the velocity (Kawamura et al.
Reference Kawamura, Abe and Matsuo1999; Pirozzoli et al.
Reference Pirozzoli, Bernardini and Orlandi2016). Accordingly, in the present DNS at
 $Ro=0$
, the profile in the overlap region approximately matches
 $$\begin{eqnarray}\unicode[STIX]{x1D6E9}^{+}=\frac{1}{\unicode[STIX]{x1D705}_{\unicode[STIX]{x1D703}}}\log y^{+}+C_{\unicode[STIX]{x1D703}},\end{eqnarray}$$
with
 $\unicode[STIX]{x1D705}_{\unicode[STIX]{x1D703}}=0.42$
and
 $C_{\unicode[STIX]{x1D703}}=2.8$
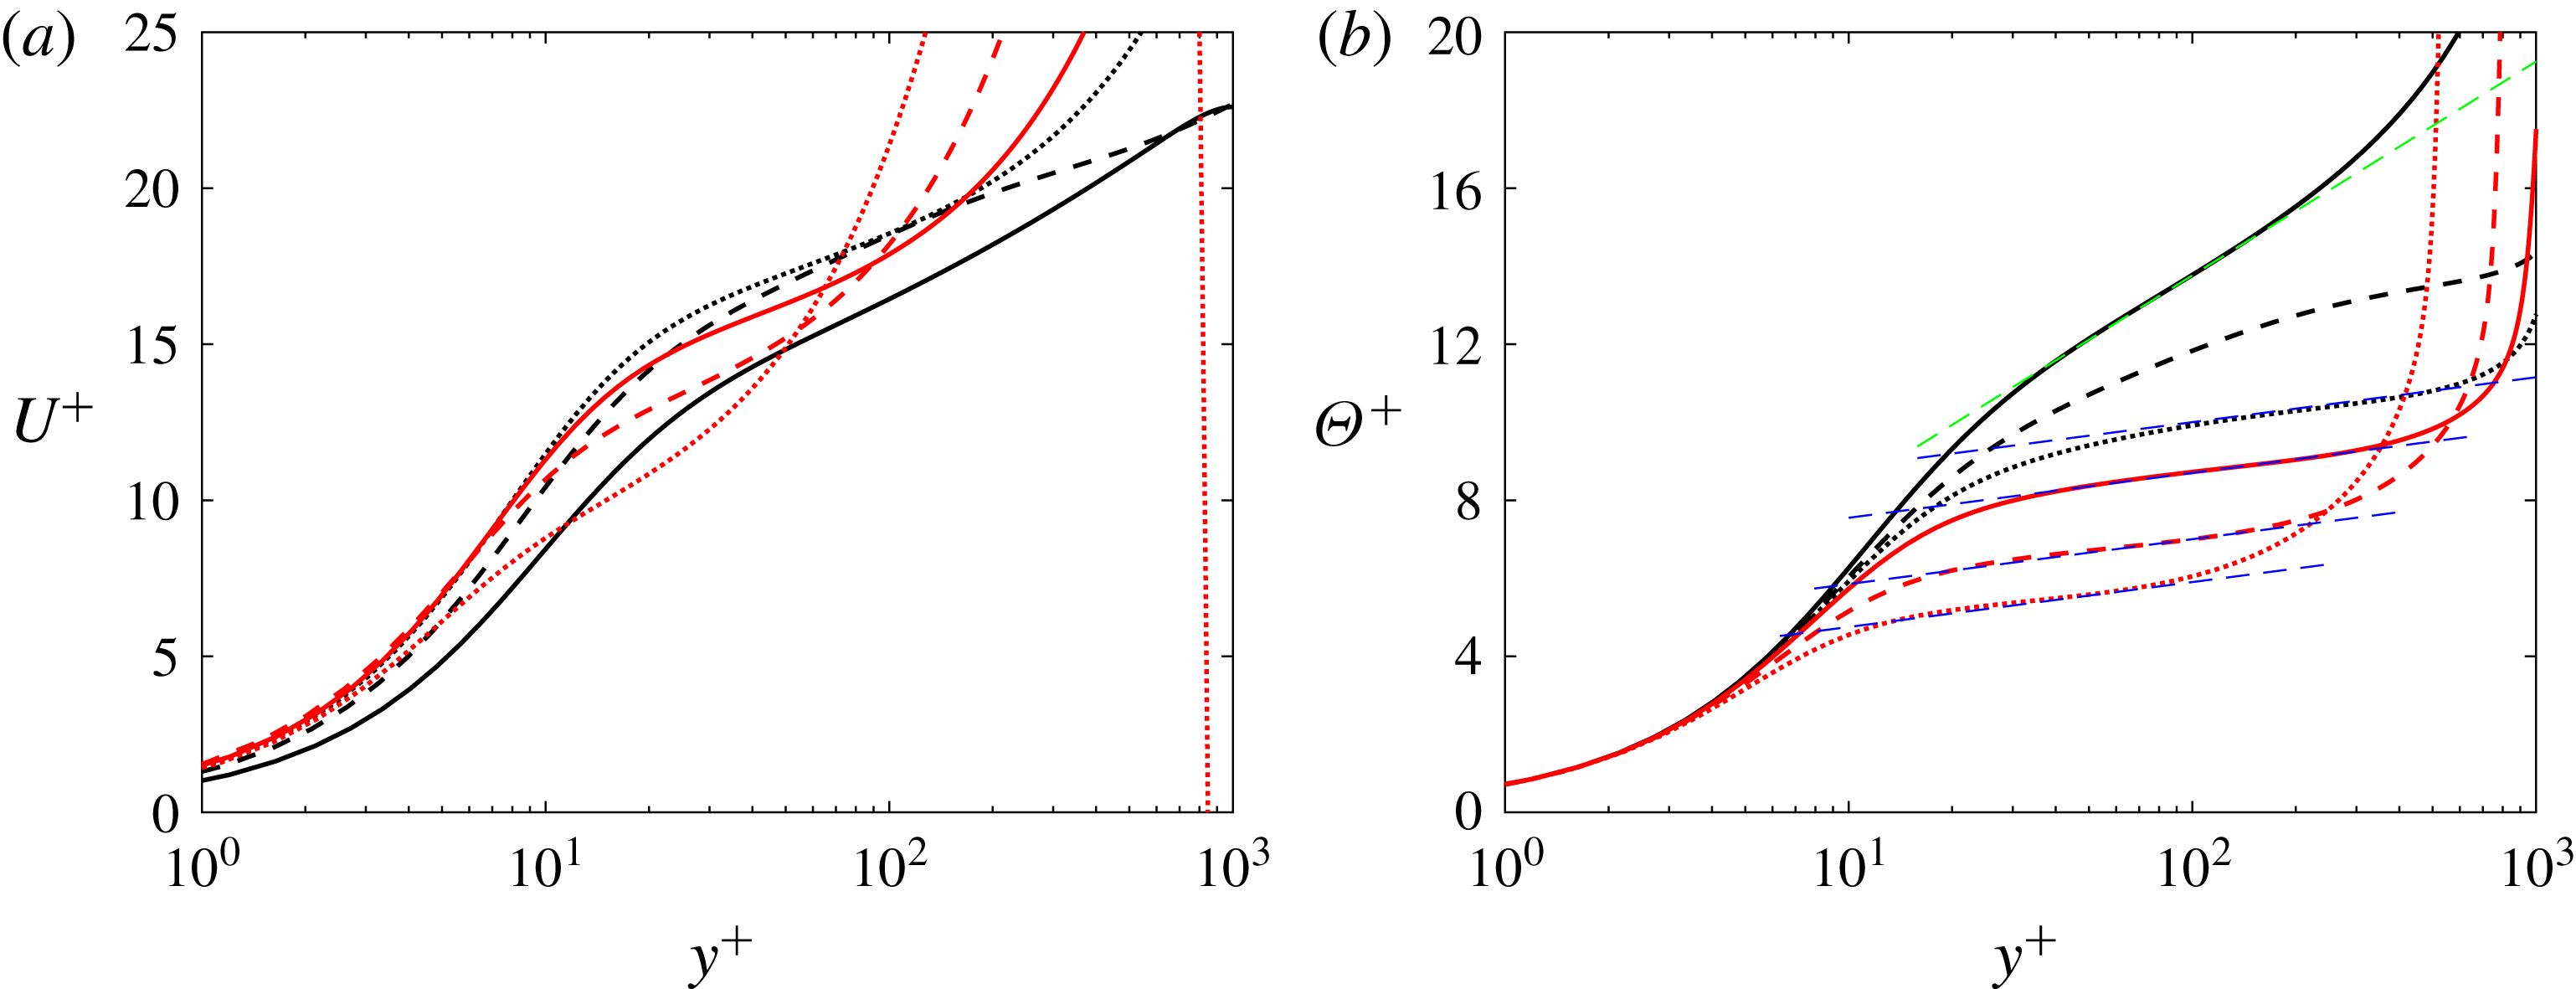
given by the straight green dashed line (figure 8
b). The value of
 $\unicode[STIX]{x1D705}_{\unicode[STIX]{x1D703}}$
found here is similar to the values 0.43 and 0.46 found by Kawamura et al. (Reference Kawamura, Abe and Matsuo1999) and Pirozzoli et al. (Reference Pirozzoli, Bernardini and Orlandi2016), respectively. When
 $Ro\geqslant 0.45$
the
 $\unicode[STIX]{x1D6E9}^{+}$
profiles on the unstable side away from the wall also approximately follow the logarithmic profile (3.2) with
 $\unicode[STIX]{x1D705}_{\unicode[STIX]{x1D703}}=2.0$
and decreasing values of
 $C_{\unicode[STIX]{x1D703}}$
with
 $Ro$
, given by the straight blue dashed lines in figure 8(b), despite the absence of a similar log-law behaviour in the
 $U^{+}$
profile. This log-law region overlaps with the region where the mean velocity profile is approximately linear and
 $\text{d}U/\text{d}y\approx 2\unicode[STIX]{x1D6FA}$
. Whether this log-law behaviour in rotating channel flows is a coincidence is not yet clear since it has no obvious explanation.
Profiles of (a)
 $U^{+}$
and (b)
 $\unicode[STIX]{x1D6E9}^{+}$
on the unstable channel side as a function of
 $y^{+}$
. The straight green and blue dashed lines in (b) are explained in the text. Other lines as in figure 3.

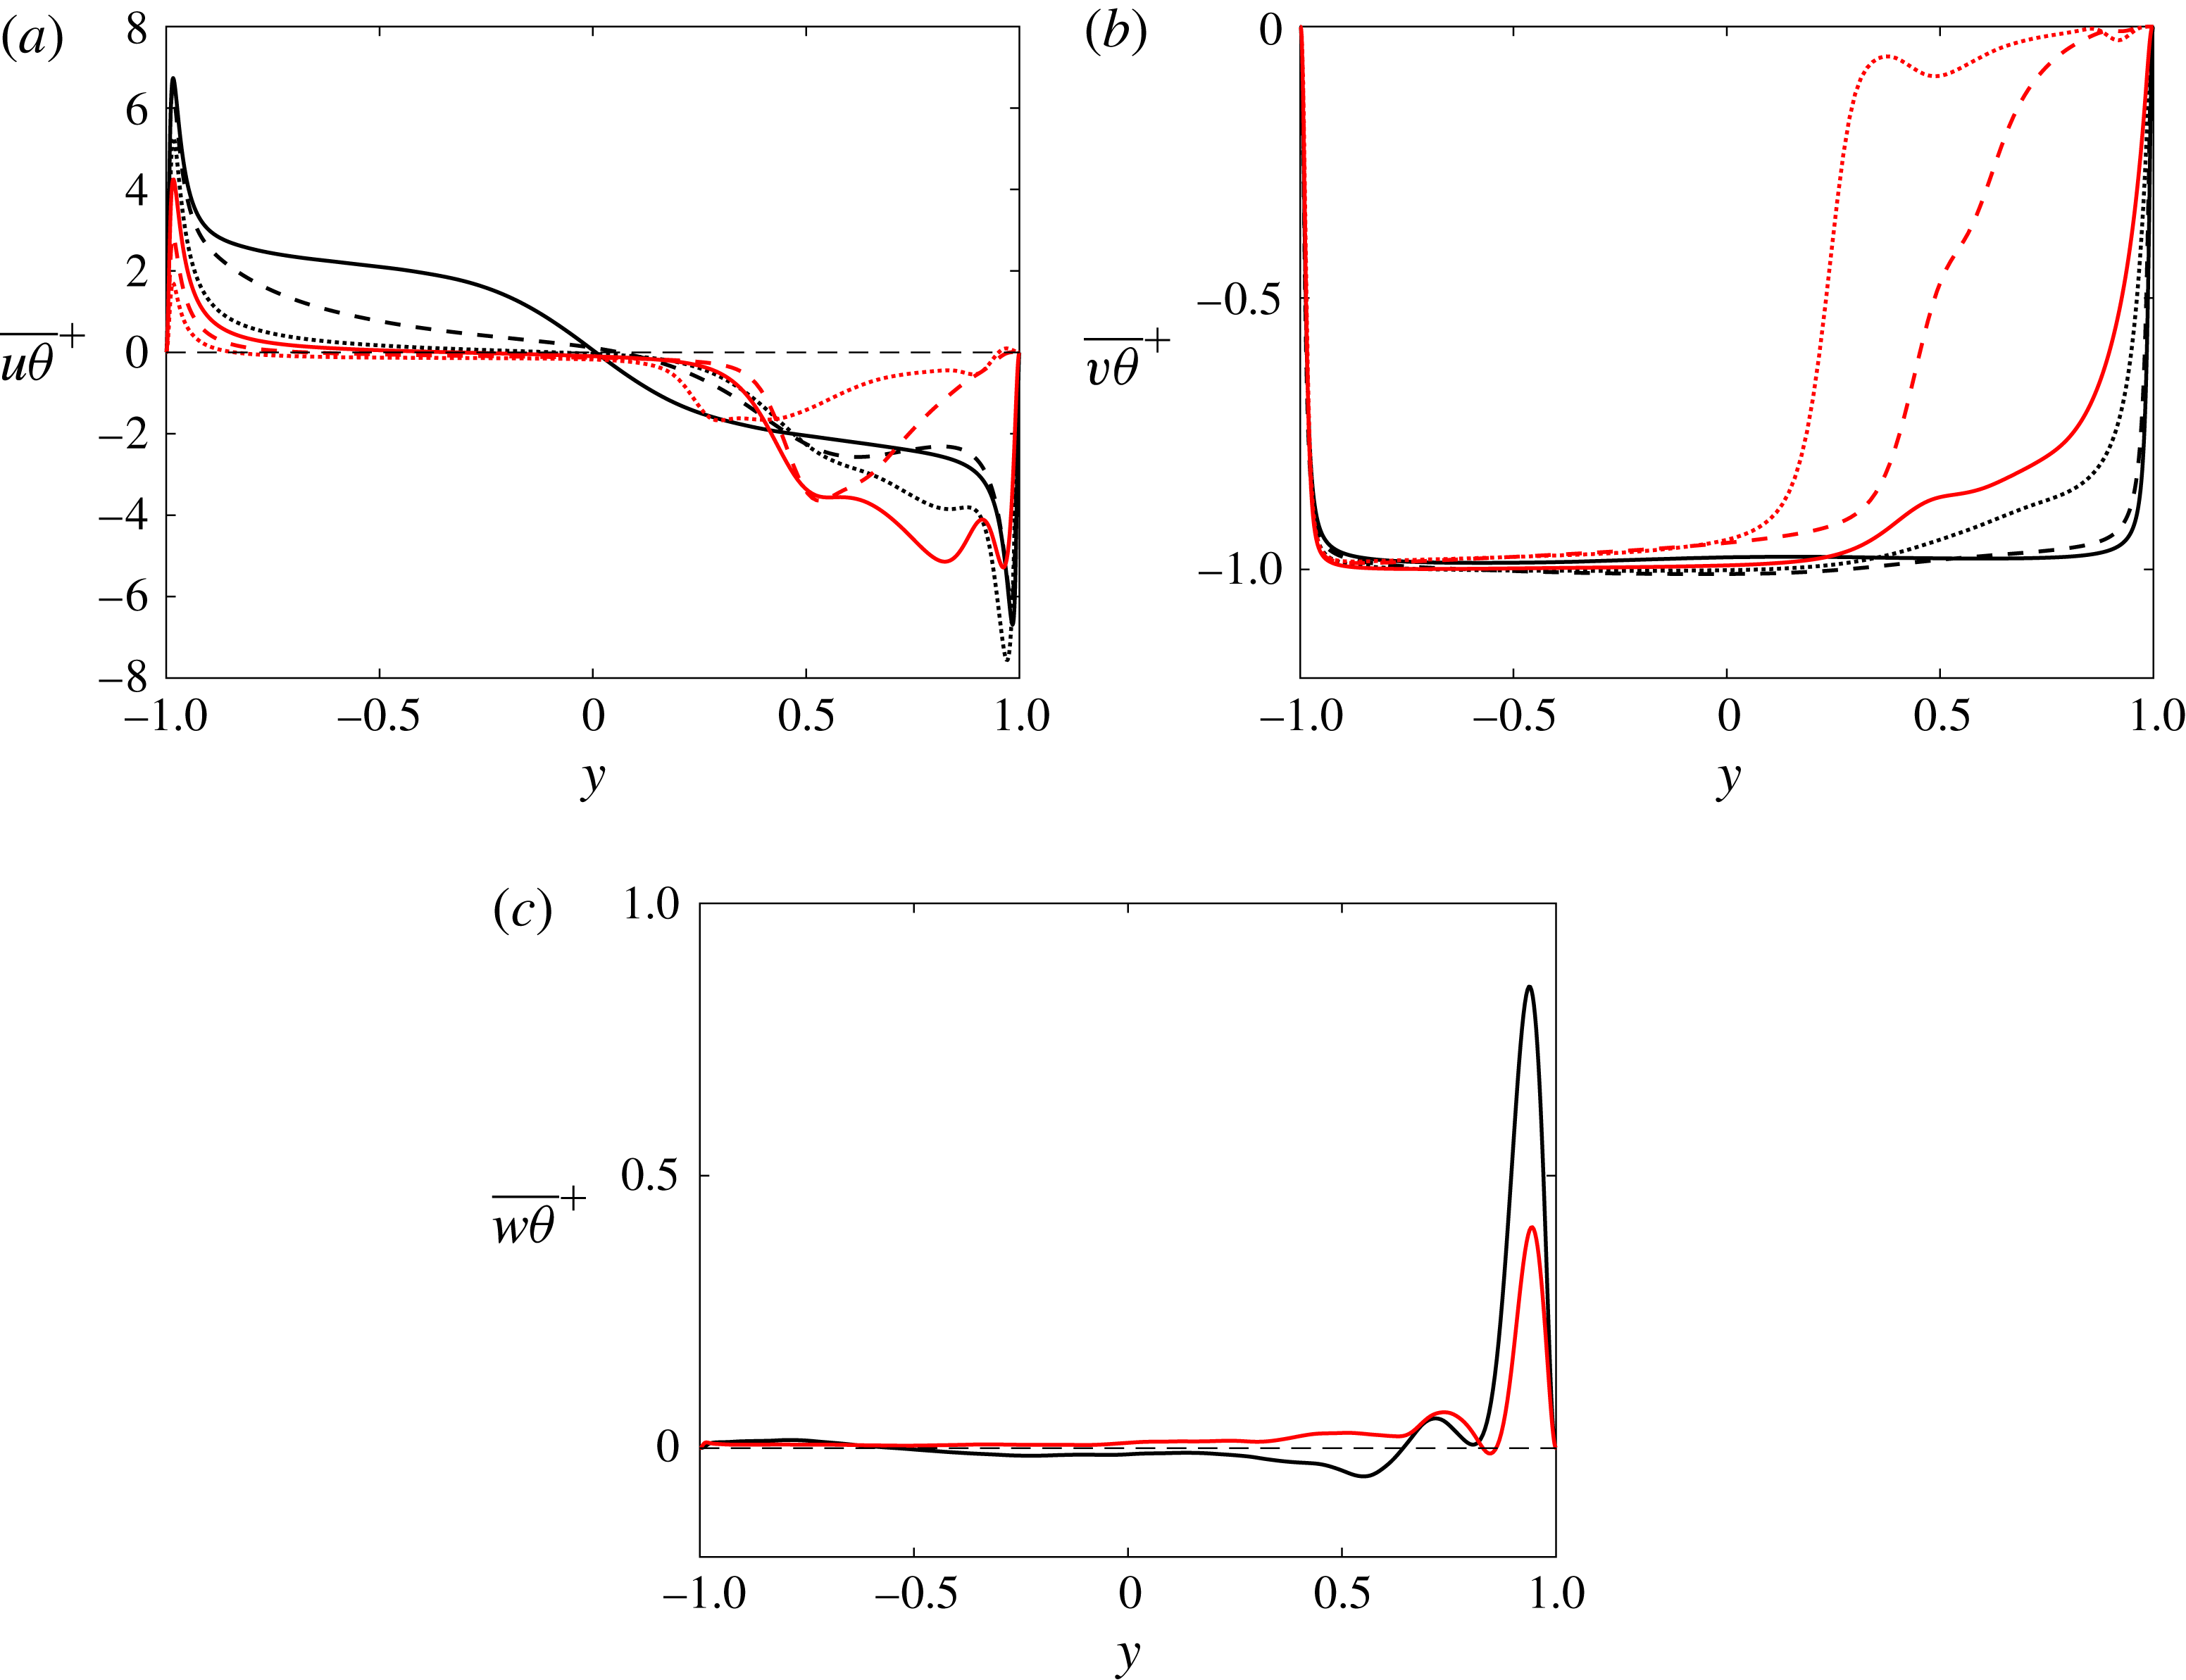
Profiles of (a)
 $\overline{u\unicode[STIX]{x1D703}}^{+}$
and (b)
 $\overline{v\unicode[STIX]{x1D703}}^{+}$
. Lines as in figure 3. (c) Profile of
 $\overline{w\unicode[STIX]{x1D703}}^{+}$
at
 $Ro=0.45$
(solid black) and
 $Ro=0.65$
(solid red).

Figure 9(a,b) shows profiles of the streamwise and wall-normal turbulent scalar fluxes
 $\overline{u\unicode[STIX]{x1D703}}^{+}$
and
 $\overline{v\unicode[STIX]{x1D703}}^{+}$
respectively in wall units. At
 $Ro=0$
,
 $\overline{u\unicode[STIX]{x1D703}}^{+}$
has, except near the centre, a larger magnitude than
 $\overline{v\unicode[STIX]{x1D703}}^{+}$
(Johansson & Wikström Reference Johansson and Wikström1999), meaning that the turbulent scalar flux is mainly aligned with the flow direction, and the same applies to the turbulent scalar flux on the stable side for
 $Ro>0$
. When
 $Ro$
rises,
 $\overline{u\unicode[STIX]{x1D703}}^{+}$
including its near-wall peak monotonically declines on the unstable side while
 $-\overline{v\unicode[STIX]{x1D703}}^{+}$
stays near unity, implying that the turbulent scalar flux turns towards the wall-normal direction and aligns with this direction in the region where
 $\text{d}U/\text{d}y\approx 2\unicode[STIX]{x1D6FA}$
. On the stable side,
 $-\overline{v\unicode[STIX]{x1D703}}^{+}$
declines with
 $Ro$
and is very small for
 $Ro\geqslant 0.9$
when the flow relaminarizes there, whereas
 $\overline{u\unicode[STIX]{x1D703}}^{+}$
stays large for
 $Ro\leqslant 0.65$
but declines at higher
 $Ro$
and its near-wall peak disappears. Scalar transport on the stable side is thus mainly diffusive at high
 $Ro$
. These results are consistent with previous DNS of scalar transport in rotating channel flow at lower
 $Re$
and with a smaller range of
 $Ro$
(Nagano & Hattori Reference Nagano and Hattori2003; Liu & Lu Reference Liu and Lu2007). By considering large-scale and small-scale contributions, Liu & Lu (Reference Liu and Lu2007) found that roll cells contribute significantly to scalar fluctuations and transport at moderate
 $Ro$
. Also in DNS and rapid distortion theory of homogeneous turbulent shear flow with spanwise rotation, the turbulent scalar flux is mostly aligned with the streamwise direction when rotation is cyclonic as on the stable channel side, whereas it aligns with the mean scalar gradient when rotation is anticyclonic and the mean shear
 $\text{d}U/\text{d}y=2\unicode[STIX]{x1D6FA}$
, where
 $\unicode[STIX]{x1D6FA}$
is the rotation rate (Brethouwer Reference Brethouwer2005; Kassinos et al.
Reference Kassinos, Knaepen and Carati2007).
When
 $Ro=0$
the mean spanwise turbulent scalar flux
 $\overline{w\unicode[STIX]{x1D703}}^{+}$
is naturally zero, but figure 9(c) shows that when
 $Ro=0.45$
or 0.65 and oblique turbulent patterns are present (figure 5
c,d)
 $\overline{w\unicode[STIX]{x1D703}}^{+}$
is significant near the wall on the stable side. In these cases,
 $\overline{uw}$
is also non-zero. The oblique patterns thus induce a noticeable spanwise turbulent momentum and scalar transport near the wall. This spanwise transport would possibly lessen or disappear when the computational domain is substantially enlarged since patterns with opposed angles to the flow direction can then coexist (Duguet et al.
Reference Duguet, Schlatter and Henningson2010).
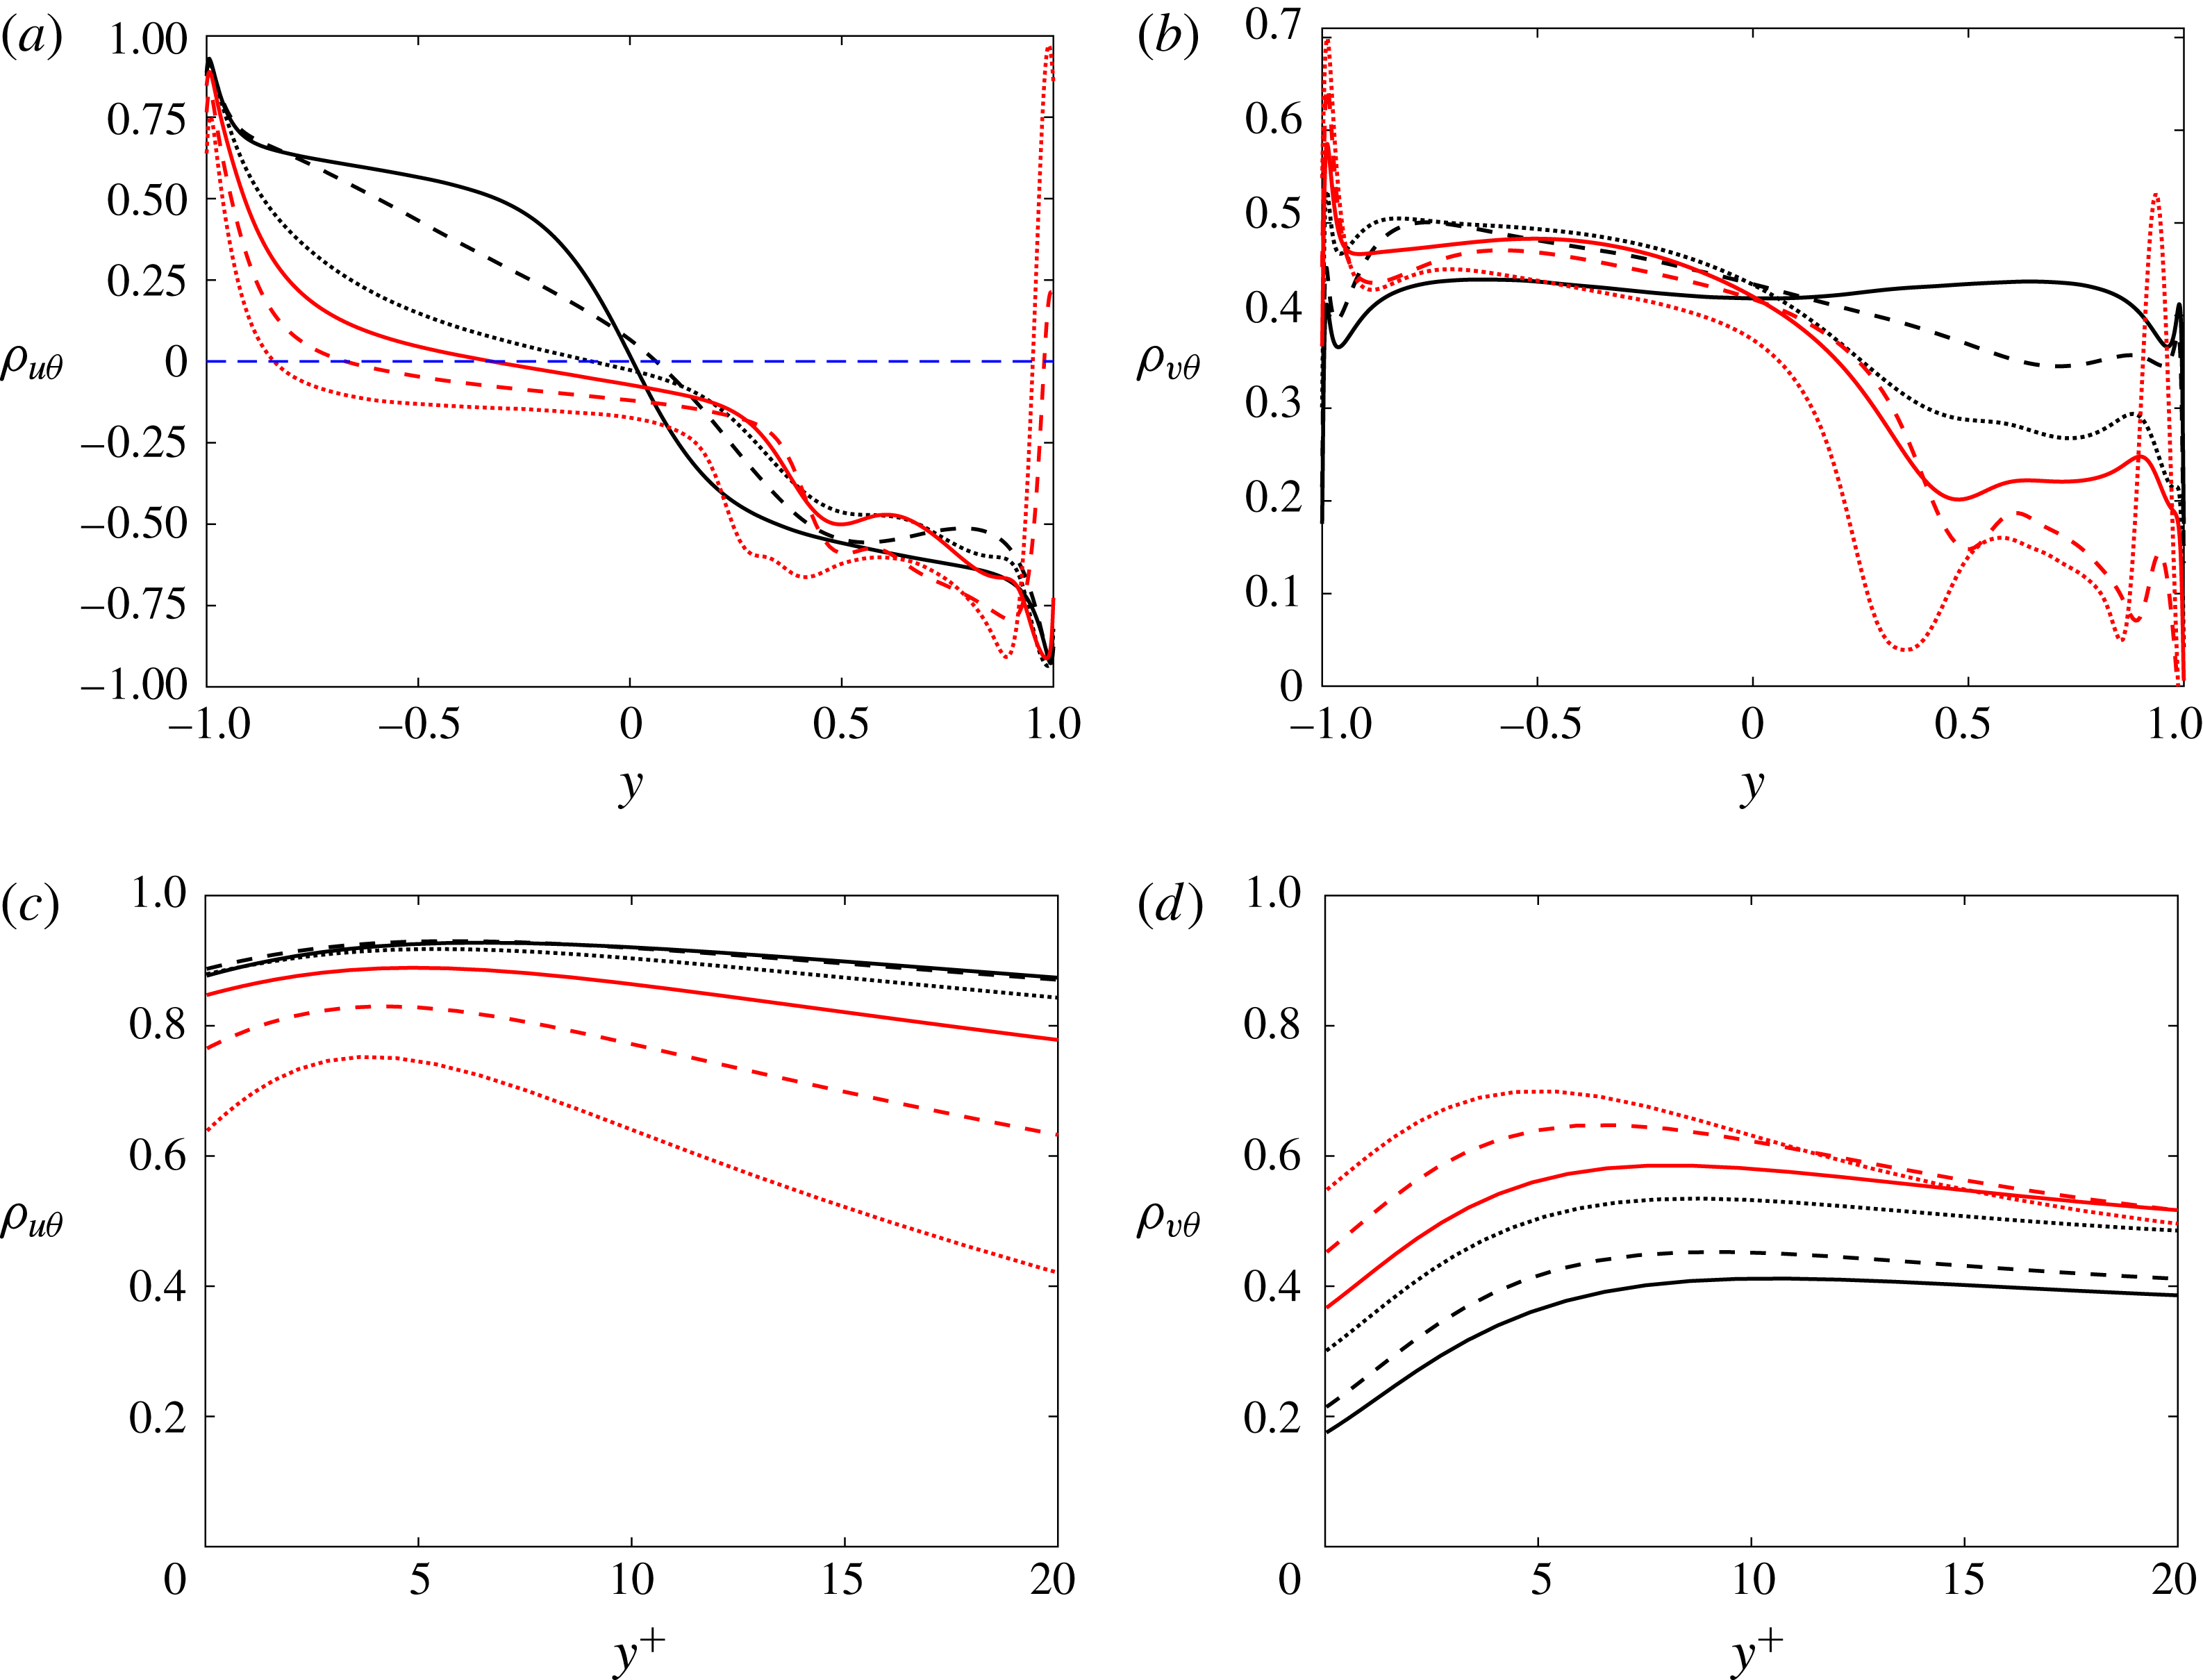
Profiles of (a,c)
 $\unicode[STIX]{x1D70C}_{u\unicode[STIX]{x1D703}}$
and (b,d)
 $\unicode[STIX]{x1D70C}_{v\unicode[STIX]{x1D703}}$
. Panels (c) and (d) show a close-up near the wall on the unstable side. Lines as in figure 3.

Figure 10 shows the correlation coefficients
 $\unicode[STIX]{x1D70C}_{u\unicode[STIX]{x1D703}}=\overline{u\unicode[STIX]{x1D703}}/(u^{\prime }\unicode[STIX]{x1D703}^{\prime })$
and
 $\unicode[STIX]{x1D70C}_{v\unicode[STIX]{x1D703}}=-\overline{v\unicode[STIX]{x1D703}}/(v^{\prime }\unicode[STIX]{x1D703}^{\prime })$
, where a prime denotes root-mean-square values. As in the DNS by Abe & Antonia (Reference Abe and Antonia2009) and Pirozzoli et al. (Reference Pirozzoli, Bernardini and Orlandi2016),
 $\unicode[STIX]{x1D70C}_{u\unicode[STIX]{x1D703}}$
approaches unity near the wall at
 $Ro=0$
owing to a high similarity between the streamwise velocity and scalar field, whereas it declines near the wall on the unstable side for
 $Ro\geqslant 0.65$
although it remains quite large (figure 10
c). When
 $Ro>0$
the magnitude of
 $\unicode[STIX]{x1D70C}_{u\unicode[STIX]{x1D703}}$
remains large on the stable side, but on the unstable side it declines rapidly in the outer layer with
 $Ro$
and becomes negative at high
 $Ro$
(figure 10
a). Thus, rotation reduces the similarity between the
 $u$
- and
 $\unicode[STIX]{x1D703}$
-fields on the unstable side, especially in the outer layer. Yang et al. (Reference Yang, Cui, Xu and Zhang2011) came to a similar conclusion for DNS of rotating channel flow at much lower
 $Re$
. The high near-wall correlation at
 $Ro=0$
is motivated by the similarity between the governing equations for
 $u$
and
 $\unicode[STIX]{x1D703}$
, with the main difference being the pressure gradient term (Abe & Antonia Reference Abe and Antonia2009). However, if
 $Ro>0$
an additional Coriolis term appears in the former, which diminishes this similarity and, accordingly, the correlation between
 $u$
and
 $\unicode[STIX]{x1D703}$
.
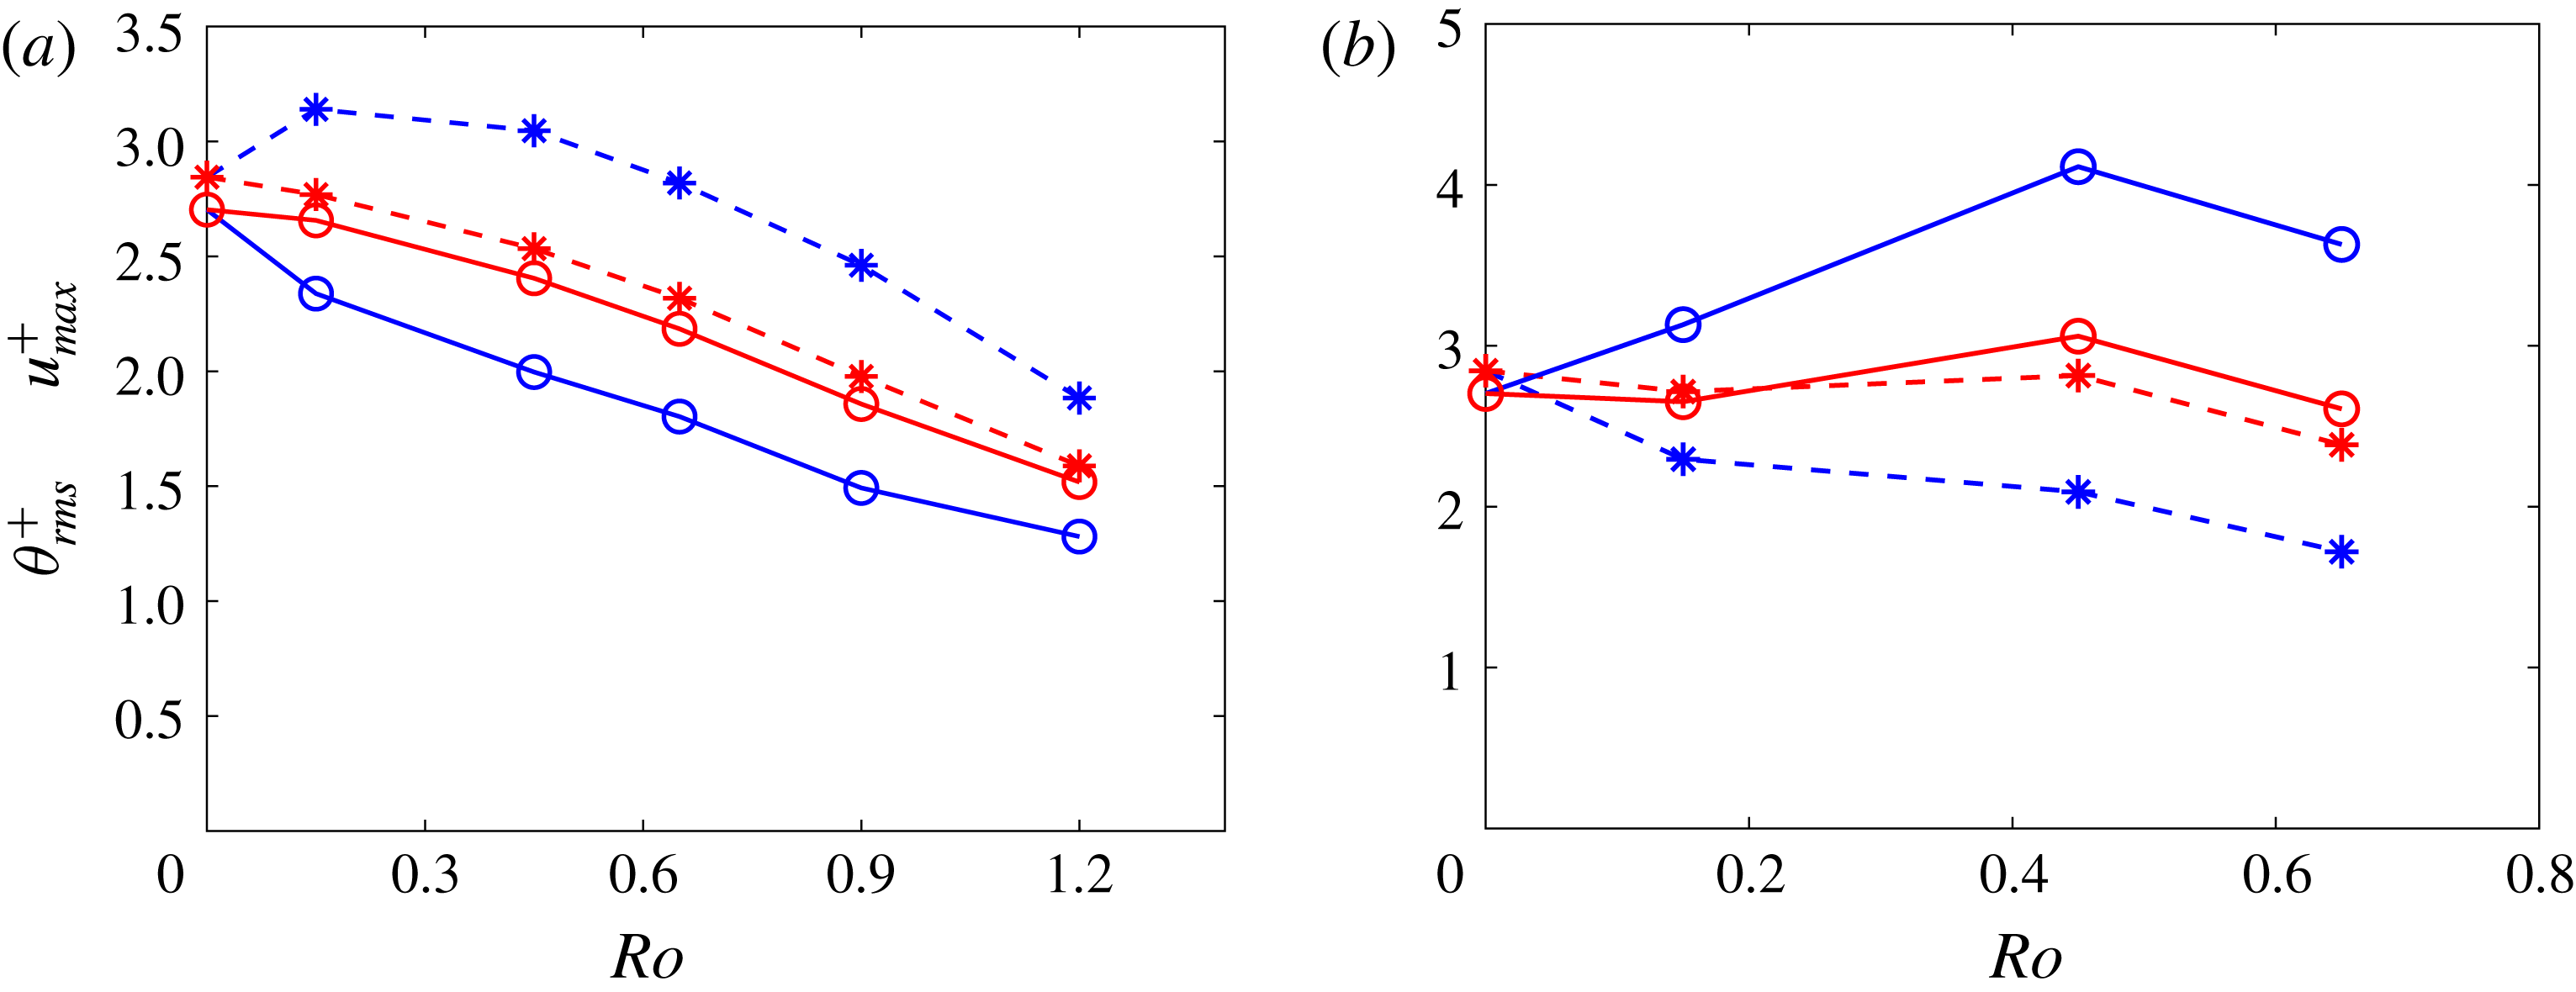
The maximum near-wall value of
 $u^{+}$
(*– – –*) and
 $\unicode[STIX]{x1D703}^{+}$
(
 $\circ$
——
 $\circ$
) on the (a) unstable and (b) stable channel side as functions of
 $Ro$
. Blue lines and symbols: using wall units based on
 $u_{\unicode[STIX]{x1D70F}}$
. Red lines and symbols: using wall units based on (a)
 $u_{\unicode[STIX]{x1D70F}u}$
or (b)
 $u_{\unicode[STIX]{x1D70F}s}$
.

By contrast,
 $\unicode[STIX]{x1D70C}_{v\unicode[STIX]{x1D703}}$
is quite insensitive to
 $Ro$
on the unstable side away from the wall with values between 0.4 and 0.5 whereas it declines with
 $Ro$
on the stable side (figure 10
b). On the other hand, near the wall on the unstable side,
 $\unicode[STIX]{x1D70C}_{v\unicode[STIX]{x1D703}}$
grows considerably with
 $Ro$
and becomes quite large (figure 10
d). The behaviour and magnitude of
 $\unicode[STIX]{x1D70C}_{v\unicode[STIX]{x1D703}}$
with
 $Ro$
here closely follows the correlation coefficient for the Reynolds shear stress
 $\overline{uv}/(u^{\prime }v^{\prime })$
(not shown), which also becomes large near the wall at higher
 $Ro$
. These high correlations might be related to the formation of elongated streamwise near-wall vortices in rotating channel flow on the unstable side (Yang & Wu Reference Yang and Wu2012).
From these results it can be concluded that the alignment of the scalar flux with the mean scalar gradient with
 $Ro$
on the unstable side is related to a reduced
 $u$
–
 $\unicode[STIX]{x1D703}$
correlation whereas the reduced turbulent scalar flux on the stable side is caused by both declining
 $v$
–
 $\unicode[STIX]{x1D703}$
correlations and Reynolds stresses.
Figure 11 shows the peak values of
 $u^{+}$
and
 $\unicode[STIX]{x1D703}^{+}$
as functions of
 $Ro$
near both walls. The velocity and scalar fluctuations are scaled by
 $u_{\unicode[STIX]{x1D70F}}$
and
 $\unicode[STIX]{x1D703}_{\unicode[STIX]{x1D70F}}=Q_{w}/u_{\unicode[STIX]{x1D70F}}$
, respectively. Also the velocity and scalar fluctuations scaled by
 $u_{\unicode[STIX]{x1D70F}u}$
and
 $\unicode[STIX]{x1D703}_{\unicode[STIX]{x1D70F}u}=Q_{w}/u_{\unicode[STIX]{x1D70F}u}$
(figure 11
a) and by
 $u_{\unicode[STIX]{x1D70F}s}$
and
 $\unicode[STIX]{x1D703}_{\unicode[STIX]{x1D70F}s}=Q_{w}/u_{\unicode[STIX]{x1D70F}s}$
(figure 11
b) are shown. The high similarity between
 $u$
and
 $\unicode[STIX]{x1D703}$
in the near-wall region in non-rotating channel flow (Abe & Antonia Reference Abe and Antonia2009) is reflected by the closeness of the peak values of
 $u^{+}$
and
 $\unicode[STIX]{x1D703}^{+}$
, although the peak value of
 $u^{+}$
is slightly higher than that of
 $\unicode[STIX]{x1D703}^{+}$
caused by a smaller than unity
 $Pr$
(Pirozzoli et al.
Reference Pirozzoli, Bernardini and Orlandi2016). For
 $Ro>0$
the difference between the peak values of
 $u^{+}$
and
 $\unicode[STIX]{x1D703}^{+}$
is considerable if the scaling is based on
 $u_{\unicode[STIX]{x1D70F}}$
and
 $\unicode[STIX]{x1D703}_{\unicode[STIX]{x1D70F}}$
, but if the scaling of the peak values on the unstable and stable side is based on
 $u_{\unicode[STIX]{x1D70F}u}$
,
 $\unicode[STIX]{x1D703}_{\unicode[STIX]{x1D70F}u}$
and
 $u_{\unicode[STIX]{x1D70F}s}$
,
 $\unicode[STIX]{x1D703}_{\unicode[STIX]{x1D70F}s}$
, respectively, the differences are much smaller. In the latter case, the peak values of
 $u^{+}$
and
 $\unicode[STIX]{x1D703}^{+}$
on the unstable side show a similar decline with
 $Ro$
. The trend on the stable side is non-monotonic, which may be related to the appearance of turbulent–laminar patterns at
 $Ro=0.45$
and 0.65. Rotation reduces the similarity between the
 $u$
- and
 $\unicode[STIX]{x1D703}$
-fields on the unstable side, but their near-wall peak values thus display a similar scaling in terms of wall units.
3.4 Budget equations
In this section, the budgets of the governing equations of the scalar energy
 $K_{\unicode[STIX]{x1D703}}=\overline{\unicode[STIX]{x1D703}\unicode[STIX]{x1D703}}/2$
, and
 $\overline{u\unicode[STIX]{x1D703}}$
and
 $\overline{v\unicode[STIX]{x1D703}}$
are considered to obtain insights into the generation of scalar fluctuations and fluxes. Budgets for scalar transport in a non-rotating channel have been studied, for example, by Johansson & Wikström (Reference Johansson and Wikström1999) and in a spanwise-rotating channel flow by Nagano & Hattori (Reference Nagano and Hattori2003) and Liu & Lu (Reference Liu and Lu2007), albeit at low Reynolds numbers.
In the steady-state case, the governing equation of the scalar energy
 $K_{\unicode[STIX]{x1D703}}$
reads
 $$\begin{eqnarray}0=\underbrace{-\overline{v\unicode[STIX]{x1D703}}\frac{\unicode[STIX]{x2202}\unicode[STIX]{x1D6E9}}{\unicode[STIX]{x2202}y}}_{P_{\unicode[STIX]{x1D703}}}\underbrace{-\frac{1}{2}\frac{\unicode[STIX]{x2202}\overline{v\unicode[STIX]{x1D703}^{2}}}{\unicode[STIX]{x2202}y}}_{D_{\unicode[STIX]{x1D703}}^{t}}+\underbrace{\unicode[STIX]{x1D6FC}\frac{\unicode[STIX]{x2202}^{2}K_{\unicode[STIX]{x1D703}}}{\unicode[STIX]{x2202}y^{2}}}_{D_{\unicode[STIX]{x1D703}}^{m}}\underbrace{-\unicode[STIX]{x1D6FC}\overline{\frac{\unicode[STIX]{x2202}\unicode[STIX]{x1D703}}{\unicode[STIX]{x2202}x_{k}}\frac{\unicode[STIX]{x2202}\unicode[STIX]{x1D703}}{\unicode[STIX]{x2202}x_{k}}}}_{\unicode[STIX]{x1D700}_{\unicode[STIX]{x1D703}}},\end{eqnarray}$$
where
 $P_{\unicode[STIX]{x1D703}}$
represents production,
 $D_{\unicode[STIX]{x1D703}}^{t}$
and
 $D_{\unicode[STIX]{x1D703}}^{m}$
turbulent and molecular diffusion, respectively, and
 $\unicode[STIX]{x1D700}_{\unicode[STIX]{x1D703}}$
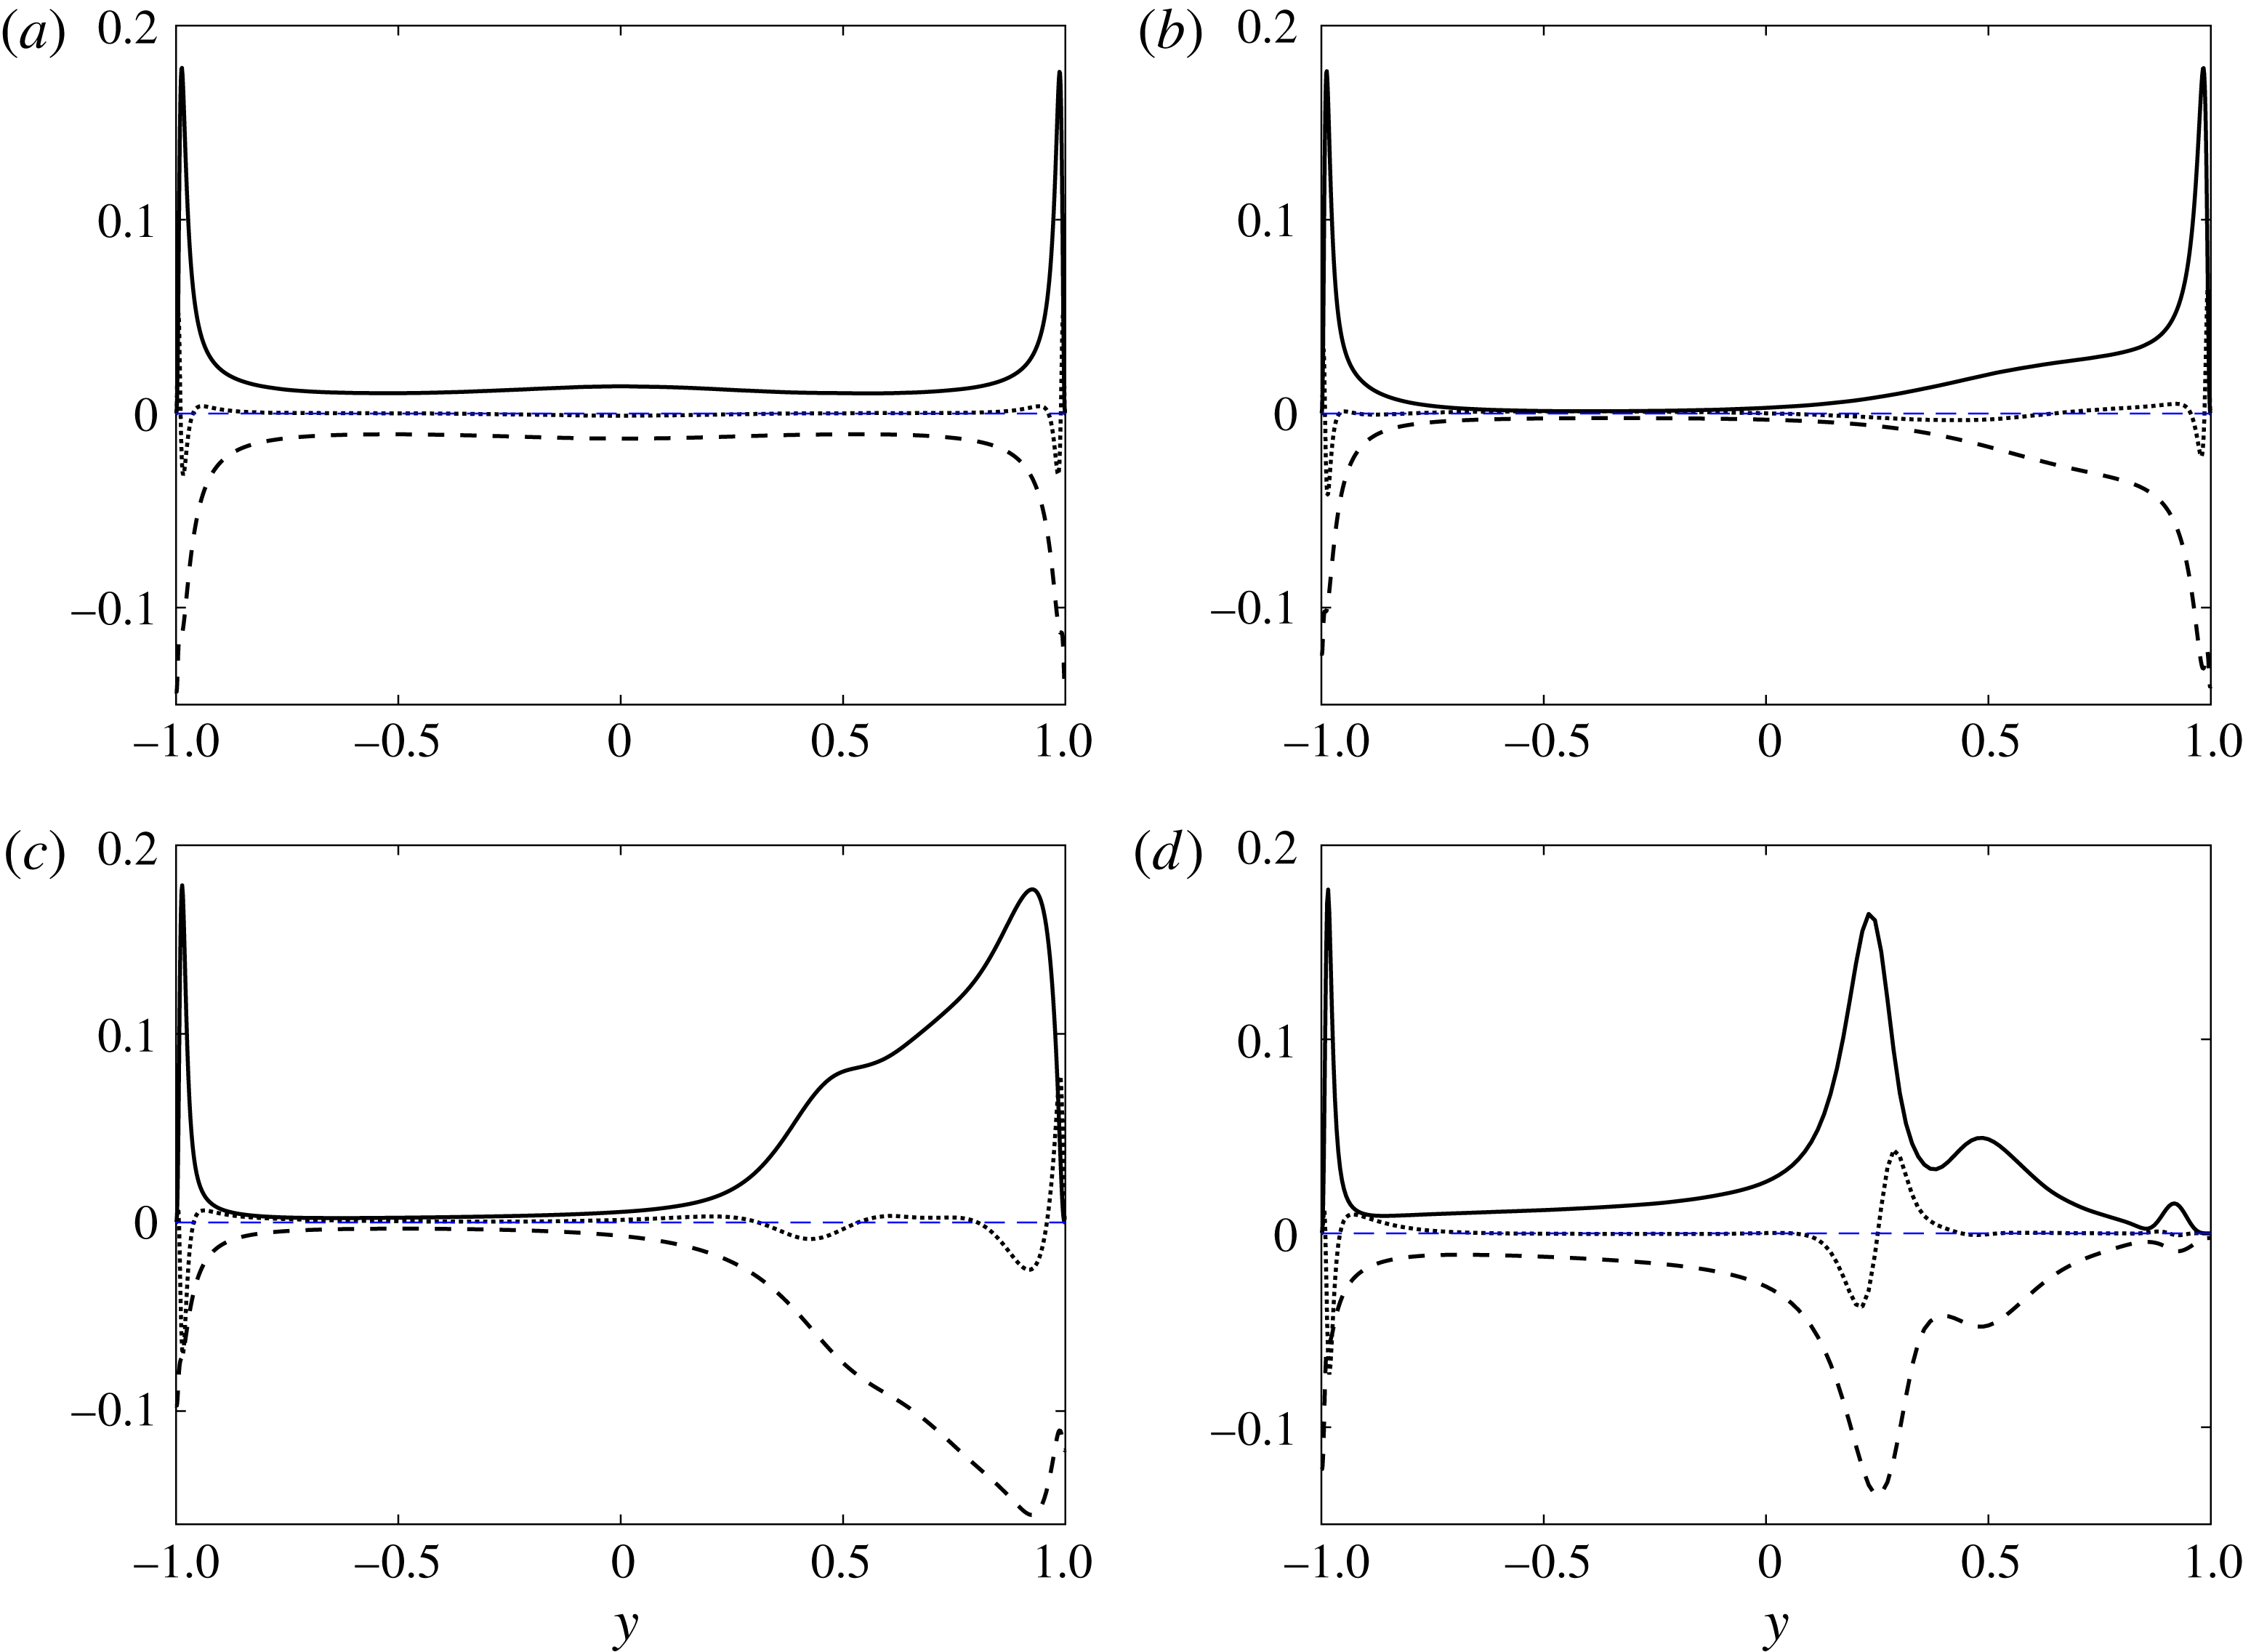
dissipation. Figure 12 shows the budgets
 $P_{\unicode[STIX]{x1D703}}^{+}$
,
 $D_{\unicode[STIX]{x1D703}}^{t+}$
and
 $\unicode[STIX]{x1D700}_{\unicode[STIX]{x1D703}}^{+}$
in wall units at
 $Ro=0$
, 0.15, 0.65 and 1.2. Molecular diffusion
 $D_{\unicode[STIX]{x1D703}}^{m+}$
is not shown since it is small. Turbulent diffusion
 $D_{\unicode[STIX]{x1D703}}^{t+}$
appears significant only near the wall and at
 $Ro=1.2$
around
 $y=0.25$
where
 $K_{\unicode[STIX]{x1D703}}$
and
 $P_{\unicode[STIX]{x1D703}}$
are large, but otherwise it is small, suggesting a balance between
 $P_{\unicode[STIX]{x1D703}}$
and
 $\unicode[STIX]{x1D700}_{\unicode[STIX]{x1D703}}$
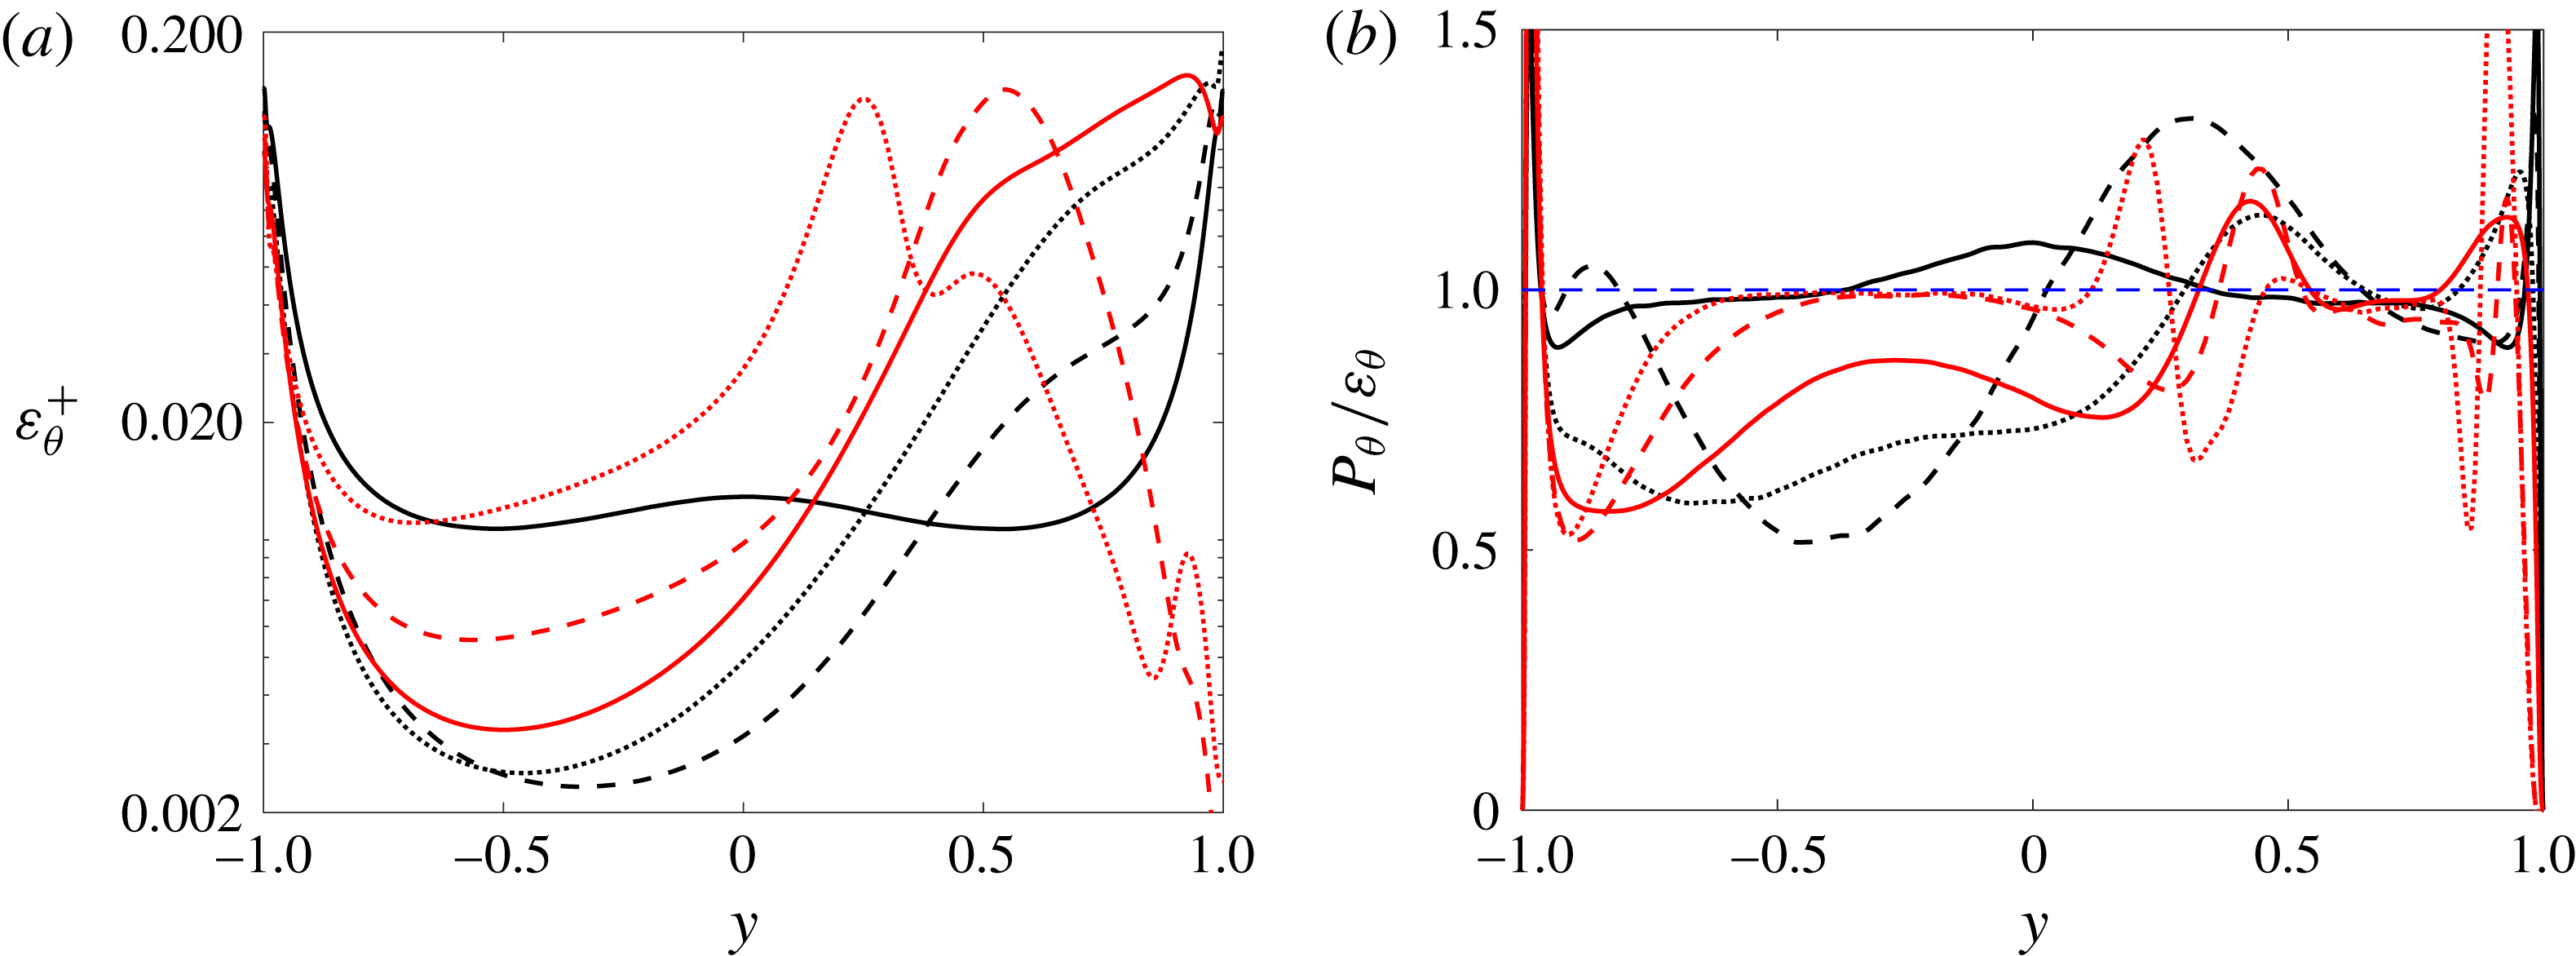
. At
 $Ro=0$
and
 $Ro\geqslant 0.9$
the ratio
 $P_{\unicode[STIX]{x1D703}}/\unicode[STIX]{x1D700}_{\unicode[STIX]{x1D703}}$
is indeed mostly near unity in the outer region (figure 13
b), but this ratio deviates from unity (figure 13
b) in the outer region of the unstable side when
 $0.15\leqslant Ro\leqslant 0.65$
and
 $\unicode[STIX]{x1D700}_{\unicode[STIX]{x1D703}}^{+}$
is small (figure 13
a), implying that
 $D_{\unicode[STIX]{x1D703}}^{t}$
is significant. This imbalance between
 $P_{\unicode[STIX]{x1D703}}$
and
 $\unicode[STIX]{x1D700}_{\unicode[STIX]{x1D703}}$
and significance of
 $D_{\unicode[STIX]{x1D703}}^{t}$
are probably caused by large-scale streamwise roll cells being present at these moderate
 $Ro$
(Brethouwer Reference Brethouwer2017). The maximum of
 $P_{\unicode[STIX]{x1D703}}^{+}$
close to the wall at
 $y=-1$
is independent of
 $Ro$
and near its theoretical value
 $Pr/4$
(Johansson & Wikström Reference Johansson and Wikström1999). At
 $Ro=0.15$
and
 $0.65$
, both
 $\unicode[STIX]{x1D700}_{\unicode[STIX]{x1D703}}^{+}$
and
 $P_{\unicode[STIX]{x1D703}}^{+}$
are large on the stable side (figure 12
b,c) where the mean scalar gradient and
 $K_{\unicode[STIX]{x1D703}}$
are large (figure 7). At higher
 $Ro$
,
 $\overline{v\unicode[STIX]{x1D703}}$
and consequently
 $P_{\unicode[STIX]{x1D703}}^{+}$
and
 $\unicode[STIX]{x1D700}_{\unicode[STIX]{x1D703}}^{+}$
diminish rapidly on the stable side and the peaks of
 $\unicode[STIX]{x1D700}_{\unicode[STIX]{x1D703}}^{+}$
and
 $P_{\unicode[STIX]{x1D703}}^{+}$
move away from the wall to the position where
 $\text{d}\unicode[STIX]{x1D6E9}/\text{d}y$
is steep and
 $\overline{v\unicode[STIX]{x1D703}}$
is still large (figure 12
d). Accordingly, the maximum of
 $\unicode[STIX]{x1D703}^{+}$
at high
 $Ro$
moves away from the wall (figure 7
b).
Budgets of the
 $K_{\unicode[STIX]{x1D703}}$
balance equation in wall units at (a)
 $Ro=0$
, (b)
 $Ro=0.15$
, (c)
 $Ro=0.65$
and (d)
 $Ro=1.2$
for:
 $P_{\unicode[STIX]{x1D703}}^{+}$
(solid),
 $\unicode[STIX]{x1D700}_{\unicode[STIX]{x1D703}}^{+}$
(dashed) and
 $D_{\unicode[STIX]{x1D703}}^{t+}$
(dotted).

Profiles of (a)
 $\unicode[STIX]{x1D700}_{\unicode[STIX]{x1D703}}^{+}$
and (b)
 $P_{\unicode[STIX]{x1D703}}/\unicode[STIX]{x1D700}_{\unicode[STIX]{x1D703}}$
. Lines as in figure 3.

The respective governing equations of
 $\overline{u\unicode[STIX]{x1D703}}$
and
 $\overline{v\unicode[STIX]{x1D703}}$
read
 $$\begin{eqnarray}\displaystyle 0 & = & \displaystyle \underbrace{-\overline{uv}\frac{\unicode[STIX]{x2202}\unicode[STIX]{x1D6E9}}{\unicode[STIX]{x2202}y}-\overline{v\unicode[STIX]{x1D703}}\frac{\unicode[STIX]{x2202}U}{\unicode[STIX]{x2202}y}}_{P_{1}}\underbrace{-\frac{\unicode[STIX]{x2202}\overline{uv\unicode[STIX]{x1D703}}}{\unicode[STIX]{x2202}y}}_{D_{1}^{t}}+\underbrace{\frac{\unicode[STIX]{x2202}}{\unicode[STIX]{x2202}y}\left(\unicode[STIX]{x1D6FC}\overline{u\frac{\unicode[STIX]{x2202}\unicode[STIX]{x1D703}}{\unicode[STIX]{x2202}y}}+\unicode[STIX]{x1D708}\overline{\unicode[STIX]{x1D703}\frac{\unicode[STIX]{x2202}u}{\unicode[STIX]{x2202}y}}\right)}_{D_{1}^{m}}\nonumber\\ \displaystyle & & \displaystyle +\underbrace{\overline{\frac{p}{\unicode[STIX]{x1D70C}}\frac{\unicode[STIX]{x2202}\unicode[STIX]{x1D703}}{\unicode[STIX]{x2202}x}}-(\unicode[STIX]{x1D6FC}+\unicode[STIX]{x1D708})\overline{\frac{\unicode[STIX]{x2202}u}{\unicode[STIX]{x2202}x_{k}}\frac{\unicode[STIX]{x2202}\unicode[STIX]{x1D703}}{\unicode[STIX]{x2202}x_{k}}}}_{\unicode[STIX]{x1D6F1}_{1}}+\underbrace{2\unicode[STIX]{x1D6FA}\overline{v\unicode[STIX]{x1D703}}}_{C_{1}},\end{eqnarray}$$
 $$\begin{eqnarray}\displaystyle 0 & = & \displaystyle \underbrace{-\overline{v^{2}}\frac{\unicode[STIX]{x2202}\unicode[STIX]{x1D6E9}}{\unicode[STIX]{x2202}y}}_{P_{2}}\underbrace{-\frac{\unicode[STIX]{x2202}\overline{v^{2}\unicode[STIX]{x1D703}}}{\unicode[STIX]{x2202}y}}_{D_{2}^{t}}\underbrace{-\frac{\unicode[STIX]{x2202}\overline{p\unicode[STIX]{x1D703}}}{\unicode[STIX]{x2202}y}}_{D_{2}^{p}}+\underbrace{\frac{\unicode[STIX]{x2202}}{\unicode[STIX]{x2202}y}\left(\unicode[STIX]{x1D6FC}\overline{v\frac{\unicode[STIX]{x2202}\unicode[STIX]{x1D703}}{\unicode[STIX]{x2202}y}}+\unicode[STIX]{x1D708}\overline{\unicode[STIX]{x1D703}\frac{\unicode[STIX]{x2202}v}{\unicode[STIX]{x2202}y}}\right)}_{D_{2}^{m}}\nonumber\\ \displaystyle & & \displaystyle +\underbrace{\overline{\frac{p}{\unicode[STIX]{x1D70C}}\frac{\unicode[STIX]{x2202}\unicode[STIX]{x1D703}}{\unicode[STIX]{x2202}y}}-(\unicode[STIX]{x1D6FC}+\unicode[STIX]{x1D708})\overline{\frac{\unicode[STIX]{x2202}v}{\unicode[STIX]{x2202}x_{k}}\frac{\unicode[STIX]{x2202}\unicode[STIX]{x1D703}}{\unicode[STIX]{x2202}x_{k}}}}_{\unicode[STIX]{x1D6F1}_{2}}\underbrace{-2\unicode[STIX]{x1D6FA}\overline{u\unicode[STIX]{x1D703}}}_{C_{2}},\end{eqnarray}$$
where
 $P_{1}$
,
 $P_{2}$
represent production,
 $D_{1}^{t}$
,
 $D_{2}^{t}$
turbulent diffusion,
 $D_{2}^{p}$
pressure diffusion, and
 $D_{1}^{m}$
,
 $D_{2}^{m}$
molecular diffusion. The sum of pressure–scalar gradient correlation and diffusive and viscous dissipation,
 $\unicode[STIX]{x1D6F1}_{1}$
and
 $\unicode[STIX]{x1D6F1}_{2}$
, is considered because diffusive and viscous dissipation are generally small and therefore often added to the pressure–scalar gradient correlation term in turbulence modelling (Wikström, Wallin & Johansson Reference Wikström, Wallin and Johansson2000). The Coriolis force leads to additional terms
 $C_{1}$
and
 $C_{2}$
in the governing equations of the scalar fluxes.
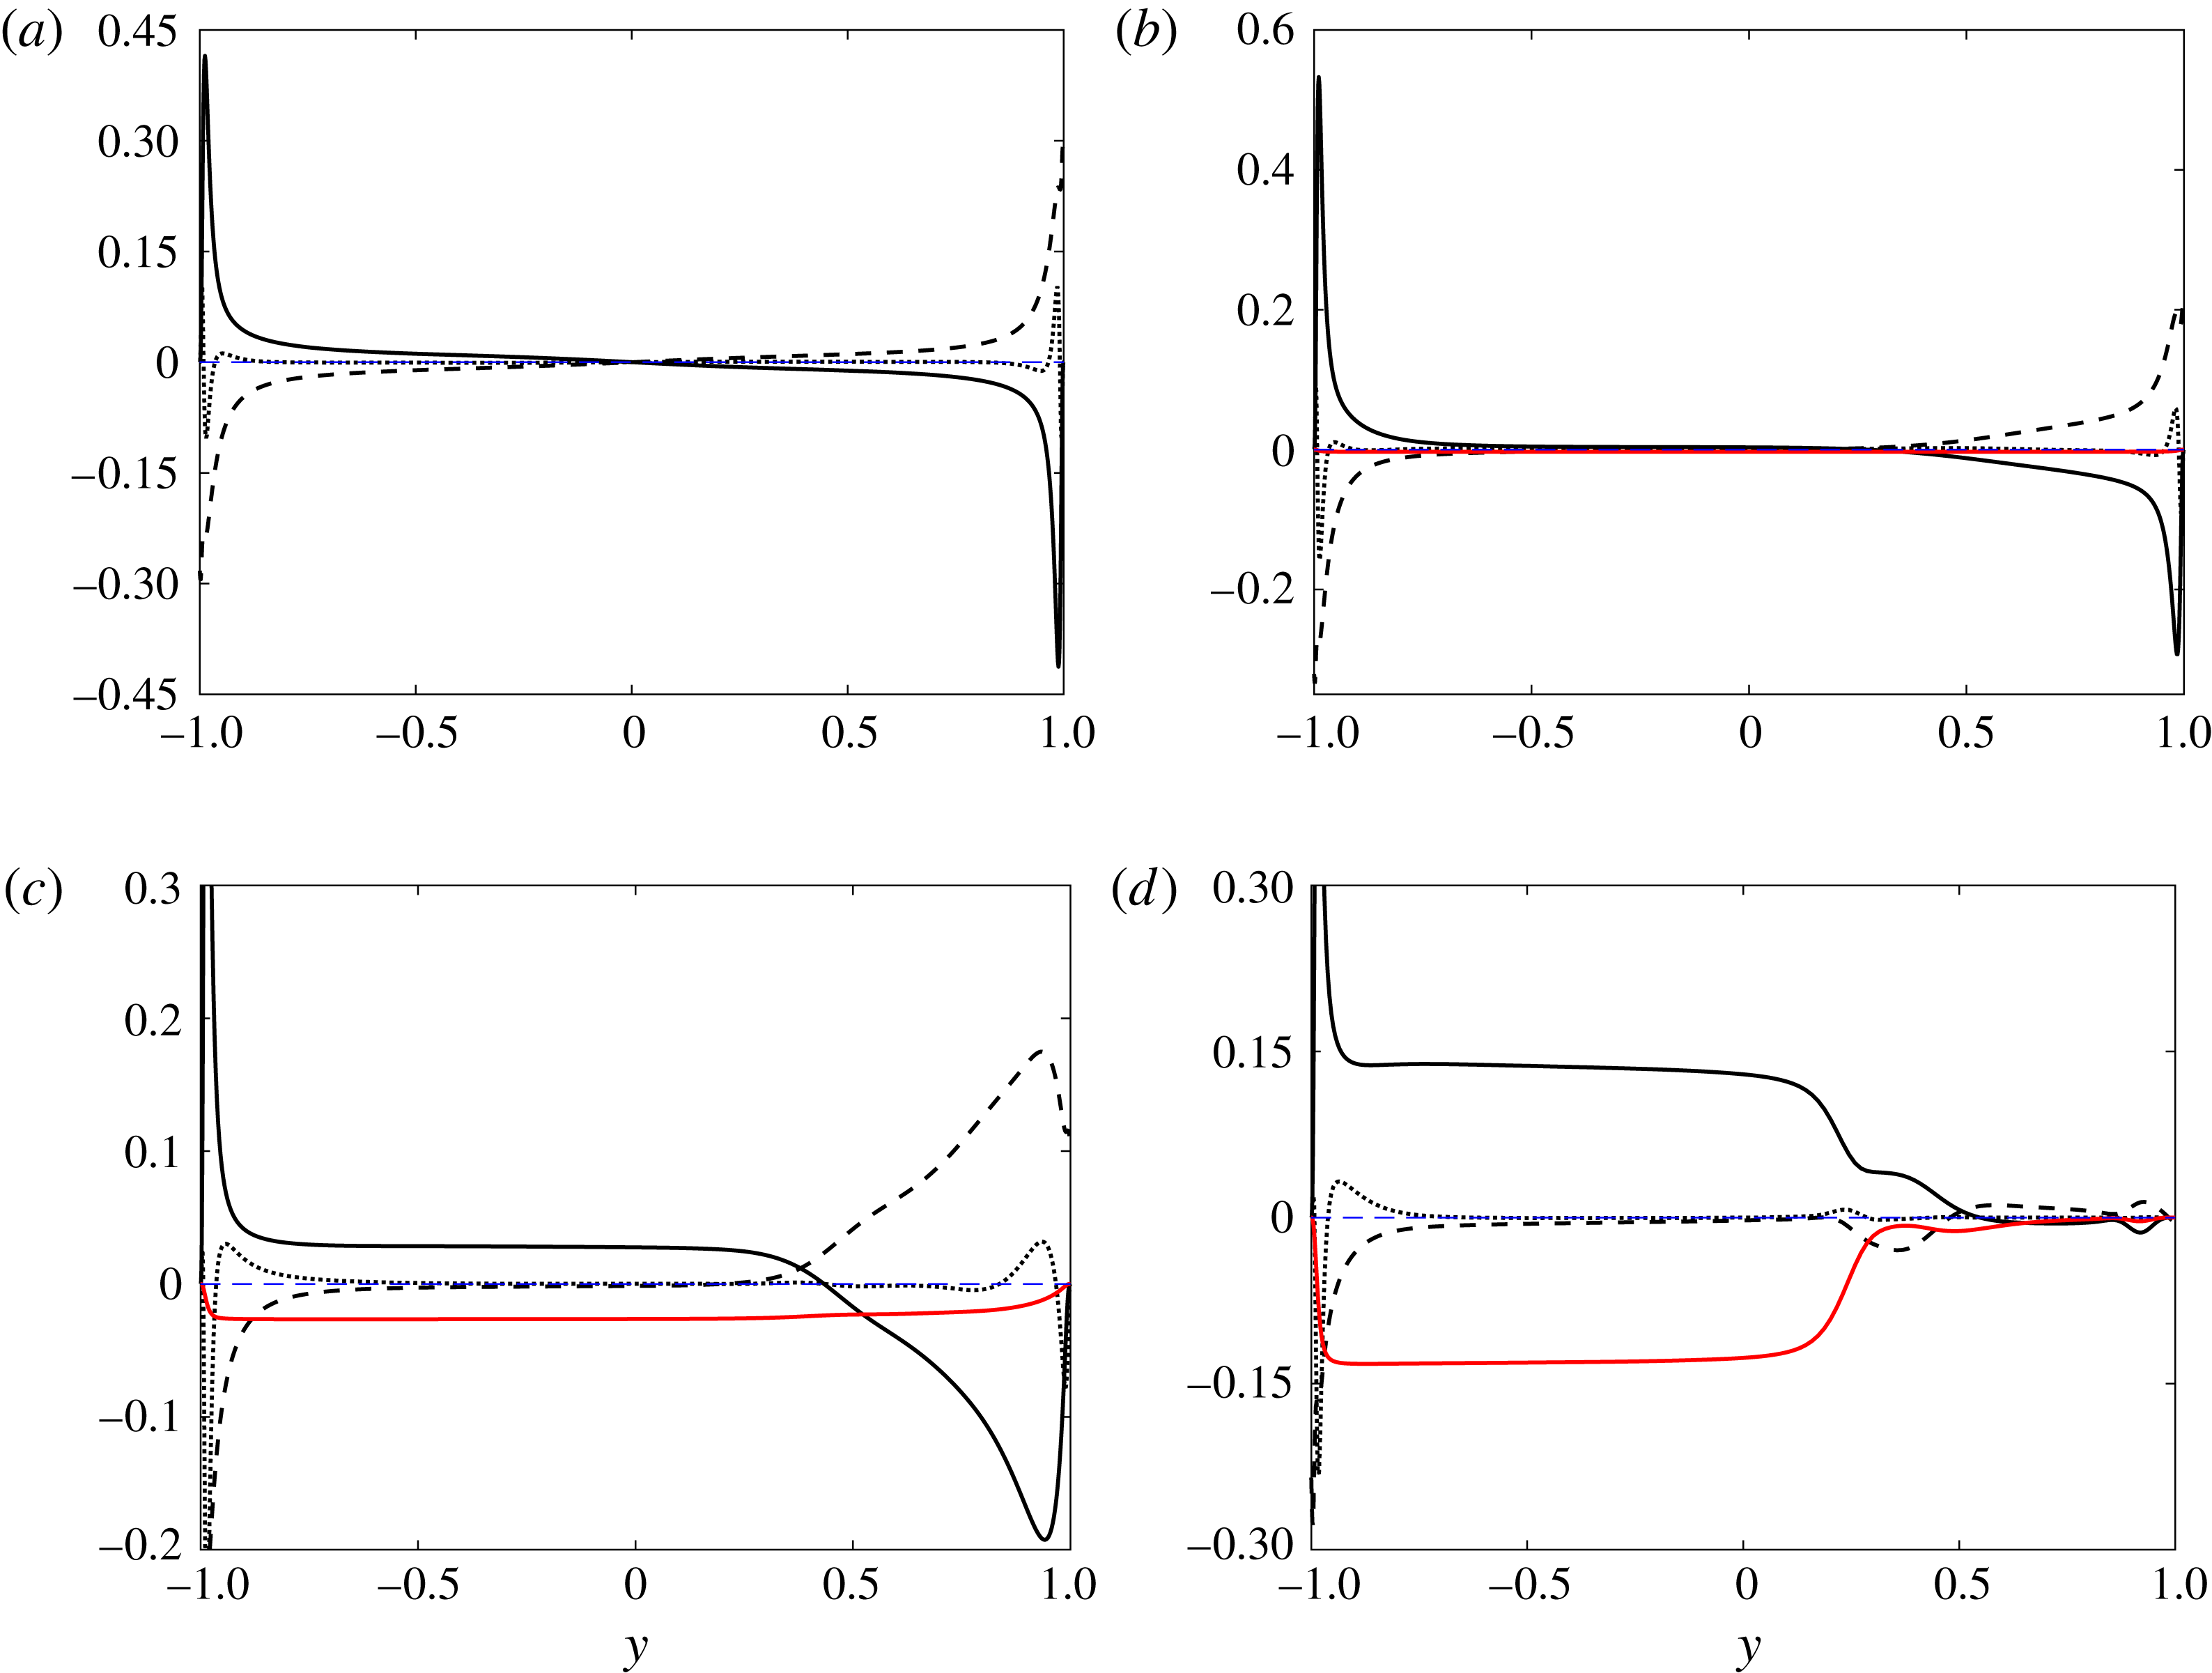
Figure 14 shows in wall units the budgets
 $P_{1}^{+}$
,
 $\unicode[STIX]{x1D6F1}_{1}^{+}$
,
 $D_{1}^{t+}$
and
 $C_{1}^{+}$
of the governing equation (3.4) of
 $\overline{u\unicode[STIX]{x1D703}}$
at
 $Ro=0$
, 0.15, 0.65 and 1.2. Again,
 $D_{1}^{m+}$
is not shown since it is small and
 $D_{1}^{t+}$
is important only near the walls. Production
 $P_{1}^{+}$
is mainly balanced by
 $\unicode[STIX]{x1D6F1}_{1}^{+}$
at
 $Ro=0$
and on the stable side at
 $Ro=0.15$
and 0.65, while at
 $Ro=1.2$
all terms are small here since the flow relaminarizes. Also
 $P_{1}^{+}$
is also mainly balanced by
 $\unicode[STIX]{x1D6F1}_{1}^{+}$
in the near-wall region of the unstable side at
 $Ro=0.15$
, but for
 $-0.6\lesssim y\lesssim 0.4$
all budget terms are small and
 $C_{1}^{+}$
is of the same order as
 $P_{1}^{+}$
and
 $\unicode[STIX]{x1D6F1}_{1}^{+}$
and negative since
 $\overline{v\unicode[STIX]{x1D703}}$
is negative, as shown by close inspection (figure 14
b). In the outer region of the unstable side
 $C_{1}^{+}$
grows with
 $Ro$
and basically balances
 $P_{1}^{+}$
when
 $Ro\geqslant 0.65$
, contributing to a small
 $\overline{u\unicode[STIX]{x1D703}}$
(figure 9
a), whereas
 $\unicode[STIX]{x1D6F1}_{1}^{+}$
is small (figure 14
c,d). The balance of
 $P_{1}^{+}$
and
 $C_{1}^{+}$
on the unstable side can be understood by considering the production term. It has two contributions, namely
 $-\overline{uv}(\unicode[STIX]{x2202}\unicode[STIX]{x1D6E9}/\unicode[STIX]{x2202}y)$
and
 $-\overline{v\unicode[STIX]{x1D703}}(\unicode[STIX]{x2202}U/\unicode[STIX]{x2202}y)$
; see (3.4). The first part is small on the unstable side away from the wall because
 $\unicode[STIX]{x2202}\unicode[STIX]{x1D6E9}/\unicode[STIX]{x2202}y$
is small. The second part
 $-\overline{v\unicode[STIX]{x1D703}}(\unicode[STIX]{x2202}U/\unicode[STIX]{x2202}y)$
is large but is nearly balanced by
 $C_{1}=\overline{v\unicode[STIX]{x1D703}}2\unicode[STIX]{x1D6FA}$
since
 $\unicode[STIX]{x2202}U/\unicode[STIX]{x2202}y\approx 2\unicode[STIX]{x1D6FA}$
on the unstable side. The Coriolis term
 $C_{1}$
thus has a major impact on
 $\overline{u\unicode[STIX]{x1D703}}$
and contributes to the alignment between the turbulent scalar flux and mean scalar gradient in rotating channel flow.
Budgets of the
 $\overline{u\unicode[STIX]{x1D703}}$
balance equation in wall units at (a)
 $Ro=0$
, (b)
 $Ro=0.15$
, (c)
 $Ro=0.65$
and (d)
 $Ro=1.2$
for:
 $P_{1}^{+}$
(solid black),
 $\unicode[STIX]{x1D6F1}_{1}^{+}$
(dashed),
 $D_{1}^{t+}$
(dotted) and
 $C_{1}^{+}$
(solid red).

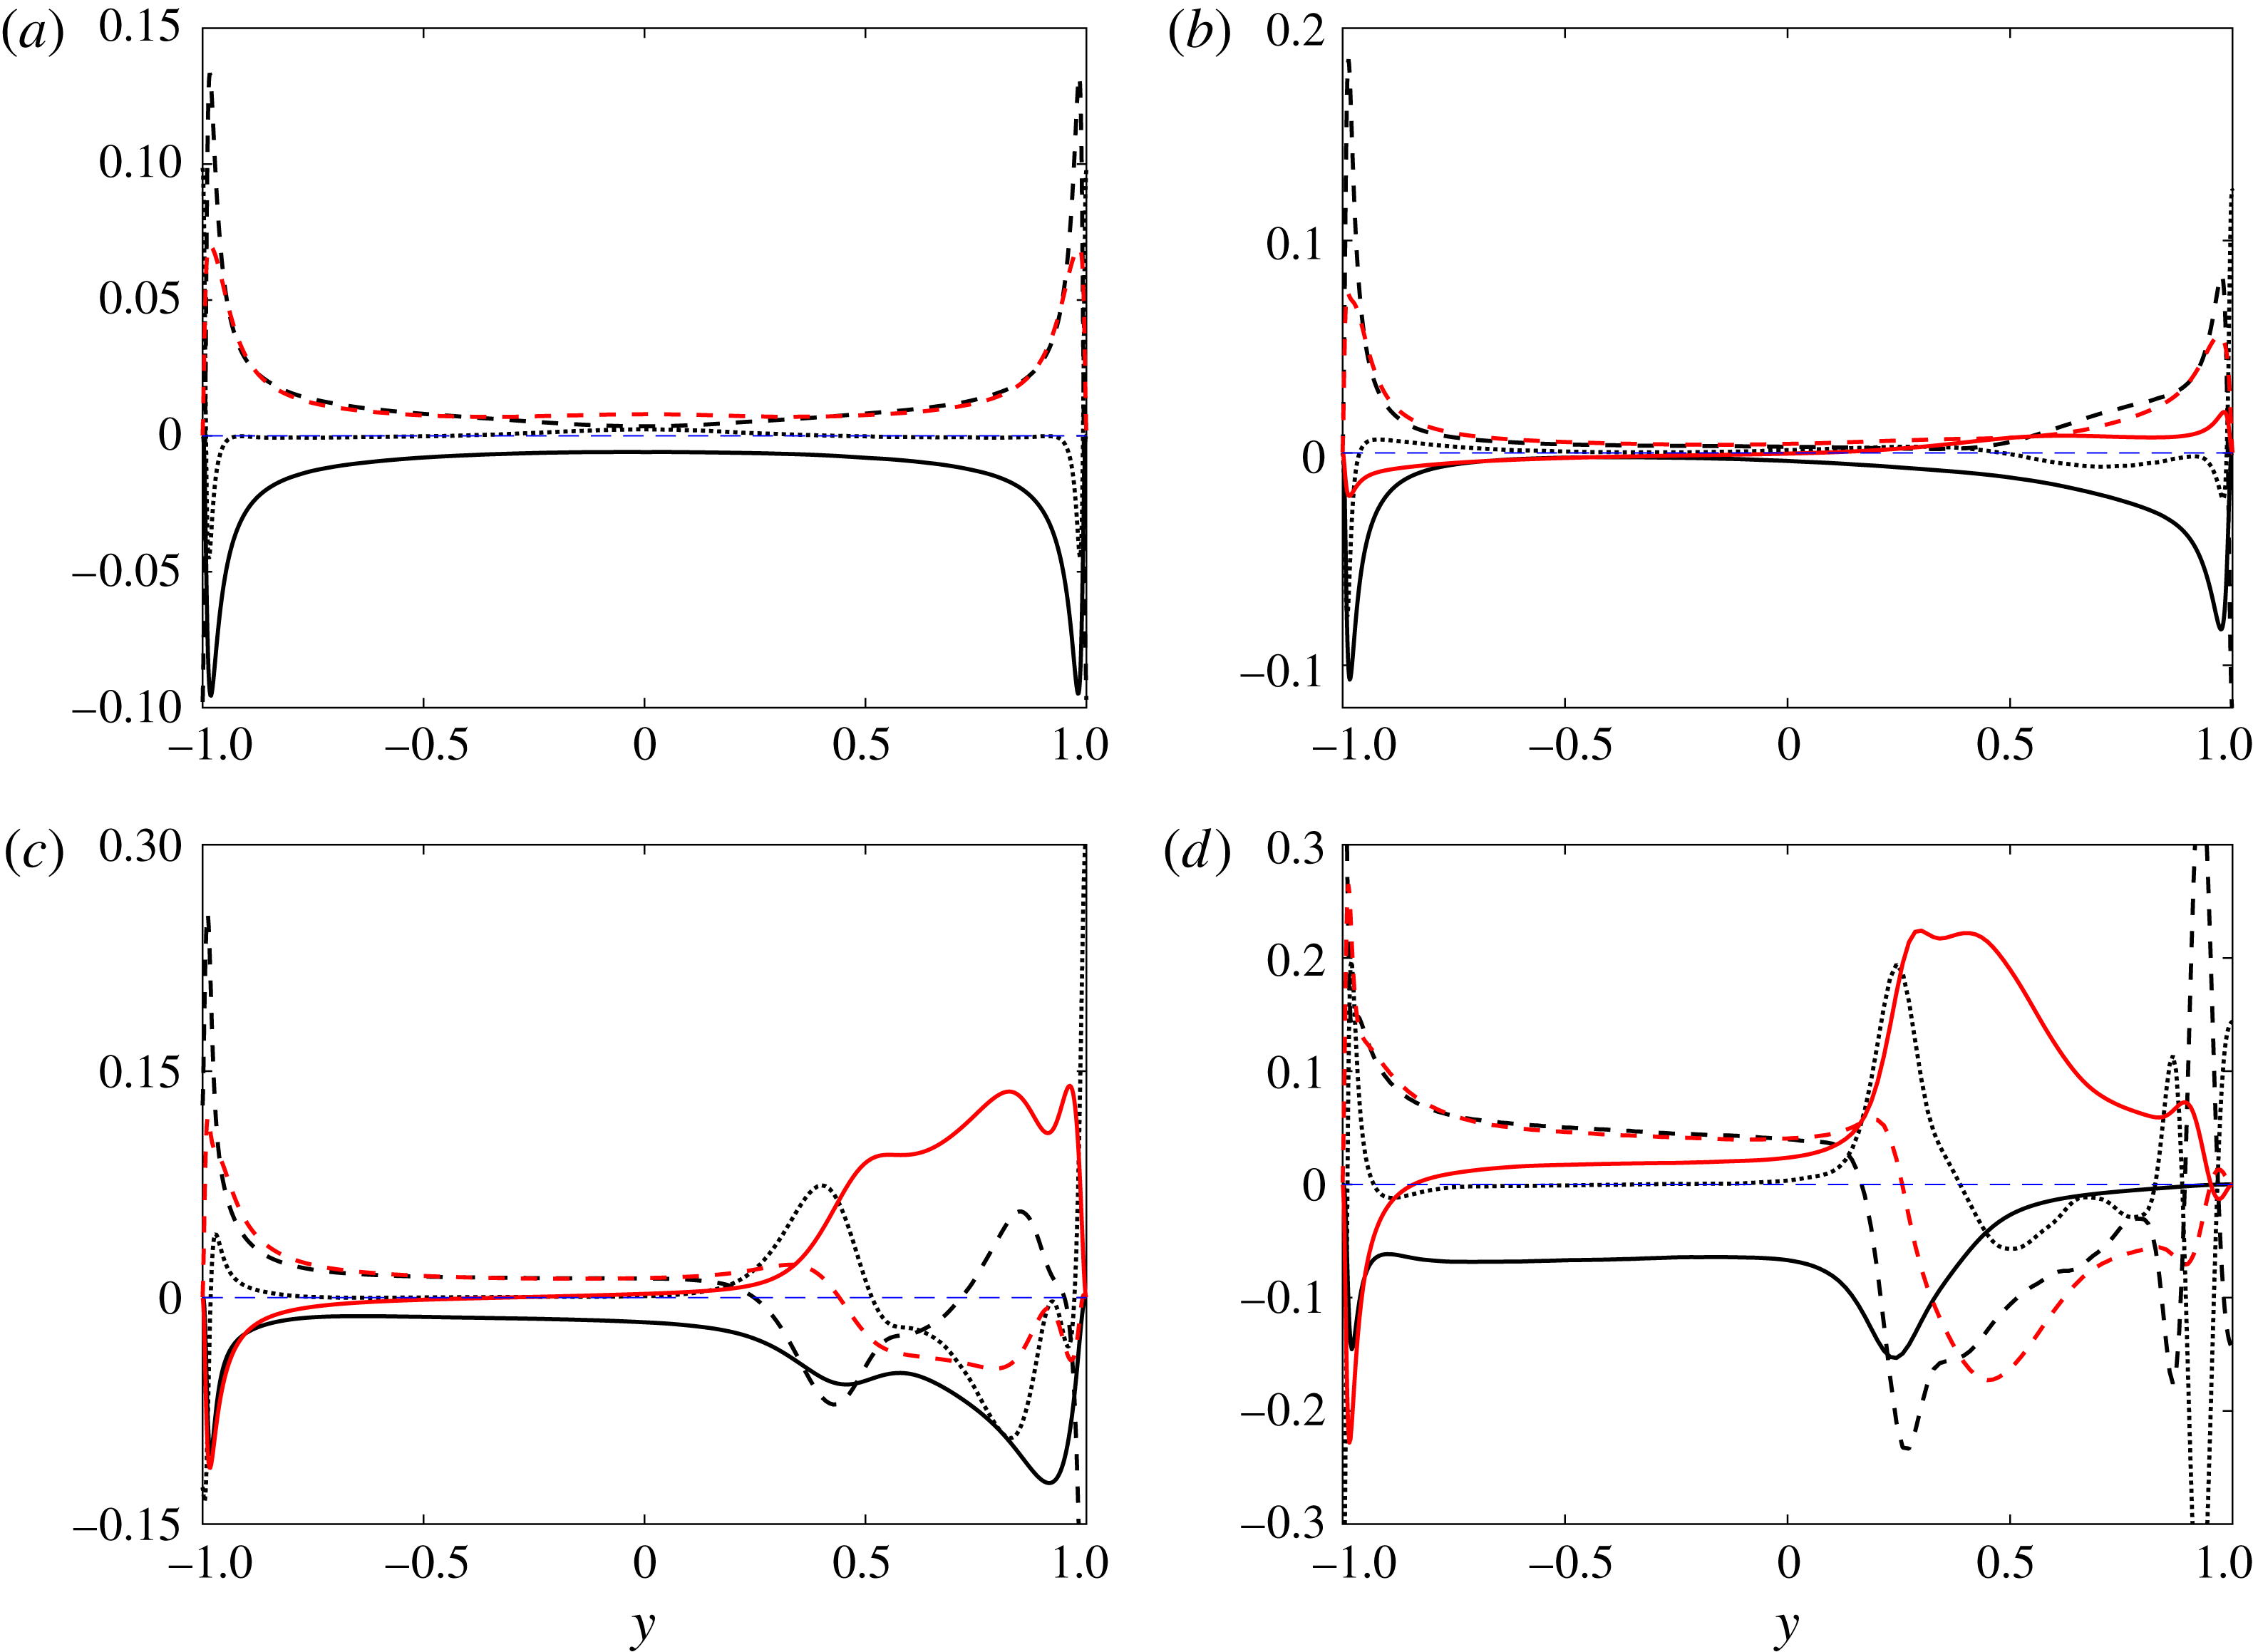
Figure 15 shows in wall units the budgets
 $P_{2}^{+}$
,
 $\unicode[STIX]{x1D6F1}_{2}^{+}$
,
 $C_{2}^{+}$
and the diffusion sum
 $D_{2}^{t+}+D_{2}^{p+}$
of the governing equation (3.5) of
 $\overline{v\unicode[STIX]{x1D703}}$
at
 $Ro=0$
, 0.15, 0.65 and 1.2. Molecular diffusion
 $D_{2}^{m+}$
is again small. At
 $Ro=0$
the dominant contributions come from
 $P_{2}^{+}$
and
 $\unicode[STIX]{x1D6F1}_{2}^{+}$
, except very near the walls and centre where diffusion is significant. All budget terms including
 $C_{2}^{+}$
are significant in a large part of the channel at
 $Ro=0.15$
. The term
 $C_{2}^{+}$
is large and positive on the stable side for
 $Ro\geqslant 0.65$
and therefore contributes here to a reduced wall-normal turbulent scalar transport. Near the wall on the unstable side
 $C_{2}^{+}$
is instead large and negative for
 $Ro\geqslant 0.65$
and augments wall-normal turbulent scalar transport but further from the wall it is small. The dominant contributions in the outer region of the unstable side come from
 $P_{2}^{+}$
and
 $\unicode[STIX]{x1D6F1}_{2}^{+}$
, which approximately balance each other for
 $Ro\geqslant 0.65$
. On the stable side, both
 $\unicode[STIX]{x1D6F1}_{2}^{+}$
and diffusion dominated by
 $D_{2}^{p+}$
display large variations if
 $Ro\geqslant 0.65$
, but the profile of the sum
 $\unicode[STIX]{x1D6F1}_{2}^{+}+D_{2}^{p+}=-((\overline{\unicode[STIX]{x1D703}\unicode[STIX]{x2202}p}/\unicode[STIX]{x2202}y)/\unicode[STIX]{x1D70C})^{+}$
, which is also displayed in figure 15, is much smoother and does not show extreme values near the wall. This suggests that it might be easier to model the latter term in rotating channel flow than
 $\unicode[STIX]{x1D6F1}_{2}$
and
 $D_{2}^{p}$
separately. The complex behaviour of the budget terms on the stable side is probably linked to the relaminarization of the flow.
Budgets of the
 $\overline{v\unicode[STIX]{x1D703}}$
balance equation in wall units at (a)
 $Ro=0$
, (b)
 $Ro=0.15$
, (c)
 $Ro=0.65$
and (d)
 $Ro=1.2$
for:
 $P_{2}^{+}$
(solid black),
 $\unicode[STIX]{x1D6F1}_{2}^{+}$
(dashed black),
 $D_{2}^{t+}+D_{2}^{p+}$
(dotted),
 $\unicode[STIX]{x1D6F1}_{2}^{+}+D_{2}^{p+}$
(dashed red) and
 $C_{2}^{+}$
(solid red).

Figure 16 shows the production terms of turbulent kinetic energy
 $P_{K}$
and
 $P_{\unicode[STIX]{x1D703}}$
near the wall on the unstable side at
 $Ro=0$
and 0.65. Also shown are the sum
 $P_{2}+C_{2}$
, which can be seen as a total production of
 $\overline{v\unicode[STIX]{x1D703}}$
, and
 $P_{1\unicode[STIX]{x1D703}}=-\overline{uv}(\unicode[STIX]{x2202}\unicode[STIX]{x1D6E9}/\unicode[STIX]{x2202}y)$
and
 $P_{1u}=\overline{v\unicode[STIX]{x1D703}}(2\unicode[STIX]{x1D6FA}\overline{v\unicode[STIX]{x1D703}}-\unicode[STIX]{x2202}U/\unicode[STIX]{x2202}y)$
, which are the production due to the mean scalar gradient, respectively, the production by mean shear together with Coriolis term contribution in the governing equation (3.4) of
 $\overline{u\unicode[STIX]{x1D703}}$
. The latter term,
 $P_{1u}$
, is small away from the wall on the unstable side for
 $Ro>0$
when
 $\unicode[STIX]{x2202}U/\unicode[STIX]{x2202}y\approx 2\unicode[STIX]{x1D6FA}$
, as explained before. All terms and the distance to the wall
 $y^{\ast }$
are in wall units. The production terms are premultiplied by
 $y^{\ast }$
to accentuate the behaviour away from the wall. Here,
 $u_{u\unicode[STIX]{x1D70F}}$
is used instead of
 $u_{\unicode[STIX]{x1D70F}}$
for the scaling at
 $Ro=0.65$
because this velocity scale is more appropriate on the unstable side. In DNS of scalar transport with
 $Pr=1$
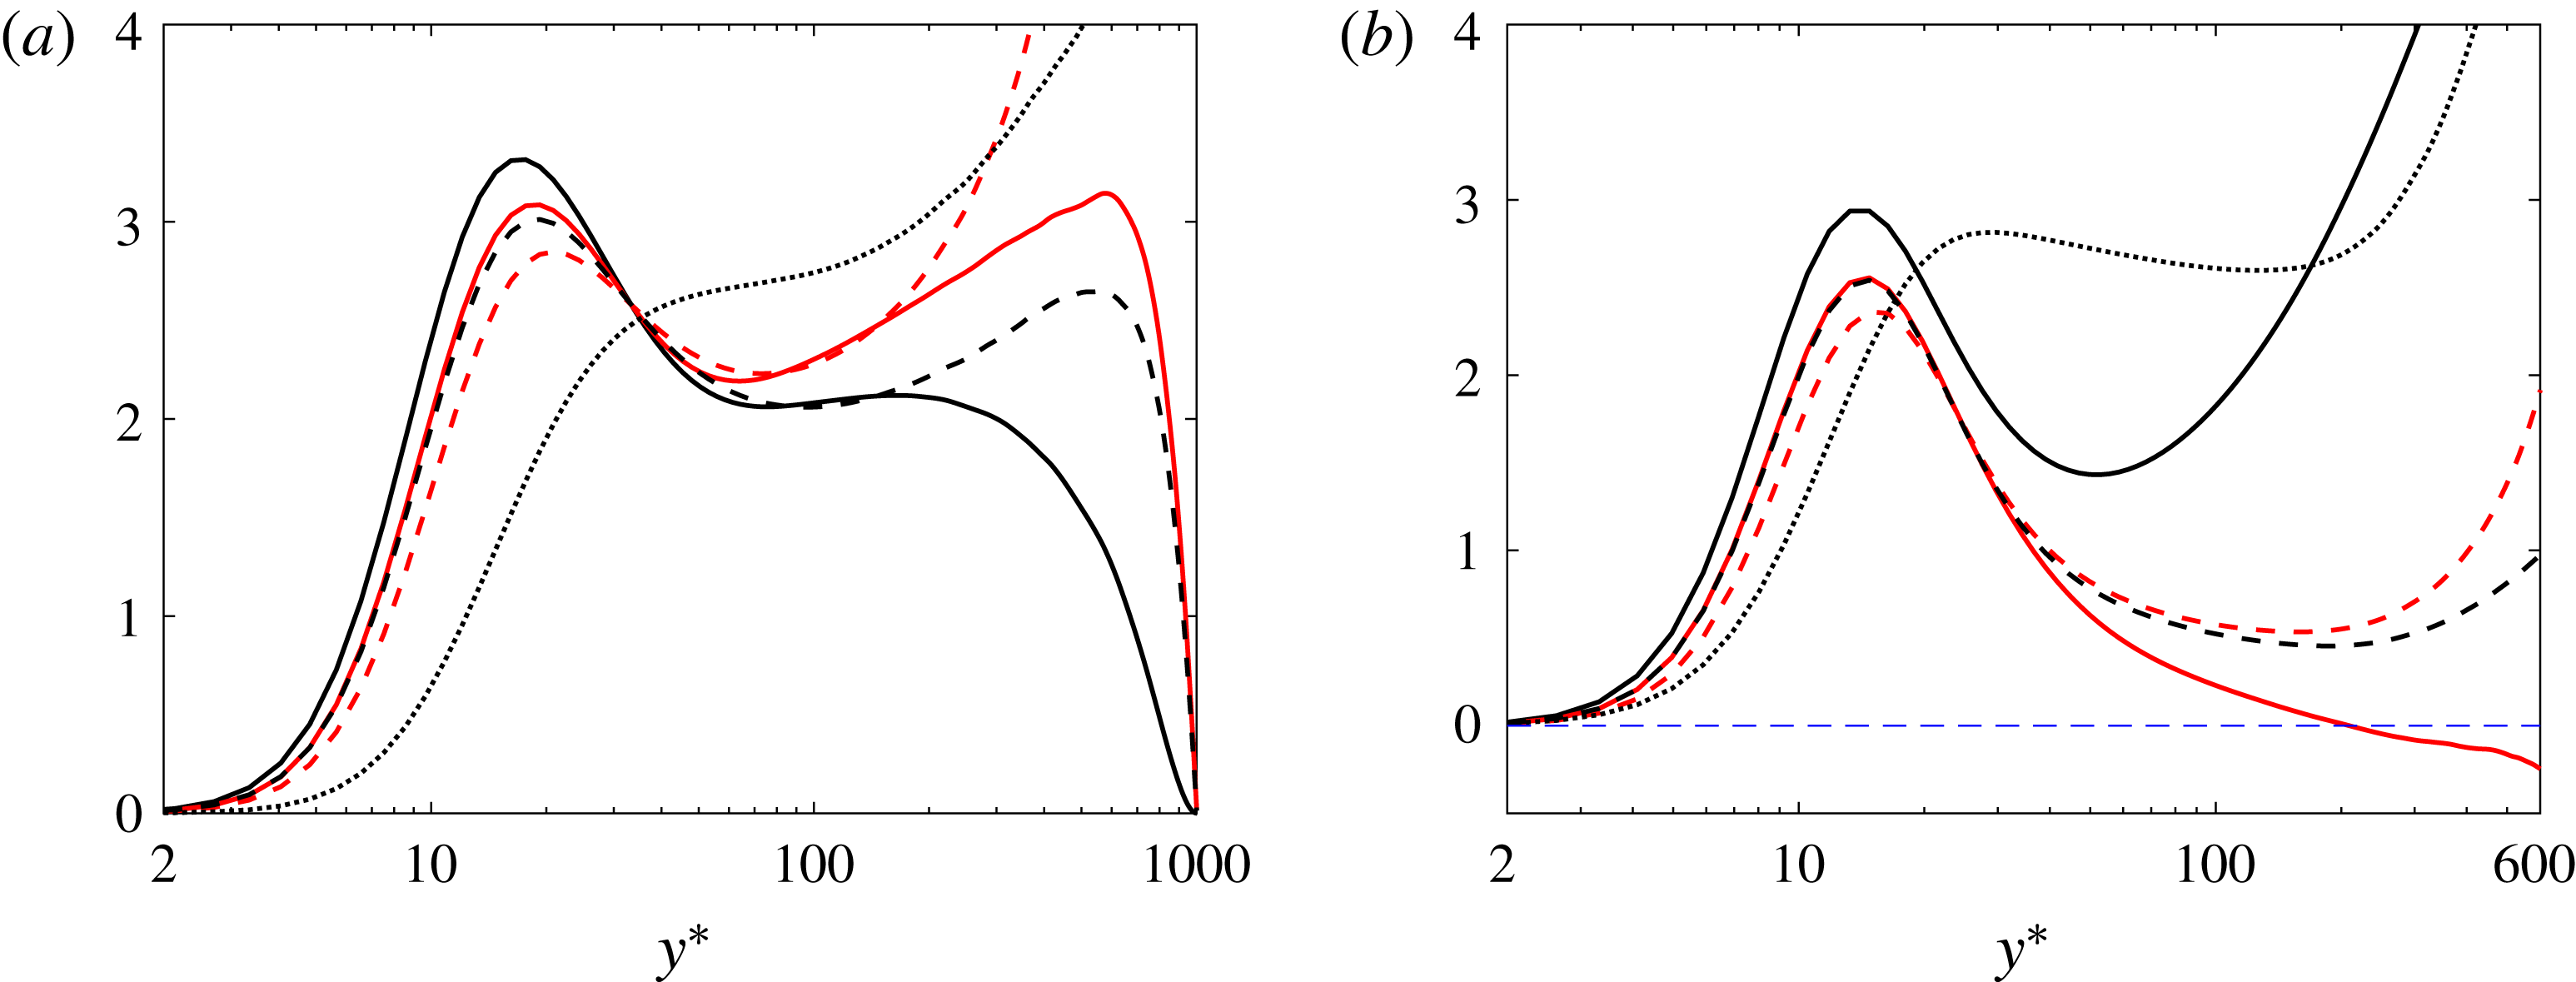
in non-rotating channel flow (not presented) the profiles of
 $P_{K}^{\ast }$
,
 $P_{\unicode[STIX]{x1D703}}^{\ast }$
,
 $P_{1\unicode[STIX]{x1D703}}^{\ast }$
and
 $P_{1u}^{\ast }$
including the maxima all collapse near the wall; see also Pirozzoli et al. (Reference Pirozzoli, Bernardini and Orlandi2016). Figure 16(a) shows that in the present case with
 $Pr=0.71$
the profiles do not collapse when
 $Ro=0$
since the maximum of
 $P_{K}^{\ast }$
approaches
 $1/4$
whereas the maximum of
 $P_{\unicode[STIX]{x1D703}}^{\ast }$
is
 $Pr/4$
as explained before. The maxima of
 $P_{1\unicode[STIX]{x1D703}}^{\ast }$
and
 $P_{1u}^{\ast }$
are in between these two maxima and approximately equal to each other, showing that production due to the mean scalar gradient and mean shear are equally important. The maxima change little with
 $Ro$
(compare figure 16
a,b). The profiles of
 $P_{1\unicode[STIX]{x1D703}}^{\ast }$
and
 $P_{1u}^{\ast }$
approximately collapse for
 $y^{\ast }\lesssim 20$
(figure 16
b), also at other
 $Ro$
, while they do not collapse if the Coriolis term is not included in
 $P_{1u}^{\ast }$
. A logarithmic
 $\unicode[STIX]{x1D6E9}$
profile, observed before, implies
 $y^{\ast }P_{\unicode[STIX]{x1D703}}^{\ast }$
is constant because
 $\overline{v\unicode[STIX]{x1D703}}$
is essentially constant away from the wall, but a region with constant
 $y^{\ast }P_{\unicode[STIX]{x1D703}}^{\ast }$
is observed neither at
 $Ro=0$
nor at
 $Ro=0.65$
. A much higher
 $Re$
is presumably needed for such a constant region to emerge.
Premultiplied production terms in wall units on the unstable side at (a)
 $Ro=0$
and (b)
 $Ro=0.65$
for:
 $y^{\ast }P_{K}^{\ast }$
(solid black),
 $y^{\ast }P_{\unicode[STIX]{x1D703}}^{\ast }$
(dashed red),
 $y^{\ast }P_{1\unicode[STIX]{x1D703}}^{\ast }$
(dashed black),
 $y^{\ast }P_{1u}^{\ast }$
(solid red) and
 $y^{\ast }(P_{2}^{\ast }+C_{2}^{\ast })$
(dotted black).

3.5 Efficiency of scalar transport
An important quantity in engineering is the Nusselt number defined here as the ratio of wall-normal scalar flux in turbulent channel flow and laminar channel flow
 $$\begin{eqnarray}Nu=\frac{2h}{\unicode[STIX]{x1D6FC}\unicode[STIX]{x0394}\unicode[STIX]{x1D6E9}}Q_{w},\end{eqnarray}$$
where
 $\unicode[STIX]{x0394}\unicode[STIX]{x1D6E9}$
is the scalar difference at the walls. Note that
 $Nu=1$
for laminar channel flow.
However,
 $Nu$
does not distinguish between scalar transport on the stable and unstable channel sides. To examine scalar transport on both sides, I have also computed a Nusselt number defined similarly as in some previous studies, e.g. Pirozzoli et al. (Reference Pirozzoli, Bernardini and Orlandi2016) and Abe & Antonia (Reference Abe and Antonia2017), to account for the different mean scalar gradients on both sides. For the unstable channel side it is defined as
 $$\begin{eqnarray}Nu_{u}^{\ast }=\frac{5}{8}Q_{w}\frac{\unicode[STIX]{x1D6FF}}{\unicode[STIX]{x1D6FC}|\unicode[STIX]{x1D6E9}_{w}-\unicode[STIX]{x1D6E9}_{m}|}.\end{eqnarray}$$
Here,
 $\unicode[STIX]{x1D6FF}=y_{0}-y_{w}$
where
 $y_{0}$
is the position where the sum of the viscous and turbulent shear stress is zero, and
 $y_{w}=-1$
and
 $\unicode[STIX]{x1D6E9}_{w}=0$
, i.e. the scalar value at
 $y=-1$
. I consider
 $y_{0}$
the position separating the stable and unstable channel sides. Further
 $$\begin{eqnarray}\unicode[STIX]{x1D6E9}_{m}=\frac{1}{\unicode[STIX]{x1D6FF}}\int _{y_{w}}^{y_{0}}\frac{U\unicode[STIX]{x1D6E9}}{U_{m}}\,\text{d}y,\quad U_{m}=\frac{1}{\unicode[STIX]{x1D6FF}}\int _{y_{w}}^{y_{0}}U\,\text{d}y.\end{eqnarray}$$
The Nusselt number for the stable side,
 $Nu_{s}^{\ast }$
, is defined similarly with the integrals in (3.8) from
 $y_{0}$
to
 $y_{w}=1$
and
 $\unicode[STIX]{x1D6E9}_{w}=1$
, i.e. the scalar value at
 $y=1$
. The factor
 $5/8$
in (3.7) and in the similar expression for
 $Nu_{s}^{\ast }$
ensures that
 $Nu_{u}^{\ast }=Nu_{s}^{\ast }=1$
if the flow is laminar, as is verified when using the laminar parabolic and straight profile for
 $U$
and
 $\unicode[STIX]{x1D6E9}$
, respectively, in (3.8). The main difference between the expressions for
 $Nu$
and
 $Nu_{u}^{\ast }$
,
 $Nu_{s}^{\ast }$
is that
 $\unicode[STIX]{x0394}\unicode[STIX]{x1D6E9}/2h$
is replaced by
 $|\unicode[STIX]{x1D6E9}_{w}-\unicode[STIX]{x1D6E9}_{m}|/\unicode[STIX]{x1D6FF}$
as an effective mean scalar gradient.
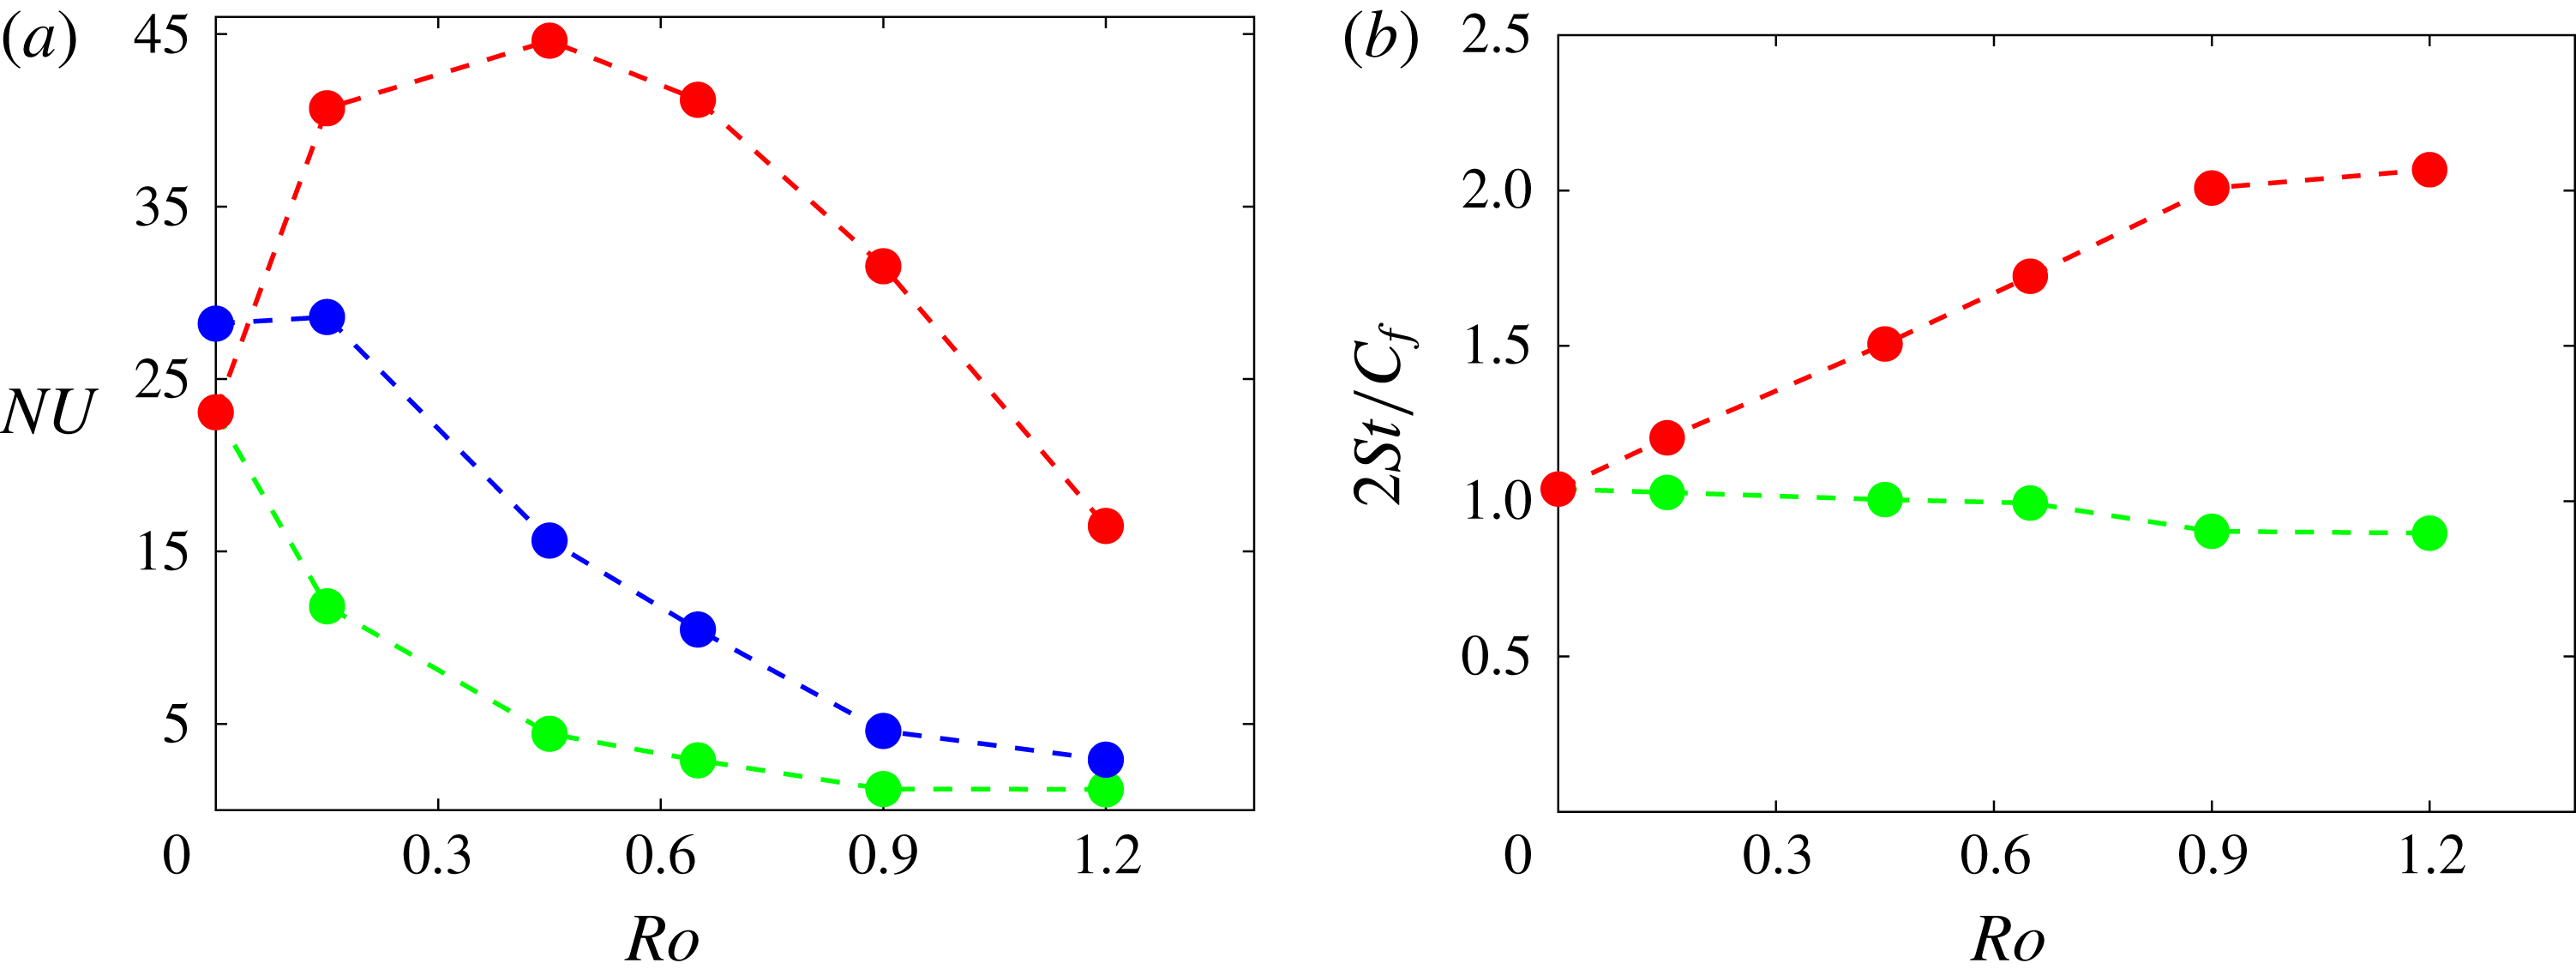
Plots of (a)
 $Nu$
(blue),
 $Nu_{u}^{\ast }$
(red) and
 $Nu_{s}^{\ast }$
(green), and of (b)
 $2St/C_{f}$
on the unstable (red) and stable (green) channel sides.

Figure 17(a) shows
 $Nu$
together with
 $Nu_{u}^{\ast }$
and
 $Nu_{s}^{\ast }$
as functions of
 $Ro$
. It can be seen that
 $Nu$
grows slightly at first but then declines rapidly with
 $Ro$
, implying that rotation inhibits the cross-channel scalar transport. The behaviour of
 $Nu$
in the present case is different from that in a rotating channel flow at lower
 $Re_{\unicode[STIX]{x1D70F}}=194$
when
 $Nu$
monotonically decreases with
 $Ro$
(Liu & Lu Reference Liu and Lu2007). The high values of
 $Nu_{u}^{\ast }$
for
 $0.15\leqslant Ro\leqslant 0.9$
and rapid decline of
 $Nu_{s}^{\ast }$
with
 $Ro$
reflect the rapid and slow turbulent scalar transport on the unstable and stable channel sides, respectively. At high
 $Ro$
diffusive scalar transport becomes significant since both
 $Nu$
and
 $Nu_{s}^{\ast }$
approach unity.
Figure 17(b) shows the ratio of Stanton number to skin friction coefficient
 $2St/C_{f}$
where
 $$\begin{eqnarray}St=\frac{Q_{w}}{U_{m}T_{m}},\quad C_{f}=\frac{2u_{\unicode[STIX]{x1D70F}}^{2}}{U_{m}^{2}}.\end{eqnarray}$$
Here,
 $U_{m}$
,
 $T_{m}$
and
 $u_{\unicode[STIX]{x1D70F}}$
are computed for the unstable and stable sides according to (3.8). If the Reynolds analogy for momentum and scalar transport is valid,
 $2St/C_{f}$
should approach unity (Abe & Antonia Reference Abe and Antonia2017). When
 $Ro=0$
and on the stable side for
 $Ro>0$
,
 $2St/C_{f}$
is indeed near unity, but on the unstable side it grows with
 $Ro$
and clearly deviates from unity, suggesting that the Reynolds analogy is valid for the stable side but not for the unstable channel side where scalar transport is relatively rapid.
A measure of turbulence to scalar fluctuation intensity is the dimensionless parameter
 $$\begin{eqnarray}B=\frac{\sqrt{K}/(\text{d}U/\text{d}y)}{\sqrt{K}_{\unicode[STIX]{x1D703}}/(\text{d}\unicode[STIX]{x1D6E9}/\text{d}y)}.\end{eqnarray}$$
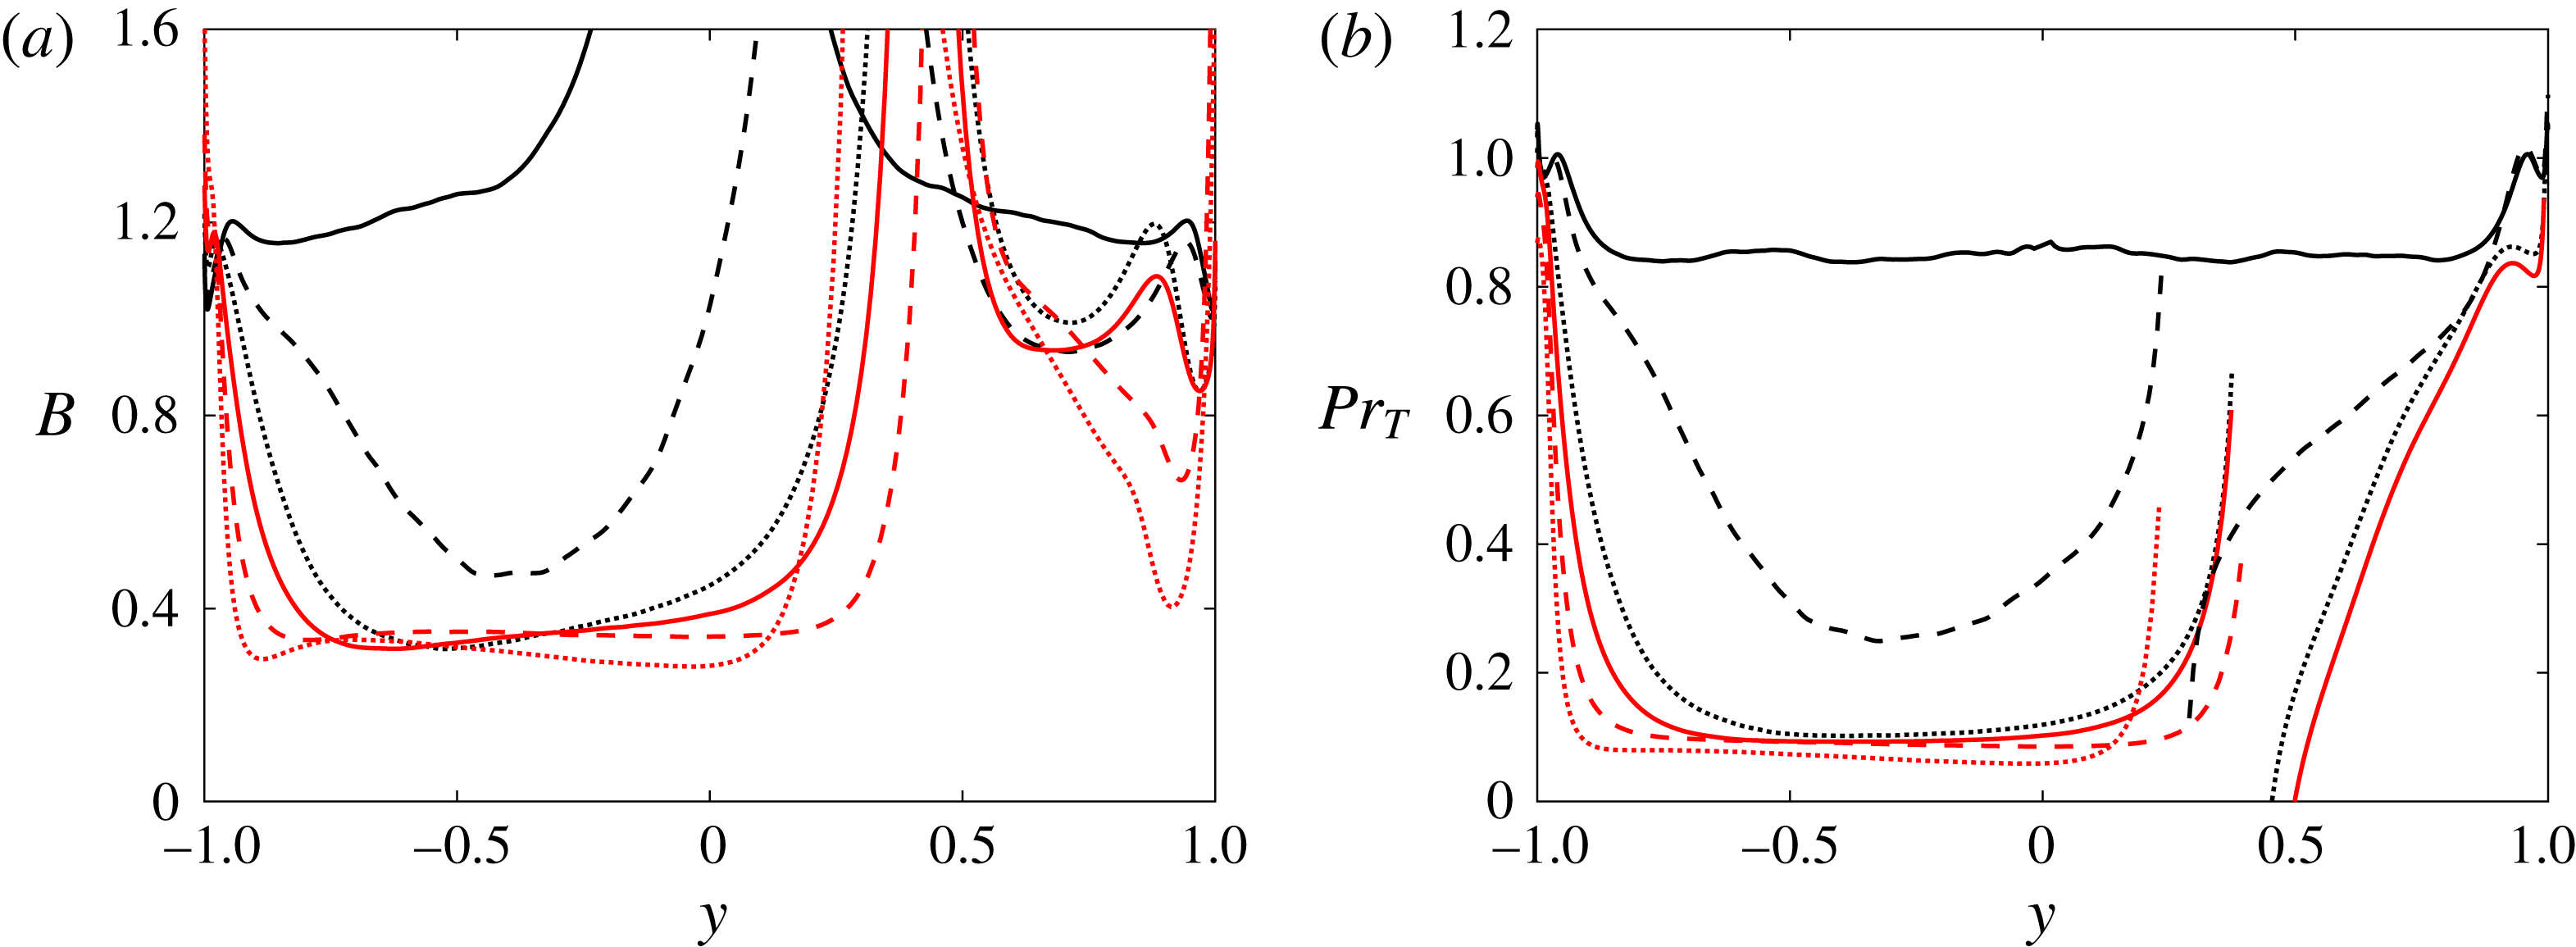
Figure 18(a) shows profiles of
 $B$
. In the outer region
 $-0.95\lesssim y\lesssim -0.6$
and
 $0.4\lesssim y\lesssim 0.95$
,
 $B$
varies between 1.2 and 1.3 at
 $Ro=0$
, as in DNS of non-rotating channel flow by Antonia et al. (Reference Antonia, Abe and Kawamura2009) at similar
 $Re$
. Near the centre
 $B$
is much larger in the present DNS since
 $\text{d}U/\text{d}y$
is small, unlike the fluctuations and
 $\text{d}\unicode[STIX]{x1D6E9}/\text{d}y$
. With increasing
 $Ro$
,
 $B$
declines to less than 0.4 in the outer region of the unstable side, meaning that rotation augments scalar fluctuations relative to velocity fluctuations, although neither in the governing equation of
 $K$
nor in
 $K_{\unicode[STIX]{x1D703}}$
is there a direct influence of rotation. The same trend is observed in rotating homogeneous shear flow with a passive scalar (Brethouwer Reference Brethouwer2005). Especially when the mean shear
 $\text{d}U/\text{d}y=2\unicode[STIX]{x1D6FA}$
, as in the absolute mean vorticity region in the present DNS, scalar fluctuations are relatively strong. The small values of
 $B$
suggest that
 $P_{\unicode[STIX]{x1D703}}$
is relatively large compared to
 $P_{K}$
.
Profiles of (a)
 $B$
and (b)
 $Pr_{T}$
. Lines as in figure 3.

An important quantity in turbulence modelling, often assumed to be a constant, is the ratio of turbulent viscosity to scalar diffusivity given by the turbulent Prandtl number:
 $$\begin{eqnarray}Pr_{T}=\frac{\unicode[STIX]{x1D708}_{T}}{\unicode[STIX]{x1D6FC}_{T}}=\frac{\,\overline{uv}\,}{\,\overline{v\unicode[STIX]{x1D703}}\,}\frac{\text{d}\unicode[STIX]{x1D6E9}/\text{d}y}{\text{d}U/\text{d}y}.\end{eqnarray}$$
It can also be considered as a relative measure of the production of
 $K$
to
 $K_{\unicode[STIX]{x1D703}}$
. Figure 18(b) shows profiles of
 $Pr_{T}$
obtained from the present DNS. At
 $Ro=0$
,
 $Pr_{T}\simeq 0.85$
in the outer region, consistent with the values computed by Antonia et al. (Reference Antonia, Abe and Kawamura2009) and Pirozzoli et al. (Reference Pirozzoli, Bernardini and Orlandi2016) for non-rotating channel flow. However,
 $Pr_{T}$
is considerably smaller in the outer region of the unstable side when
 $Ro>0$
; it is less than 0.2 for
 $Ro\geqslant 0.45$
. Also on the stable side at
 $Ro=0.15$
,
 $Pr_{T}$
is smaller than at
 $Ro=0$
away from the wall. These results show, like the ratio
 $2St/C_{f}$
in figure 17(b), that the Reynolds analogy for scalar-momentum transfer does not hold for
 $Ro>0$
and that turbulent scalar transport is efficient compared to momentum transfer on the unstable side. The low value of
 $Pr_{T}$
also implies that the production of
 $K_{\unicode[STIX]{x1D703}}$
is relatively strong compared to that of
 $K$
, consistent with the small values of
 $B$
observed for
 $Ro>0$
. Small values of
 $Pr_{T}$
are also observed in rotating homogeneous shear flow when the mean shear
 $\text{d}U/\text{d}y=2\unicode[STIX]{x1D6FA}$
(Brethouwer Reference Brethouwer2005).
The small values of
 $B$
and
 $Pr_{T}$
suggest that the scalar and velocity field are dissimilar in rotating channel flow, as already indicated by the correlation coefficients in figure 10. This dissimilarity is further explored by spectra in the next section.
3.6 Spectra
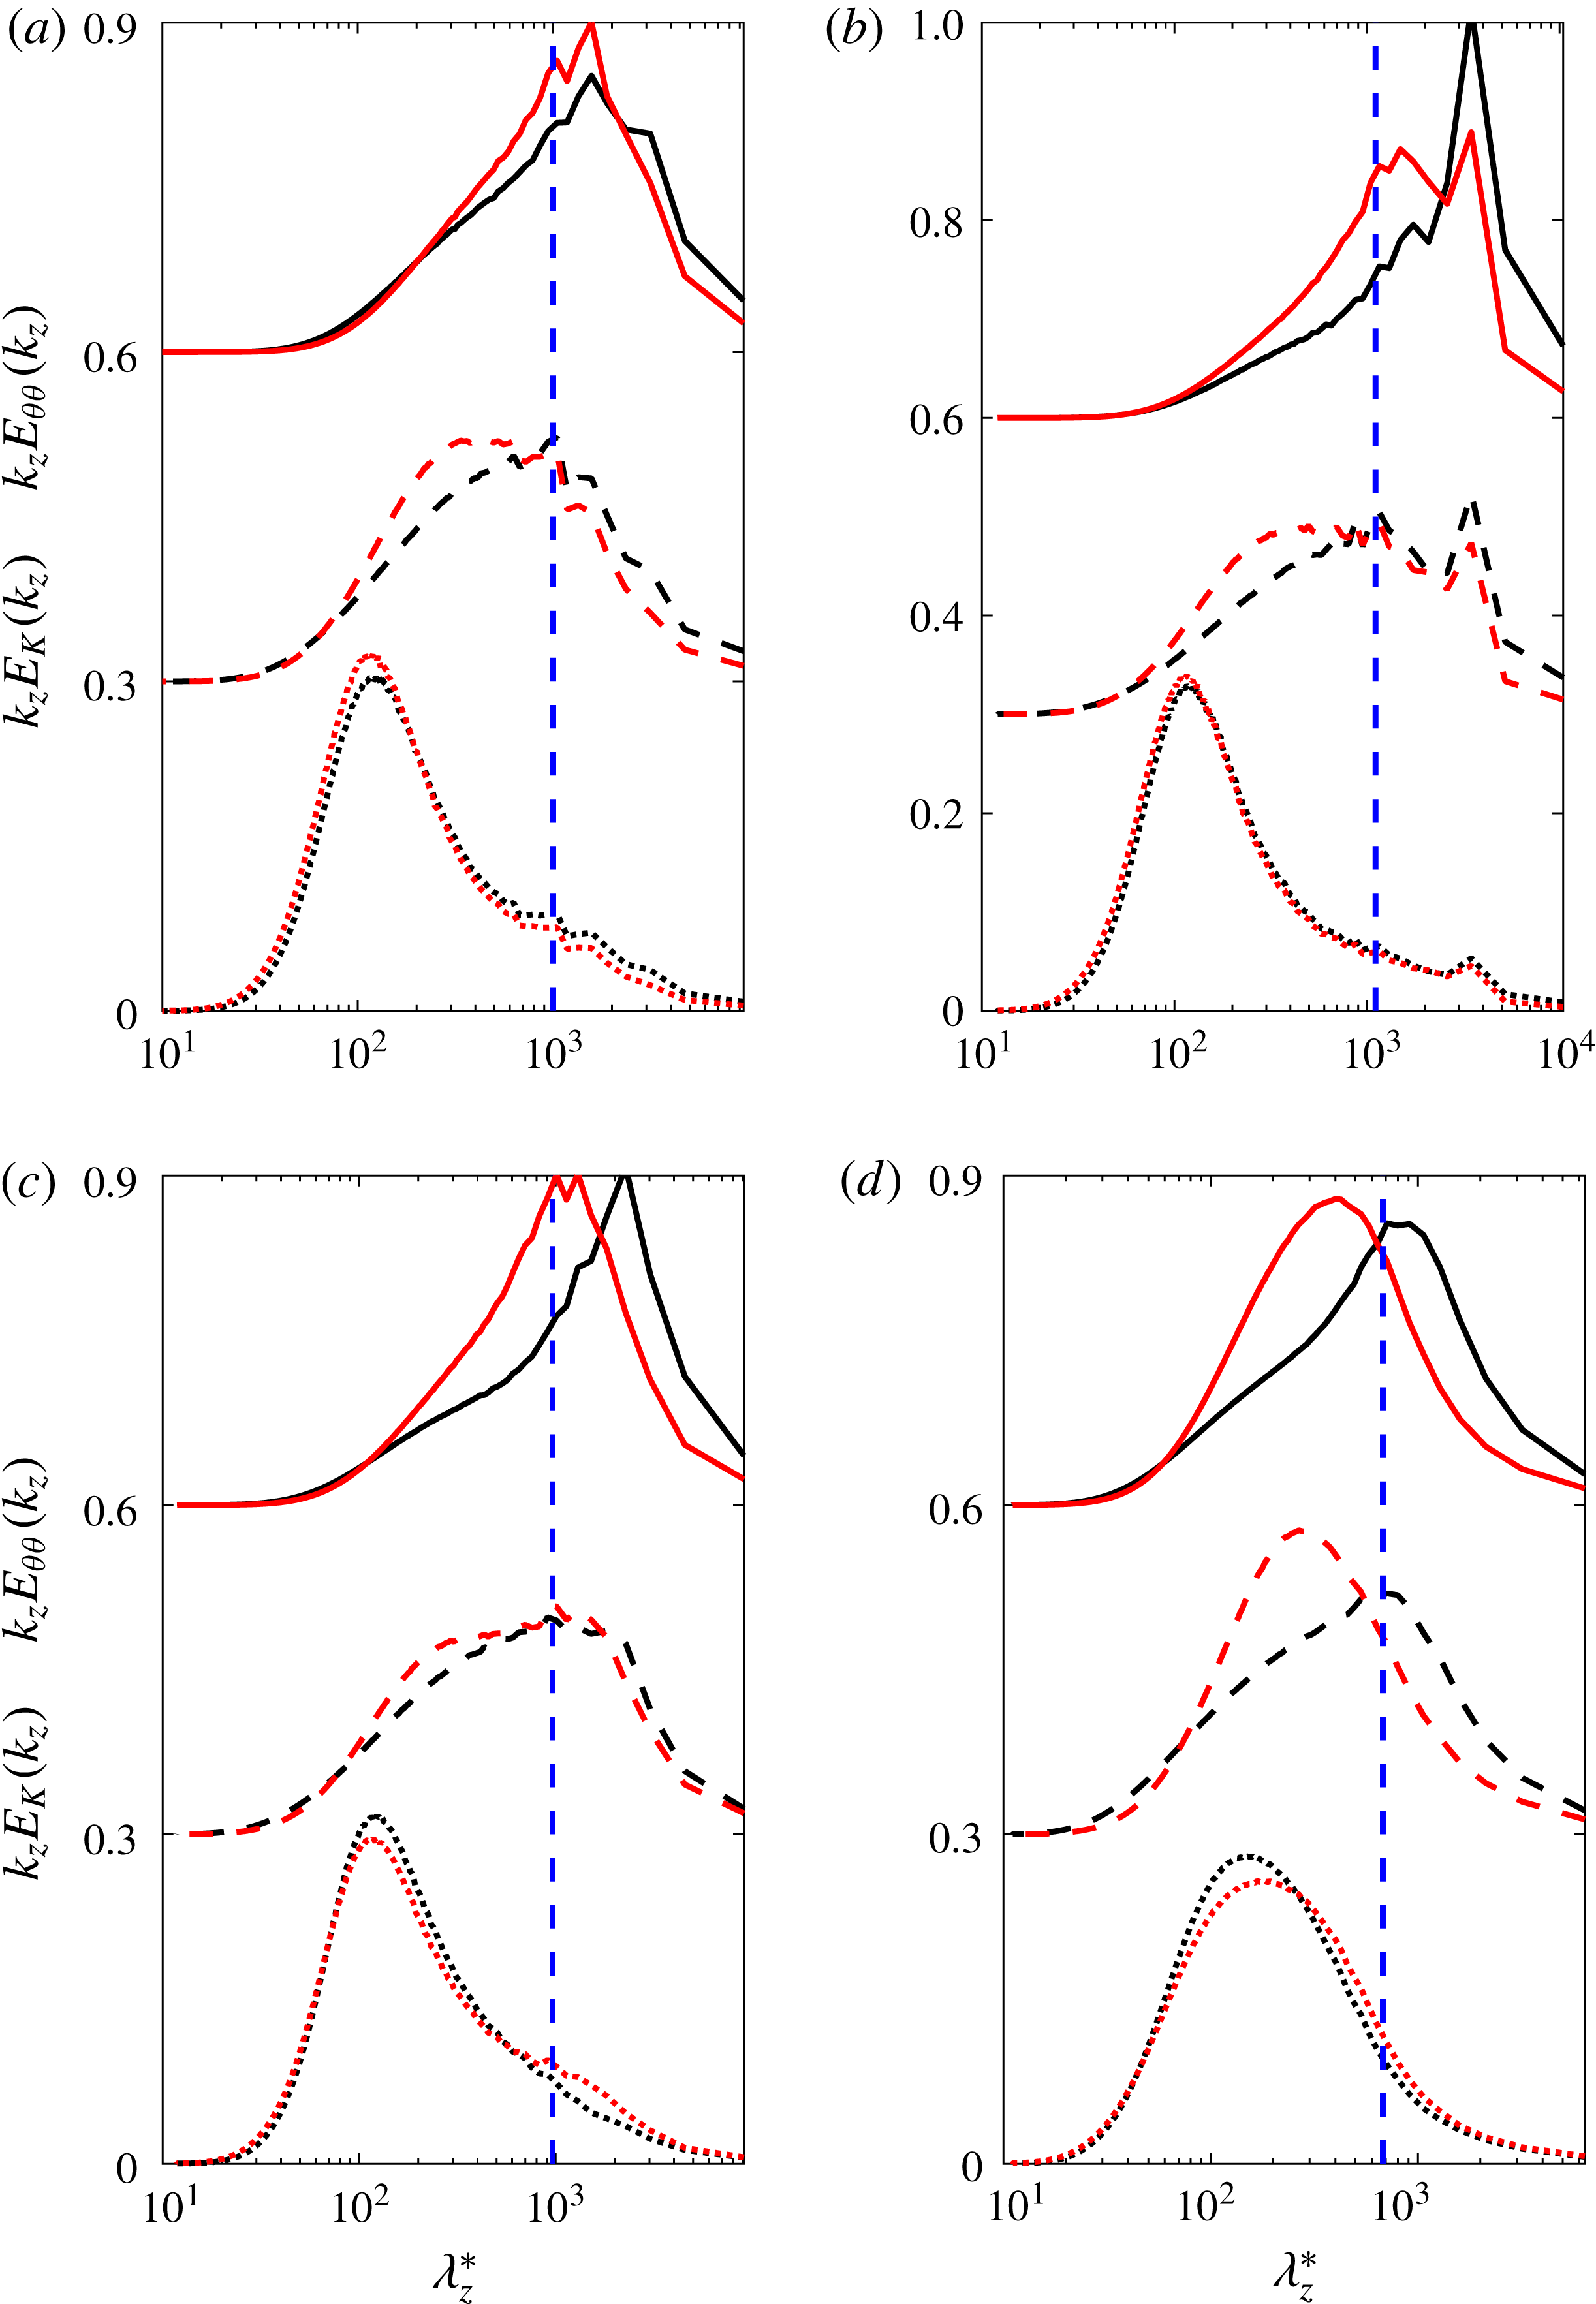
Premultiplied one-dimensional spanwise spectra of turbulent kinetic energy
 $k_{z}E_{K}(k_{z})$
and scalar variance
 $k_{z}E_{\unicode[STIX]{x1D703}\unicode[STIX]{x1D703}}(k_{z})$
, where
 $k_{z}$
is the spanwise wavenumber, at
 $Ro=0$
, 0.15, 0.45 and 0.9, are shown in figure 19 as a function of the spanwise non-dimensional wave length
 $\unicode[STIX]{x1D706}_{z}^{\ast }$
. The spectra are normalized such that
 $$\begin{eqnarray}\int _{0}^{\infty }E_{K}(k_{z})\,\text{d}k_{z}=1,\quad \int _{0}^{\infty }E_{\unicode[STIX]{x1D703}\unicode[STIX]{x1D703}}(k_{z})\,\text{d}k_{z}=1,\end{eqnarray}$$
and are computed at three wall-normal positions on the unstable channel side: near the wall at
 $y^{\ast }\approx 10$
, at
 $y^{\ast }\approx 100$
and in the outer region at
 $y\approx -0.55$
. A
 $^{\ast }$
implies scaling by
 $\unicode[STIX]{x1D708}/u_{\unicode[STIX]{x1D70F}u}$
, which is appropriate for spectra on the unstable side.
Premultiplied one-dimensional spanwise spectra as a function of
 $\unicode[STIX]{x1D706}_{z}^{\ast }$
at (a)
 $Ro=0$
, (b)
 $Ro=0.15$
, (c)
 $Ro=0.45$
and (d)
 $Ro=0.9$
. The red lines show
 $k_{z}E_{K}(k_{z})$
and the black lines
 $k_{z}E_{\unicode[STIX]{x1D703}\unicode[STIX]{x1D703}}(k_{z})$
. The spectra are at
 $y^{\ast }\approx 10$
(dotted),
 $y^{\ast }\approx 100$
(dashed) and
 $y\approx -0.55$
(solid). The spectra at the different locations are shifted in the vertical with an offset of 0.3. The vertical dashed line indicates scales with
 $\unicode[STIX]{x1D706}_{z}=1$
.

When
 $Ro=0$
,
 $k_{z}E_{\unicode[STIX]{x1D703}\unicode[STIX]{x1D703}}(k_{z})$
at
 $y^{\ast }\approx 10$
shows a peak at
 $\unicode[STIX]{x1D706}_{z}^{\ast }\approx 100$
, corresponding to the turbulent near-wall cycle, while in the outer region it has a peak at
 $\unicode[STIX]{x1D706}_{z}>h$
(figure 19
a) corresponding to large scalar scales, also observed by Pirozzoli et al. (Reference Pirozzoli, Bernardini and Orlandi2016). Antonia et al. (Reference Antonia, Abe and Kawamura2009) found that
 $k_{z}E_{\unicode[STIX]{x1D703}\unicode[STIX]{x1D703}}(k_{z})$
is similar to
 $k_{z}E_{K}(k_{z})$
, especially near the wall, which is mostly a consequence of similarities between
 $\unicode[STIX]{x1D703}$
and
 $u$
. This similarity at
 $Ro=0$
is also reflected by the present spectra (figure 19
a), although these indicate that away from the wall the scalar scales are somewhat wider than turbulent scales.
On the unstable side of rotating channel flow
 $k_{z}E_{\unicode[STIX]{x1D703}\unicode[STIX]{x1D703}}(k_{z})$
shows a high similarity with
 $k_{z}E_{K}(k_{z})$
near the wall at
 $y^{\ast }\approx 10$
(figure 19
b–d), but at
 $y^{\ast }\approx 100$
and in the outer region at
 $y\approx -0.55$
,
 $k_{z}E_{\unicode[STIX]{x1D703}\unicode[STIX]{x1D703}}(k_{z})$
is more skewed towards wider scales than
 $k_{z}E_{K}(k_{z})$
. This difference appears to become stronger at higher
 $Ro$
, implying that the scalar field contains larger scales than the turbulence field for
 $Ro>0$
. The streamwise spectra (not shown) disseminate a similar message. If
 $Ro=0$
the streamwise spectra of the turbulent kinetic energy and scalar variance are similar, but if
 $Ro>0$
the scalar scales are considerably longer than the turbulent scales in the outer region of the unstable side. The spectra thus also demonstrate the growing difference between the scalar and turbulence field on the unstable side as a consequence of rotation. The sharp peaks at
 $\unicode[STIX]{x1D706}_{z}=\unicode[STIX]{x03C0}h$
and
 $3\unicode[STIX]{x03C0}h/4$
in
 $k_{z}E_{\unicode[STIX]{x1D703}\unicode[STIX]{x1D703}}(k_{z})$
at
 $Ro=0.15$
and 0.45, respectively (figure 19
b,c), are most likely caused by large streamwise roll cells present at these
 $Ro$
(Brethouwer Reference Brethouwer2017), confirming that roll cells have an impact on the scalar field.
The spectra at
 $Ro=0.15$
on the stable side (not shown) indicate that the scalar field is more affected by the roll cells than the turbulence field, but otherwise the turbulence and scalar scales appear similar.
4 Conclusions
This paper reports a DNS study of passive scalar transport in turbulent channel flow subject to spanwise system rotation at a constant
 $Re=20\,000$
and
 $Pr=0.71$
while
 $Ro$
is varied from 0 to 1.2. The scalar is constant but different at the two walls, leading to a constant wall-normal mean scalar flux. The DNS show that rotation has a large impact on scalar transport. In rotating channel flow turbulence and turbulent scalar transport are relatively strong on the unstable channel side, but on the stable channel side with weak turbulence or laminar-like flow, turbulent scalar transport is weak. Although turbulence is weaker, scalar fluctuations are intense on the stable side and near the border between the stable and unstable side due to a steep mean scalar gradient.
The main conclusions of the study are that (i) rotation weakens the similarity between the scalar and velocity field, and (ii) the Reynolds analogy for scalar-momentum transfer does not hold for rotating turbulent channel flow. This is in obvious contrast to scalar transport in non-rotating turbulent channel flow where a stronger similarity between the scalar and velocity field exists and the Reynolds analogy is valid (see e.g. Antonia et al.
Reference Antonia, Abe and Kawamura2009; Pirozzoli et al.
Reference Pirozzoli, Bernardini and Orlandi2016). In rotating channel flow the correlations between scalar fluctuations and streamwise (respectively wall-normal) velocity fluctuations are weaker on the unstable (respectively stable) side. In the outer region of the unstable side the turbulent Prandtl number is considerably smaller, below 0.2 at higher
 $Ro$
, than in non-rotating channel flow. This implies that turbulent scalar transfer is very efficient on the unstable side of rotating channel flow compared to momentum transfer. Owing to rotation, the Nusselt number and the ratio of the Stanton number to skin friction both change, and the streamwise turbulent scalar flux is reduced on the unstable side, leading to a stronger alignment between the turbulent scalar flux vector and mean scalar gradient. One-dimensional spectra of the scalar variance and turbulent kinetic energy show that the scalar scales grow relatively to the turbulence scales in the outer region of the unstable side as a result of rotation, which is another sign of the growing dissimilarity between velocity and scalar field. Budgets of the governing equations for the scalar variance and streamwise and wall-normal turbulent scalar fluxes are presented and discussed. These show that the Coriolis terms in the scalar flux equations reduce the streamwise and wall-normal turbulent scalar flux on the unstable and stable side, respectively.
Further studies of scalars in rotating shear flows are motivated given the significant effect of rotation on turbulent scalar transport and the prevalence of mass and heat transfer in rotating turbulent flows in engineering applications. For example, it would be of interest to study the role of roll cells in scalar transport. However, modelling the effect of rotation on turbulent heat and mass transfer might pose a challenge since simple and convenient assumptions like the Reynolds analogy are not necessarily valid, as demonstrated by the present study.
Acknowledgements
SNIC is acknowledged for providing computational resources in Sweden. The author further acknowledges financial support from the Swedish Research Council (grant number 621-2016-03533).