





As life expectancy has increased, non-communicable diseases have become more prevalent, with some types of cancer emerging as one of the leading causes of death(Reference Vos, Lim and Abbafati1).
Even though certain contributing factors, such as genetics, are not modifiable, many lifestyle and environmental factors (such as diet) are and can significantly influence cancer risk. In fact, it has been estimated that 30 per cent of cancer cases could be preventable(2).
Diet is strongly related with adiposity through different mechanisms(Reference Avgerinos, Spyrou and Mantzoros3), including insulin resistance, alterations in the IGF-1 system, chronic low-grade inflammation and changes in the intestinal microbiome. Excess body weight, in turn, is a well-established risk factor for thirteen specific types of cancer, and it is well known that plant-based diet index (PDI) are associated with reduced risk of excess body weight(Reference Lauby-Secretan, Scoccianti and Loomis4). According to the International Agency for Research on Cancer, obesity is causally linked to the following obesity-related cancers: postmenopausal breast, uterus, ovary, colon and rectum, gastric cardia, oesophagus, pancreas, liver, biliary duct cancers, kidney, thyroid, meningioma and multiple myeloma(Reference Miki, Livingston and Karlsen5).
For ethical, environmental and health reasons, there has been a surge of interest in provegetarian or plant-based dietary patterns in the last decade(Reference Oncina-Cánovas, Torres-Collado and García-de-la-Hera6). These diets emphasise a higher intake of plant-derived foods while allowing the inclusion of some animal products in varying amounts(Reference Martínez-González, Sánchez-Tainta and Corella7). Nevertheless, a distinction between healthy and unhealthy plant-based foods is needed, as not all plant-based foods are inherently healthy. Based on the previous definition of provegetarian food pattern by Martínez-González et al.(Reference Satija, Bhupathiraju and Rimm8), Satija et al.(Reference Jafari, Hezaveh and Jalilpiran9) developed three different indices: the overall plant-based diet index (oPDI) and the healthful and unhealthful plant-based diet indexes (hPDI, uPDI).
Several potential health benefits have been associated with plant-based diets(Reference Satija, Bhupathiraju and Rimm8,Reference Chen, Zuurmond and Van Der Schaft10–Reference Gómez-Donoso, Martínez-González and Martínez12) , including the prevention of obesity(Reference Lauby-Secretan, Scoccianti and Loomis4), as well as the prevention and prognosis of specific types of cancer(Reference Hardt, Mahamat-Saleh and Aune13). However, their relationship with the overall burden of obesity-related cancers has not been yet explored. Addressing this gap is relevant given the rising incidence of these malignancies and the known associations between plant-based dietary patterns and healthy body weight. Therefore, our aim was to address whether the alignment with an overall, healthful or unhealthful plant-based diets is associated with the risk of obesity-related cancers in a prospective cohort.
Methods
Study population
This study included data from the ‘Seguimiento Universidad de Navarra’ Project, a prospective cohort composed of Spanish university graduates initiated in December 1999. Baseline and follow-up information are collected through postal or online questionnaires every two years. Details about the study design, recruitment, and follow-up methods are available elsewhere(Reference De La Fuente-Arrillaga, Carlos and Toledo14).
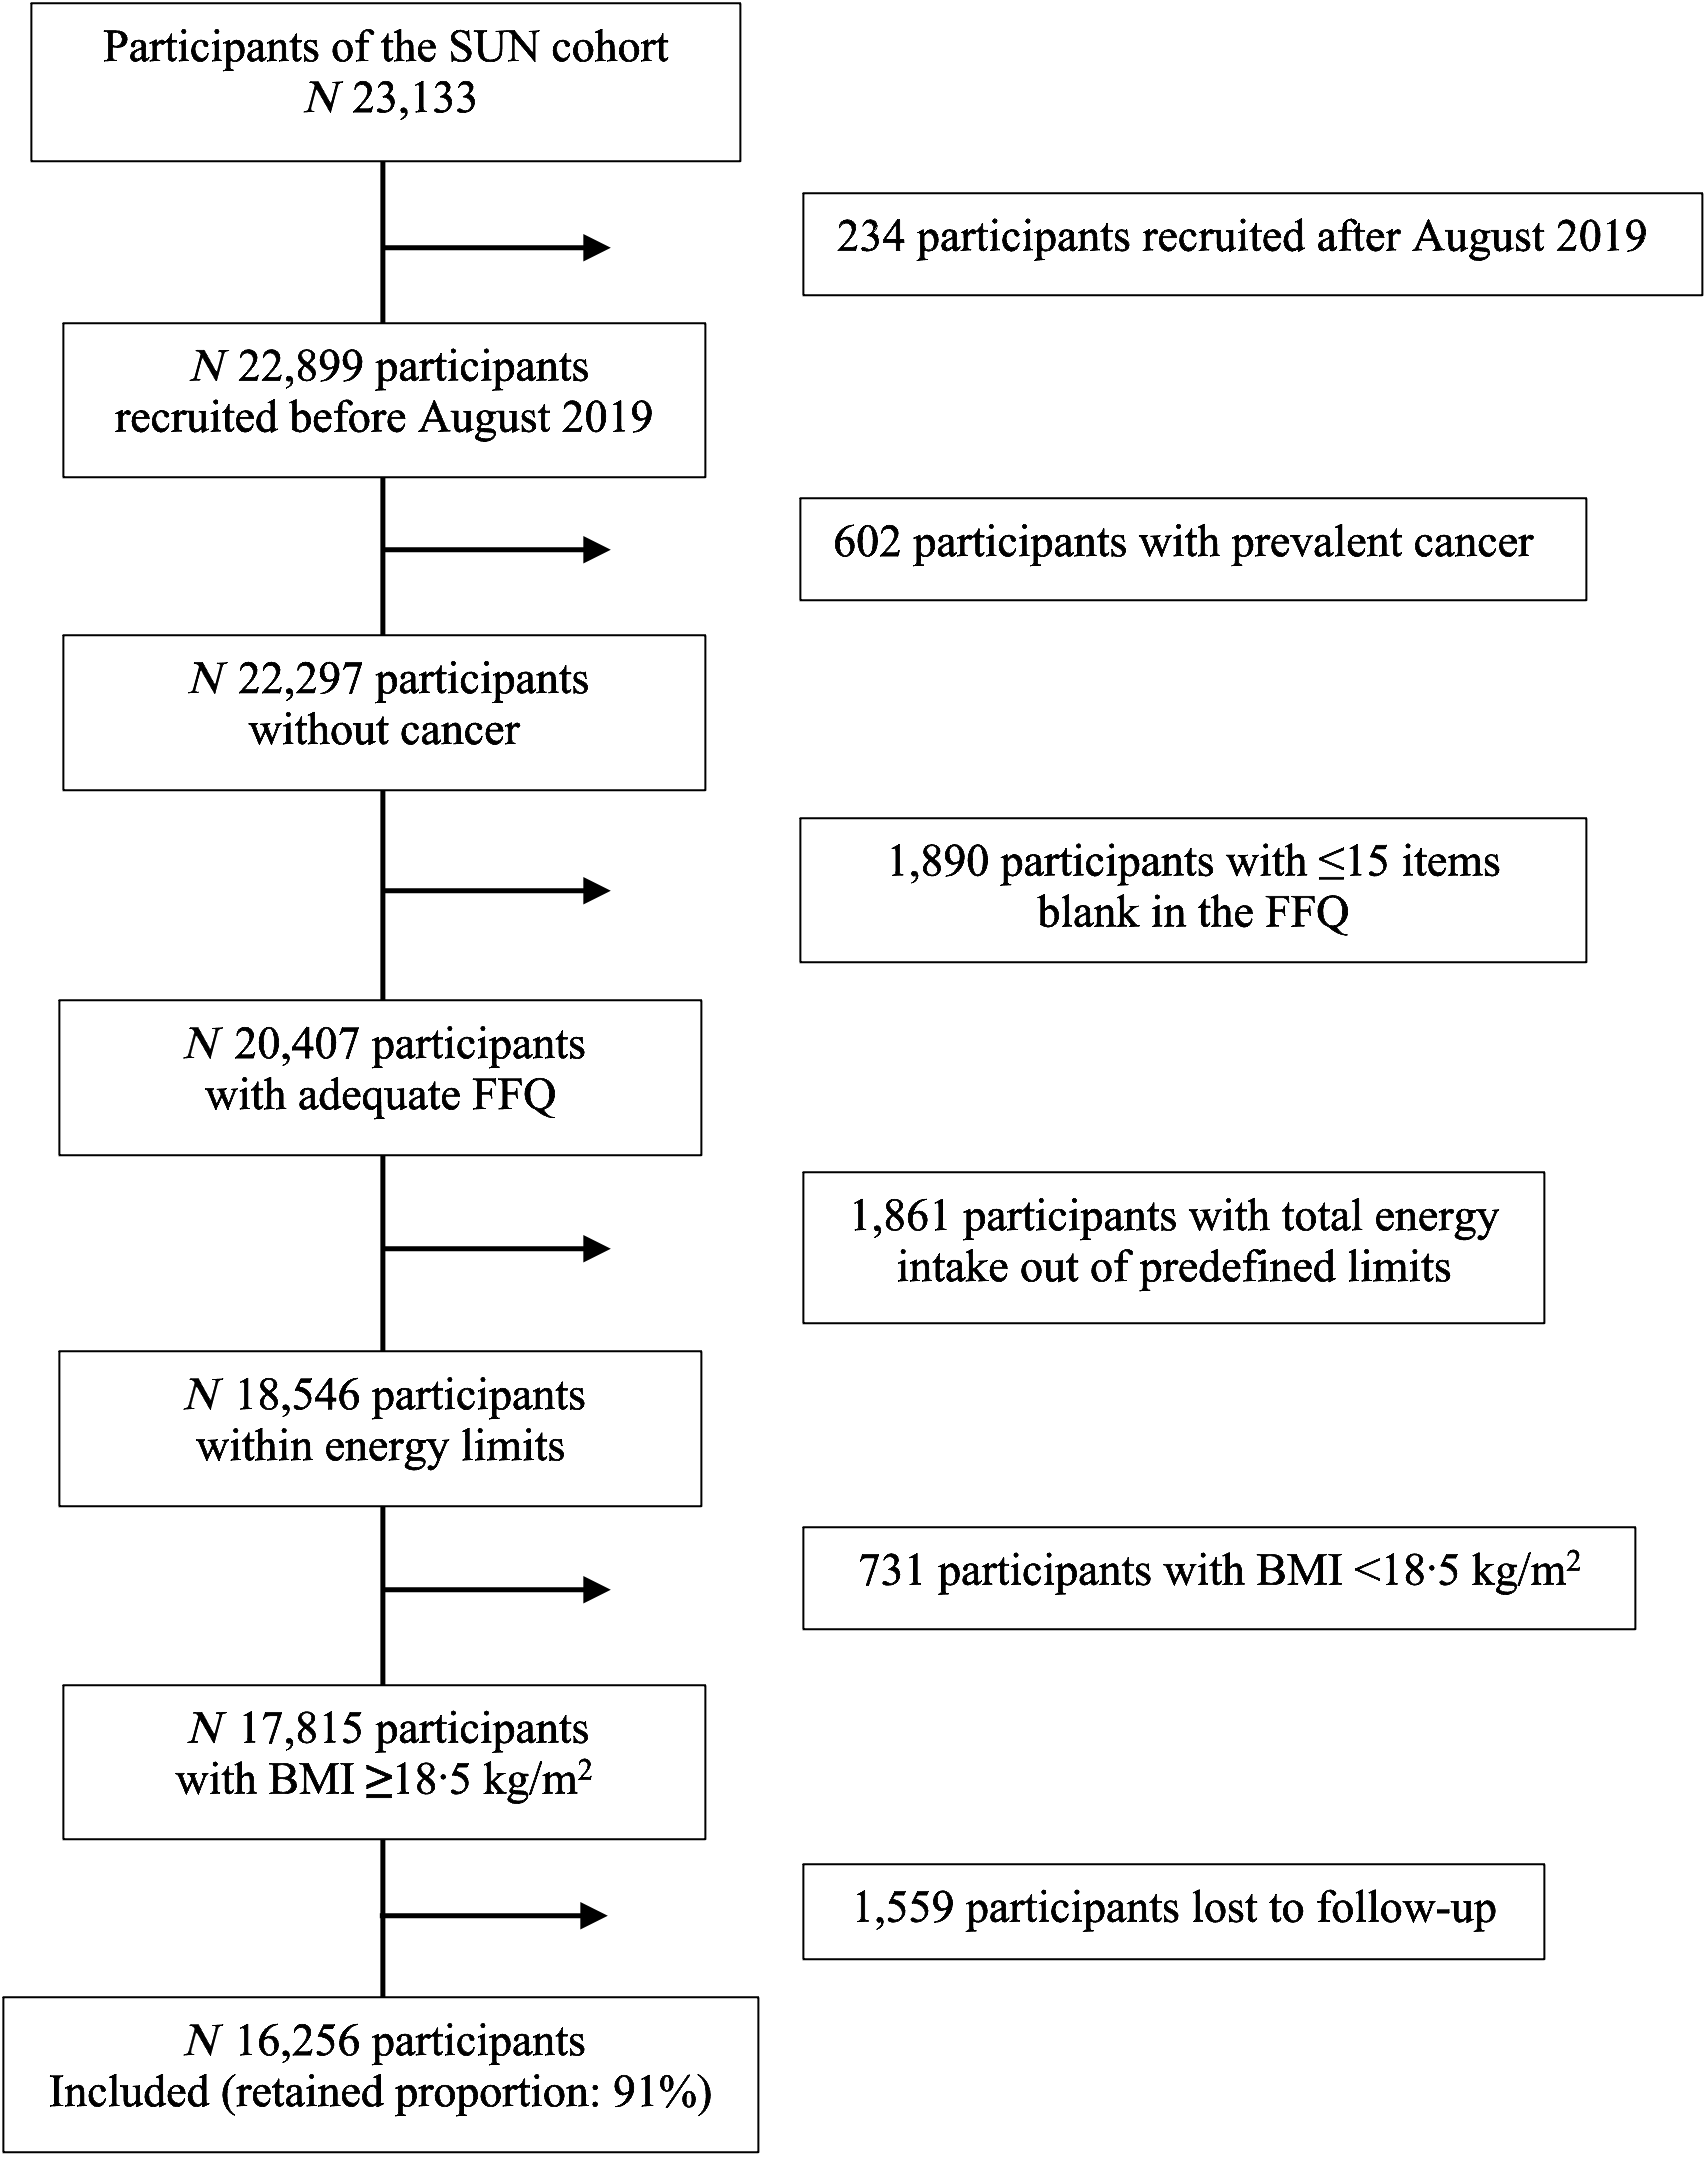
Up to May 2022, a total of 23 133 participants had answered the baseline questionnaire. Participants were enrolled between December 1999 and May 2022, and only those recruited by August 2019 or before, allowing at least 2 years and 9 months of follow-up, were included in the analyses (n 22 899). This gap of 2 years and 9 months was added to allow for a minimum follow-up of 2 years and to allow participants a sufficient time to return their questionnaires. The study end date was the diagnosis of the first cancer of interest, the date of death or completion of their last available questionnaire, whichever occurred first. The follow-up period in calendar years ranged from 1999 (earliest enrolled participant) to 2022. Participants with prevalent cancers (n 602), those who left ≥ 15 items blank in the FFQ (n 1890) or with implausible total energy intakes according to predefined limits(Reference Willet15) (men <800 or >4000 kcal/day; women <500 or >3500 kcal/day) (n 1861), participants with a BMI <18·5 kg/m2 (n 731) and those lost to follow-up (n 1559) were excluded. After exclusions, our final sample included 16 256 participants (Figure 1).
Flow chart of SUN participants. SUN, Seguimiento Universidad de Navarra.

As participants were provided with comprehensive information about the study, their voluntary completion of the self-administered baseline questionnaire was considered as implied informed consent. The study protocol was approved by the Ethics Committee of the University of Navarra.
Dietary assessment
Dietary data were obtained from a validated 136-item FFQ(Reference Martin-Moreno, Boyle and Gorgojo16,Reference Fernández-Ballart, Piñol and Zazpe17) . Participants were asked about their average total food consumption in the previous year using standard serving sizes. The frequency of consumption was measured in nine categories from ‘never/almost never’ to ‘>6 servings/day’. Daily intake in grams per day was calculated by multiplying the specified portion size for each food item by the frequency of consumption, and nutrient and energy intake were estimated using the Spanish food composition tables(Reference Mataix Verdú18,Reference Moreiras19) .
To evaluate the alignment with the PDI for the main analyses, we calculated an adapted oPDI score based on the methodology of Martínez-González et al.(Reference Satija, Bhupathiraju and Rimm8) Subsequently, Satija (9) adopted this score but added other food groups and similarly assessed the consumption of foods of plant origin rather than those of animal origin by quantifying the consumption (g/d) of ten plant food groups (fruits, vegetables, legumes, nuts, vegetable fat, grains, potatoes, sweets and desserts, sugar-sweetened beverages and coffee) and six animal food groups (meat and meat products, fish and seafood, eggs, dairy products, animal fats and miscellaneous foods). Table S1 shows the specific foods included in each food group. Certain adaptations were made compared with the original oPDI by Satija et al. For example, the ‘natural fruit juices’ component was combined with fruits (whereas Satija et al. considered fruit juices as a separate item within the plant food groups). In addition, whole grains and refined grains were collapsed into a single ‘grains’ component (Satija et al. kept them separate). These modifications resulted in a total of ten plant components, compared to twelve in Satija et al.’s original classification.
The sixteen food groups were divided into quintiles of consumption and a score between 1 and 5 was assigned to each quintile. For plant food groups, participants in the highest consumption quintile were assigned a score of 5, a score of 4 was assigned to participants in the second-highest quintile, decreasing incrementally to a score of 1 for intakes in the lowest quintile. The quintile values for animal food groups were reversed as follows: a value of 5 was assigned for the first quintile, 4 for the second quintile, and successively until the value of 1, which was assigned to the fifth quintile. To obtain the adapted oPDI score, quintile values of plant foods and reverse quintile values of animal foods were summed. Therefore, the final scores could theoretically range from 16 (lowest alignment) to 80 (highest alignment). The score was analysed as a continuous variable (per five-unit increment in the 16 to 80 range) and categorically by dividing participants into tertiles of alignment with the adapted oPDI.
In addition, we also developed a hPDI and uPDI scores, which we adapted from the original scores by Satija et al.(Reference Jafari, Hezaveh and Jalilpiran9) To create these scores, a difference was made between healthy plant-based foods (fruits, vegetables, legumes, whole grains, nuts, boiled or baked potatoes and vegetable oil and coffee) and less healthy plant-based foods (refined grains, French fries, sugar-sweetened beverages and sweets and desserts). These groups were created based on existing evidence of association between these foods and some diseases, such as type 2 diabetes, CVD and certain cancers or obesity(Reference Lauby-Secretan, Scoccianti and Loomis4,Reference Jafari, Hezaveh and Jalilpiran9,Reference Satija and Hu20) . Margarine was excluded from the indices due to changes in its fatty acid composition over time, from high trans-fat to predominantly unsaturated fat content. Nevertheless, it was included as a confounder in the statistical analysis as a dichotomous variable. Since margarine consumption was low in our cohort, we created a dichotomous variable indicating whether participants consumed margarine or not. Similar to the oPDI, we applied specific adaptations to the original hPDI and uPDI by Satija et al. consisting of combining ‘fruits’ and ‘natural fruit juices’ into a single component of the healthy plant food groups (Satija et al. kept them separate). Moreover, ‘potatoes’ were separated into ‘boiled or baked potatoes’ (healthy) and ‘French fries’ (less healthy), whereas Satija et al. classified all potatoes within a single, less healthy plant food component.
As with the adapted oPDI, consumption was also divided into quintiles for both the adapted hPDI and the adapted uPDI. In the adapted hPDI, healthy plant food groups received positive scores, whereas less healthy plant foods and animal foods received reverse scores. For the adapted uPDI, positive scores were assigned to less healthy plant food groups while healthy plant food groups and animal food groups were given reverse scores. Foods included in each food group and its scoring criteria can be found in detail in Table S2. To obtain the total scores of the adapted hPDI and the adapted uPDI the direct or reverse quintile values of the eighteen energy-adjusted food groups were summed. Final scores could, therefore, range from 18 (lowest possible score) to 90 (highest possible score). Analyses were made using the score as a continuous variable (per five-unit increment in the 18 to 90 range) and as a categorical variable by categorising participant into tertiles of alignment with the adapted hPDI and the adapted uPDI.
The indices were analysed as tertiles and adjusted for energy intake at the analysis stage.
Obesity-related cancers ascertainment
The following cancers were considered as obesity-related cancers: breast, uterus, ovary, colon and rectum, gastric cardia, oesophagus, pancreas, liver, biliary duct cancers, kidney, thyroid, meningioma and multiple myeloma(Reference Miki, Livingston and Karlsen5). Medical records were requested from participants who self-reported an obesity-related cancer diagnosis to confirm the diagnoses by a trained oncologist blinded to the exposure. Only primary obesity-related incident cancers were considered in the analyses. Participants were followed from baseline until the diagnosis of their first cancer of interest, the date of death, loss to follow-up, or the study end date (Sep 2022), whichever occurred first. Participants (n 70) who developed a different cancer than those of interest in the study were not censored at the time of that cancer not related to obesity, given that they were yet susceptible to develop an obesity-related cancer. The Spanish National Death Index was consulted to further confirm obesity-related cancer deaths or to obtain information about the vital status of cohort members who were lost to follow-up.
Statistical analysis
We used Cox proportional hazard regression models to calculate hazard ratios and 95 % CI for the association between alignment with the plant-based diets and the incidence of obesity-related cancers. For the main analyses, we used only the dietary data collected in the baseline questionnaire. Our models included age as the underlying time variable, and the first tertile (low consumption) was used as the reference. Besides, we performed additional time-dependent Cox proportional hazard models with repeated measures using dietary data after 10 years of follow-up to reduce the potential effects of dietary modifications during follow-up. In these time-dependent models, the exposures were calculated as the average of baseline and 10-year alignment with each pattern(Reference Vittinghoff, Glidden and Shiboski21). For participants without dietary data at 10 years, baseline information was carried forward. Proportionality of the hazards was assessed with the Schönfeld residuals test. The linear trend was assessed using the medians of the tertiles of each index as a continuous variable.
The multivariable model was additionally adjusted for the following potential confounders: sex; BMI (kg/m2, continuous and quadratic); smoking habit (never, current, former smoker); lifetime tobacco exposure (pack-years); family history of breast or colon cancer and obesity (yes or no); years of university education (years, continuous); alcohol intake (g/day, tertiles); total energy intake (kcal/ day, continuous); margarine consumption (yes or no); height(Reference Krieg, Roderburg and Krieg22) (cm, continuous); time spent watching television (hours/day, continuous); physical activity (METs-h/week, tertiles); prevalent diabetes (yes or no); having undergone colonoscopy and mammography (yes or no); followed a special diet (yes or no), marital status (married or not); weight gain in the last 5 years (yes or no); postmenopausal status (yes or no), snacking(Reference Bes-Rastrollo, Sanchez-Villegas and Basterra-Gortari23) (yes or no) (see Suppl. Mat for more information). To assess physical activity, we used a validated questionnaire(Reference Martínez-Gonzalez, Lopez-Fontana and Varo24) through which we estimated the metabolic equivalents (MET) of each participant to calculate the MET-hours per week.
Missing values in key covariates were addressed using simple imputation methods, based on information from the remaining independent variables in the dataset to predict and estimate the missing values with multivariable models(Reference Katz25). These imputations were applied prior to conducting Cox proportional hazards models.
In addition, we performed several sensitivity analyses in which we changed our inclusion and exclusion criteria to assess the robustness of our results: including participants with a BMI below 18·5 kg/m2, excluding those with a BMI below 22·5 kg/m2, excluding incident cases of obesity-related cancer diagnosed during the first 2 years of follow-up, and excluding participants followed up for more than 10 years lacking updated dietary information at 10 years to emphasise the most recent dietary assessment. We also ran sensitivity analyses alternatively defining acceptable limits for energy intake as the 1st and 99th percentiles and stratifying by smoking status (current smoker, former or never smoker) and sex. Moreover, analyses were performed without imputing missing values and using the original (not adapted) score by Satija et al (Reference Jafari, Hezaveh and Jalilpiran9). Finally, P values for interaction were calculated using likelihood ratio tests in multivariable–adjusted regression models comparing models with and without the interaction terms between alignment with the overall, healthful and unhealthful plant-based diets and smoking status and sex.
Statistical analyses were performed using Stata/SE (version 16.1).
Results
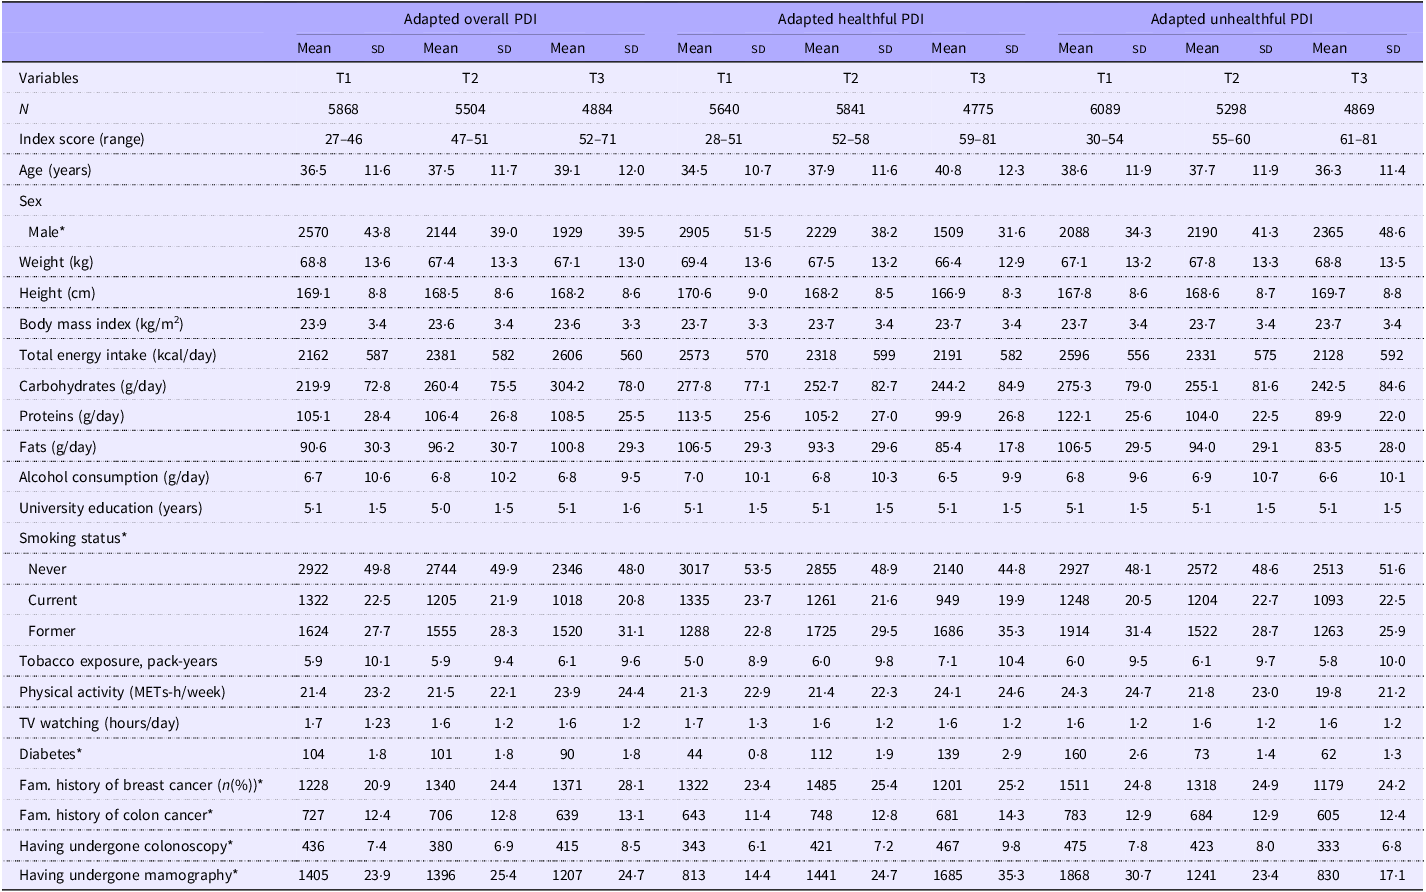
In this study, 16 256 participants (59 % females, mean age 38 years) were followed-up for a median time of 13 years. Baseline characteristics of the participants are described in Table 1. Compared to participants in the first tertile, those in the third tertile of the adapted oPDI and the adapted hPDI were more likely to be older, female and more physically active. Conversely, those with higher scores in the adapted uPDI were more likely to be younger, male, have a higher caloric intake and be less physically active.
Baseline characteristics of participants according to tertiles of adapted overall, healthful and unhealthful plant-based diet index scores in the ‘Seguimiento Universidad de Navarra’ (SUN) cohort (n 16 256)

Table 1. Long description
The table presents baseline characteristics of participants according to tertiles of adapted overall, healthful, and unhealthful plant-based diet index (PDI) scores in the SUN cohort. It includes data for three tertiles (T1, T2, T3) for each type of PDI. The table has 27 rows and 18 columns, with column headers including variables such as age, sex, weight, height, body mass index, total energy intake, carbohydrates, proteins, fats, alcohol consumption, university education, smoking status, physical activity, TV watching, diabetes, family history of breast and colon cancer, and having undergone colonoscopy or mammography. Each row provides mean values and standard deviations for these variables across the tertiles. Notable trends include variations in age, sex distribution, physical activity levels, and dietary intake across the tertiles of different PDI scores.
PDI, plant-based diet index; MET, metabolic equivalent of task; TV, television.
* n and %.
Over the 210 621 person-years of follow-up, 221 cases of obesity-related cancer were confirmed, including colon and rectum (n 64), breast (n 54), pancreas (n 26), thyroid (n 24), kidney (n 15), biliary duct cancers (n 11), uterus (n 9), ovary (n 9), meningioma (n 1), multiple myeloma (n 4), oesophagus (n 4), liver (n 3) and gastric cardia (n 1). Four of our participants had more than one cancer of interest during the follow-up period.
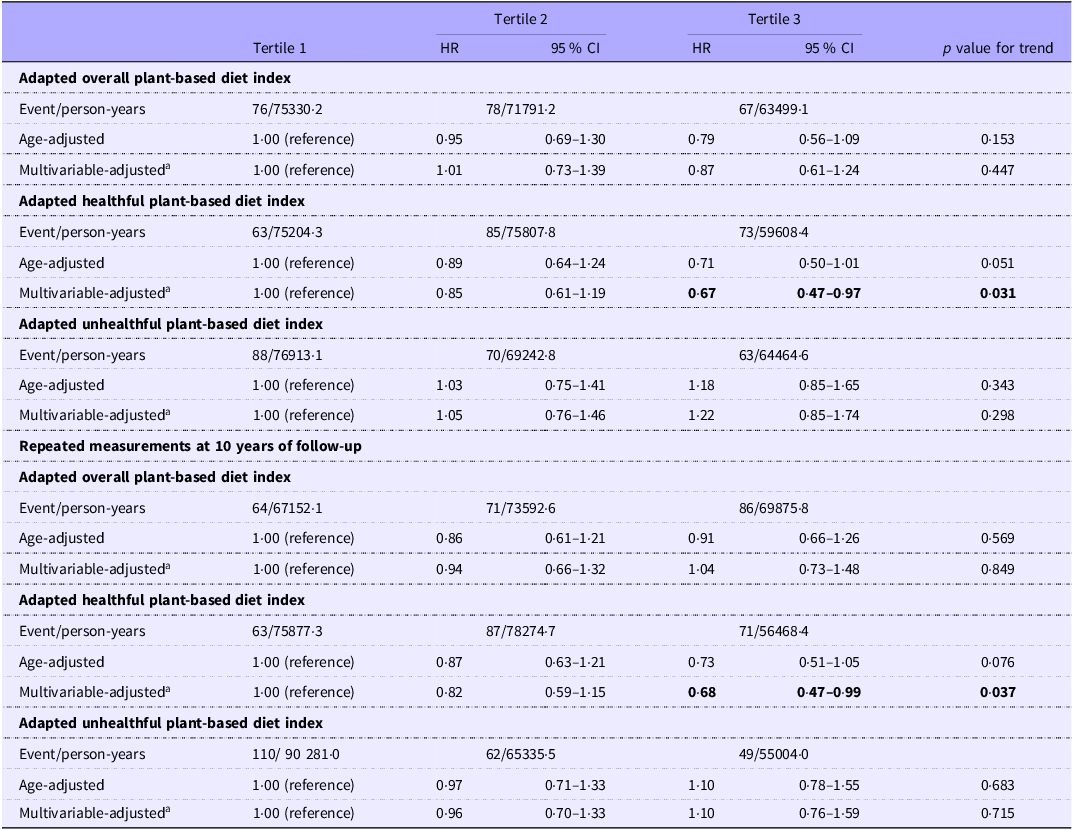
The associations between the different adapted PDI (tertiles) and the risk of obesity-related cancers are shown in Table 2. In the fully adjusted models, we found a significant inverse association between alignment with the adapted hPDI and the risk of obesity-related cancers when comparing the extreme tertiles at baseline (HRT3vsT1 0·67; 95 % CI, 0·47, 0·97; P trend = 0·031) and after repeated measurements of diet were considered (HRT3vsT1 0·68; 95 % CI, 0·47, 0·99; P trend = 0·037).
Hazard ratios (95 % CI) of obesity-related cancers according to baseline and 10-year follow-up tertiles of the adapted overall, healthful and unhealthful plant-based diet index scores (categorised) in the SUN cohort

Table 2. Long description
A table comparing hazard ratios of obesity-related cancers according to baseline and 10-year follow-up tertiles of adapted overall, healthful, and unhealthful plant-based diet index scores. The table has 12 rows and 7 columns. Column headers are Tertile 1, Tertile 2 HR, Tertile 2 95% CI, Tertile 3 HR, Tertile 3 95% CI, and p value for trend. Row labels include Adapted overall plant-based diet index, Adapted healthful plant-based diet index, Adapted unhealthful plant-based diet index, and Repeated measurements at 10 years of follow-up. Each row provides event/person-years, age-adjusted, and multivariable-adjusted hazard ratios and confidence intervals for each tertile. Notable trends include significant inverse associations between the adapted healthful plant-based diet index and the risk of obesity-related cancers in the fully adjusted models.
a Multivariable-adjusted for: sex; BMI (kg/m2, continuous and quadratic); smoking habit (never, current, former smoker); lifetime tobacco exposure (pack-years); family history of breast or colon cancer and obesity (yes or no); years of university education (years, continuous); alcohol intake (g/day, tertiles); total energy intake (kcal/ day, continuous); margarine consumption (yes or no); height (cm, continuous); time spent watching television (hours/day, continuous) and doing physical activity (MET-h/week, tertiles); prevalent diabetes (yes or no); having undergone colonoscopy and mammography (yes or no); followed a special diet (yes or no), marital status (married or not); weight gain in the last 5 years (yes or no); postmenopausal status (yes or no), snacking (yes or no).
No significant associations were observed between the adapted oPDI or the adapted uPDI and the risk of obesity-related cancers for both baseline and updated dietary information.
When the adapted indices were analysed as continuous variables, no significant associations were observed for any of them, either at baseline or with update after 10 years of follow-up (Table S3).
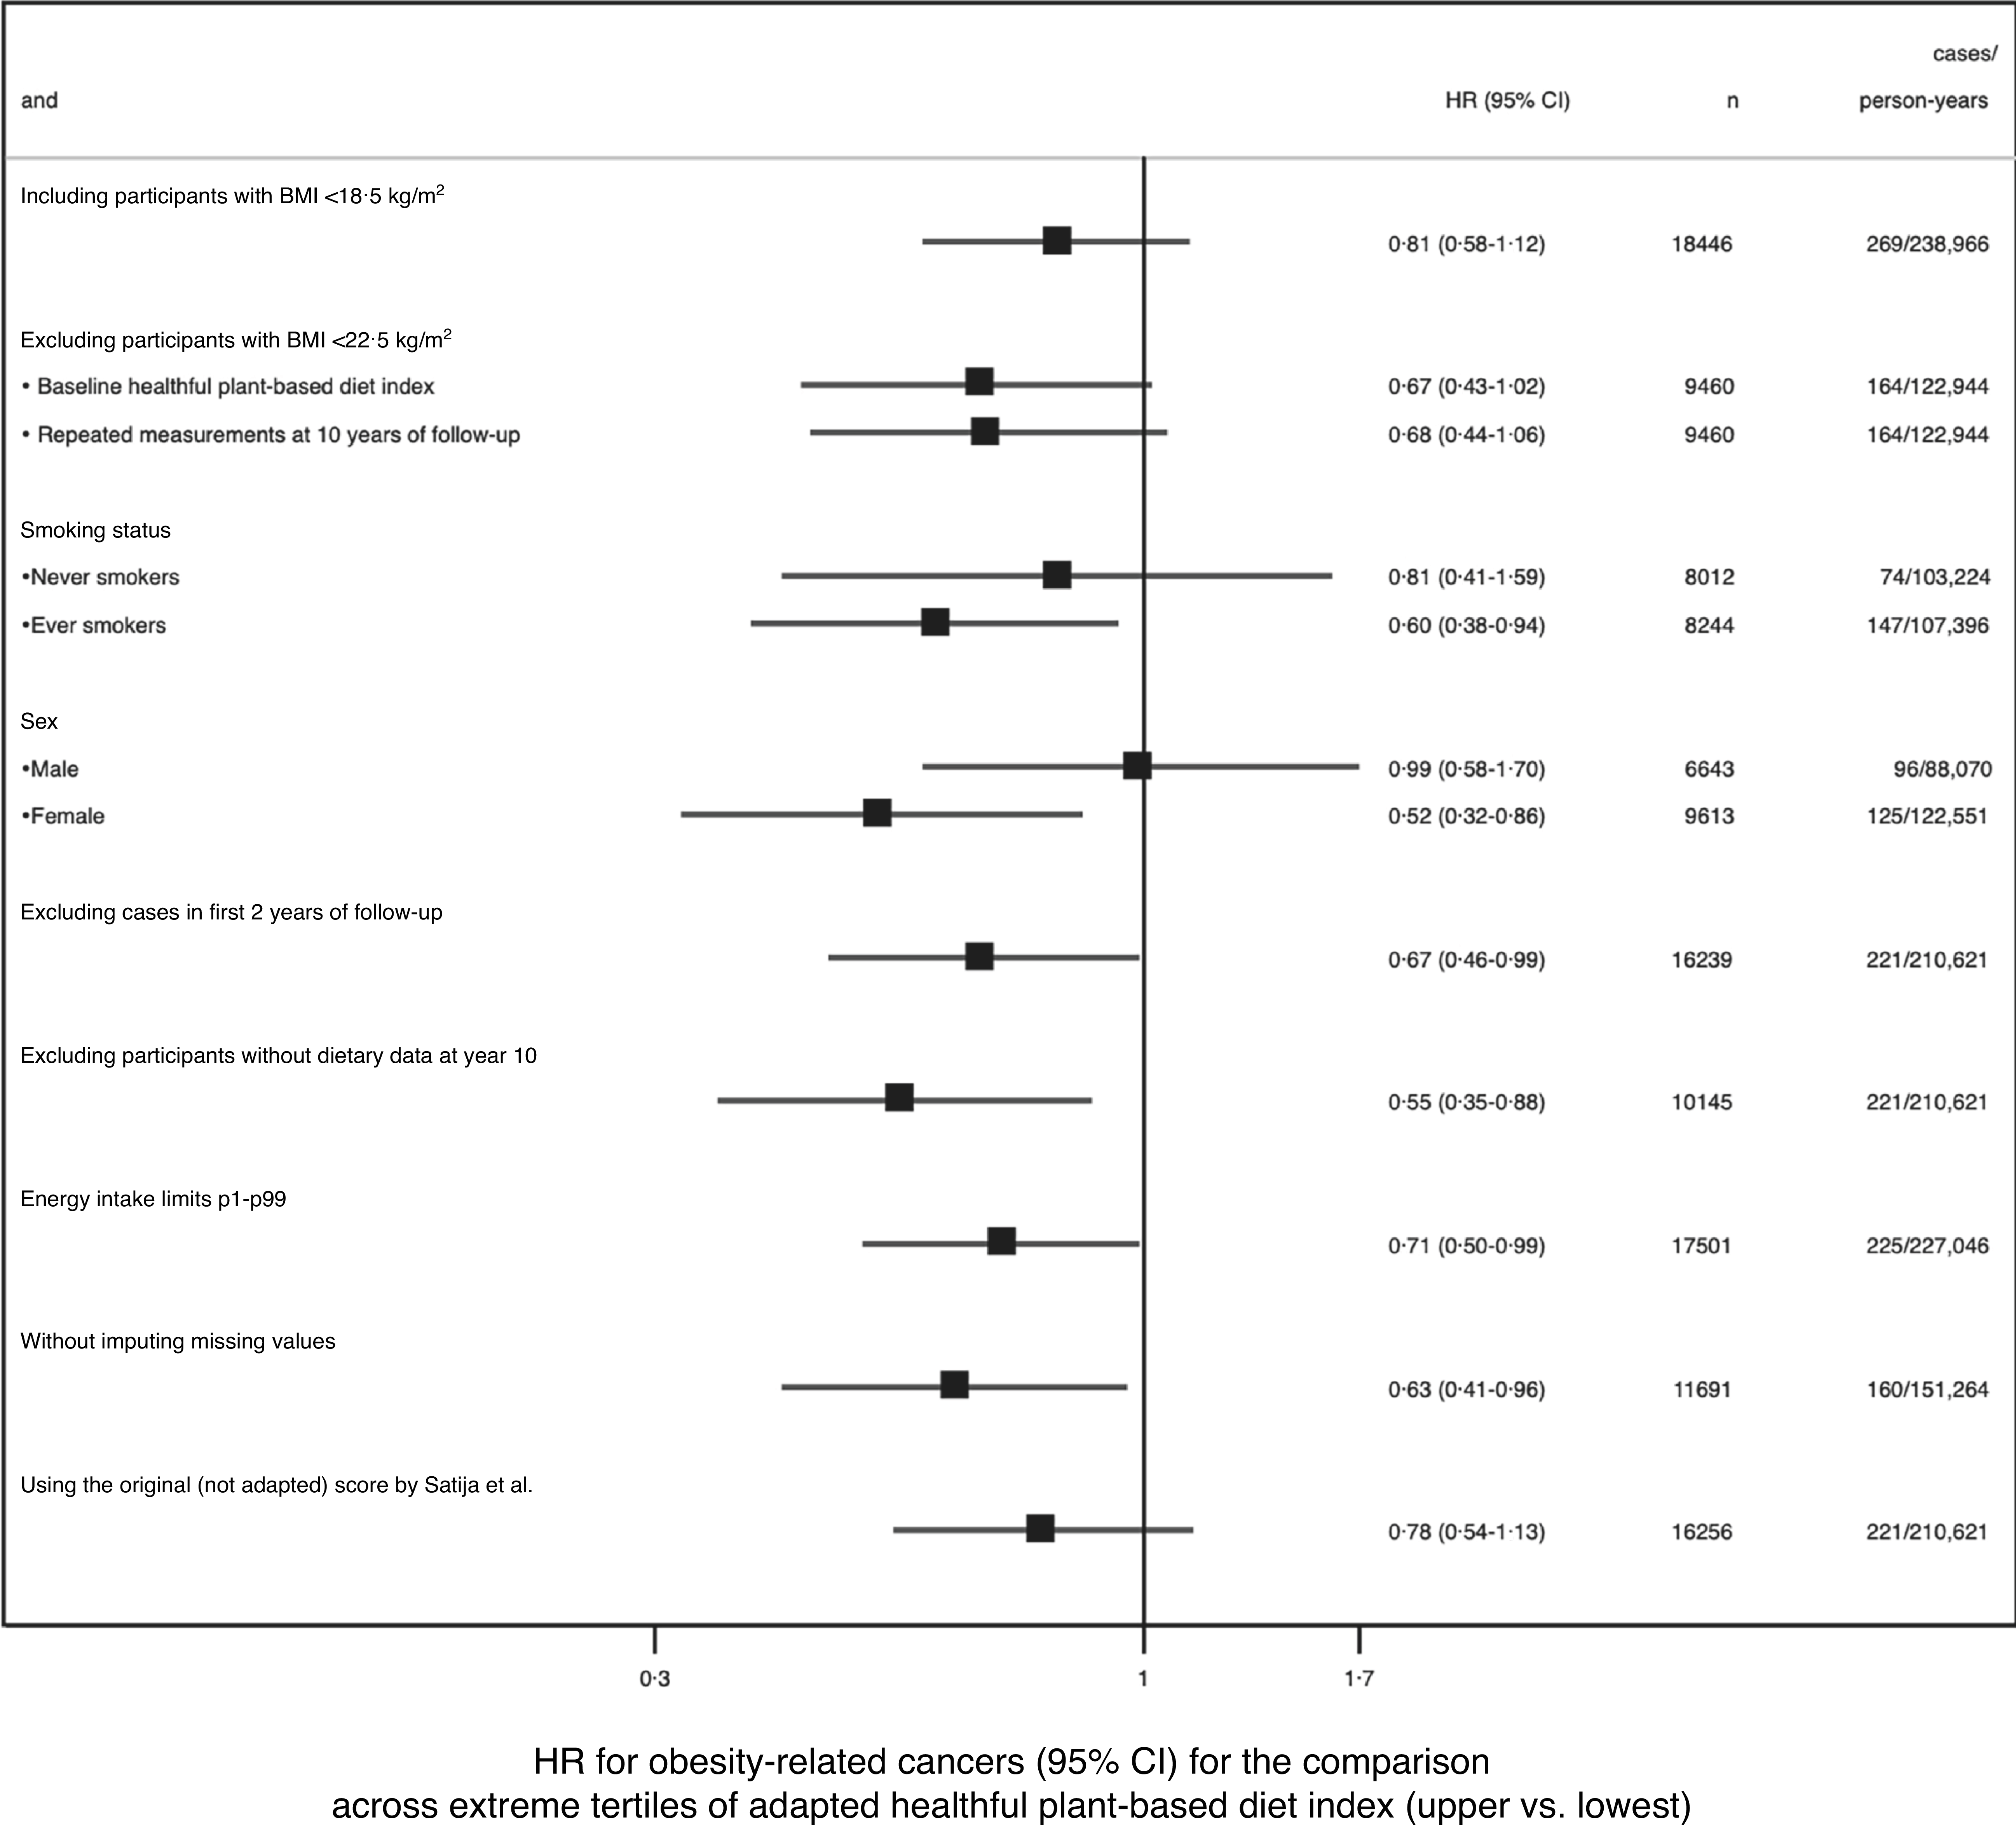
Finally, we also performed sensitivity analyses changing our inclusion and exclusion criteria to evaluate the robustness of our results across different scenarios. The inverse association between alignment with the adapted hPDI and the risk of obesity-related cancers became stronger for participants who had ever smoked when analyses were stratified by smoking habit (HRT3vsT1 0·60; 95 % CI, 0·38, 0·94; p interaction = 0·46), and for women when analyses were stratified by sex (HRT3vsT1 0·52; 95 % CI, 0·32, 0·86; p interaction = 0·04) (Figure 2). In contrast, no significant association with obesity-related cancers was observed among never smokers (HRT3vsT1 0·81; 95 % CI, 0·41, 1·59) or among men (HRT3vsT1 0·99; 95 % CI, 0·58, 1·70), for whom the estimates were closer to the null. Similar associations to the main analysis were observed after excluding participants diagnosed with obesity-related cancers within the first 2 years of follow-up (HRT3vsT1 0·67; 95 % CI, 0·46, 0·99) and when we included only those participants who had completed the 10-year FFQ in the analyses with updated dietary information (HRT3vsT1 0·55; 95 % CI, 0·35, 0·88). Moreover, when analyses were performed without imputing missing data, the inverse association was slightly stronger (HRT3vsT1 0·63; 95 % CI, 0·41, 0·96).
Sensitivity analyses for the association between the highest and the lowest tertiles of alignment with the adapted hPDI and the risk of obesity-related cancers in the SUN Project. Multivariable adjusted for: sex; BMI (kg/m2, continuous and quadratic); smoking habit (never, current, former smoker); lifetime tobacco exposure (pack-years); family history of breast or colon cancer and obesity (yes or no); years of university education (years, continuous); alcohol intake (g/day, tertiles); total energy intake (kcal/ day, continuous); margarine consumption (yes or no); height (cm, continuous); time spent watching television (hours/day, continuous) and doing physical activity (MET-h/week, tertiles); prevalent diabetes (yes or no); having undergone colonoscopy and mammography (yes or no); followed a special diet (yes or no), marital status (married or not); weight gain in the last 5 years (yes or no); postmenopausal status (yes or no), snacking (yes or no). hPDI, healthful plant-based diet index; P, percentile; SUN, Seguimiento Universidad de Navarra.

Figure 2. Long description
Panel A: A forest plot showing hazard ratios (H R) for obesity-related cancers across extreme tertiles of the adapted unhealthy plant-based diet index. The horizontal axis represents the hazard ratio (H R) ranging from 0.6 to 2.5, and the vertical axis lists different participant groups and conditions. Each square represents the hazard ratio for a specific group, with horizontal lines indicating the 95 percent confidence interval (C I). The plot includes various groups such as participants with different B M I ranges, smoking status, sex, and other dietary and health conditions. Panel B: The plot shows the hazard ratios for different participant groups, with some groups having higher hazard ratios than others. For example, never smokers have a higher hazard ratio compared to ever smokers. Similarly, females have a higher hazard ratio compared to males. The plot also shows the impact of excluding certain participants or cases, such as those with dietary data at year 10 or those in the first 2 years of follow-up. The overall trend indicates that certain dietary and health conditions are associated with a higher risk of obesity-related cancers.
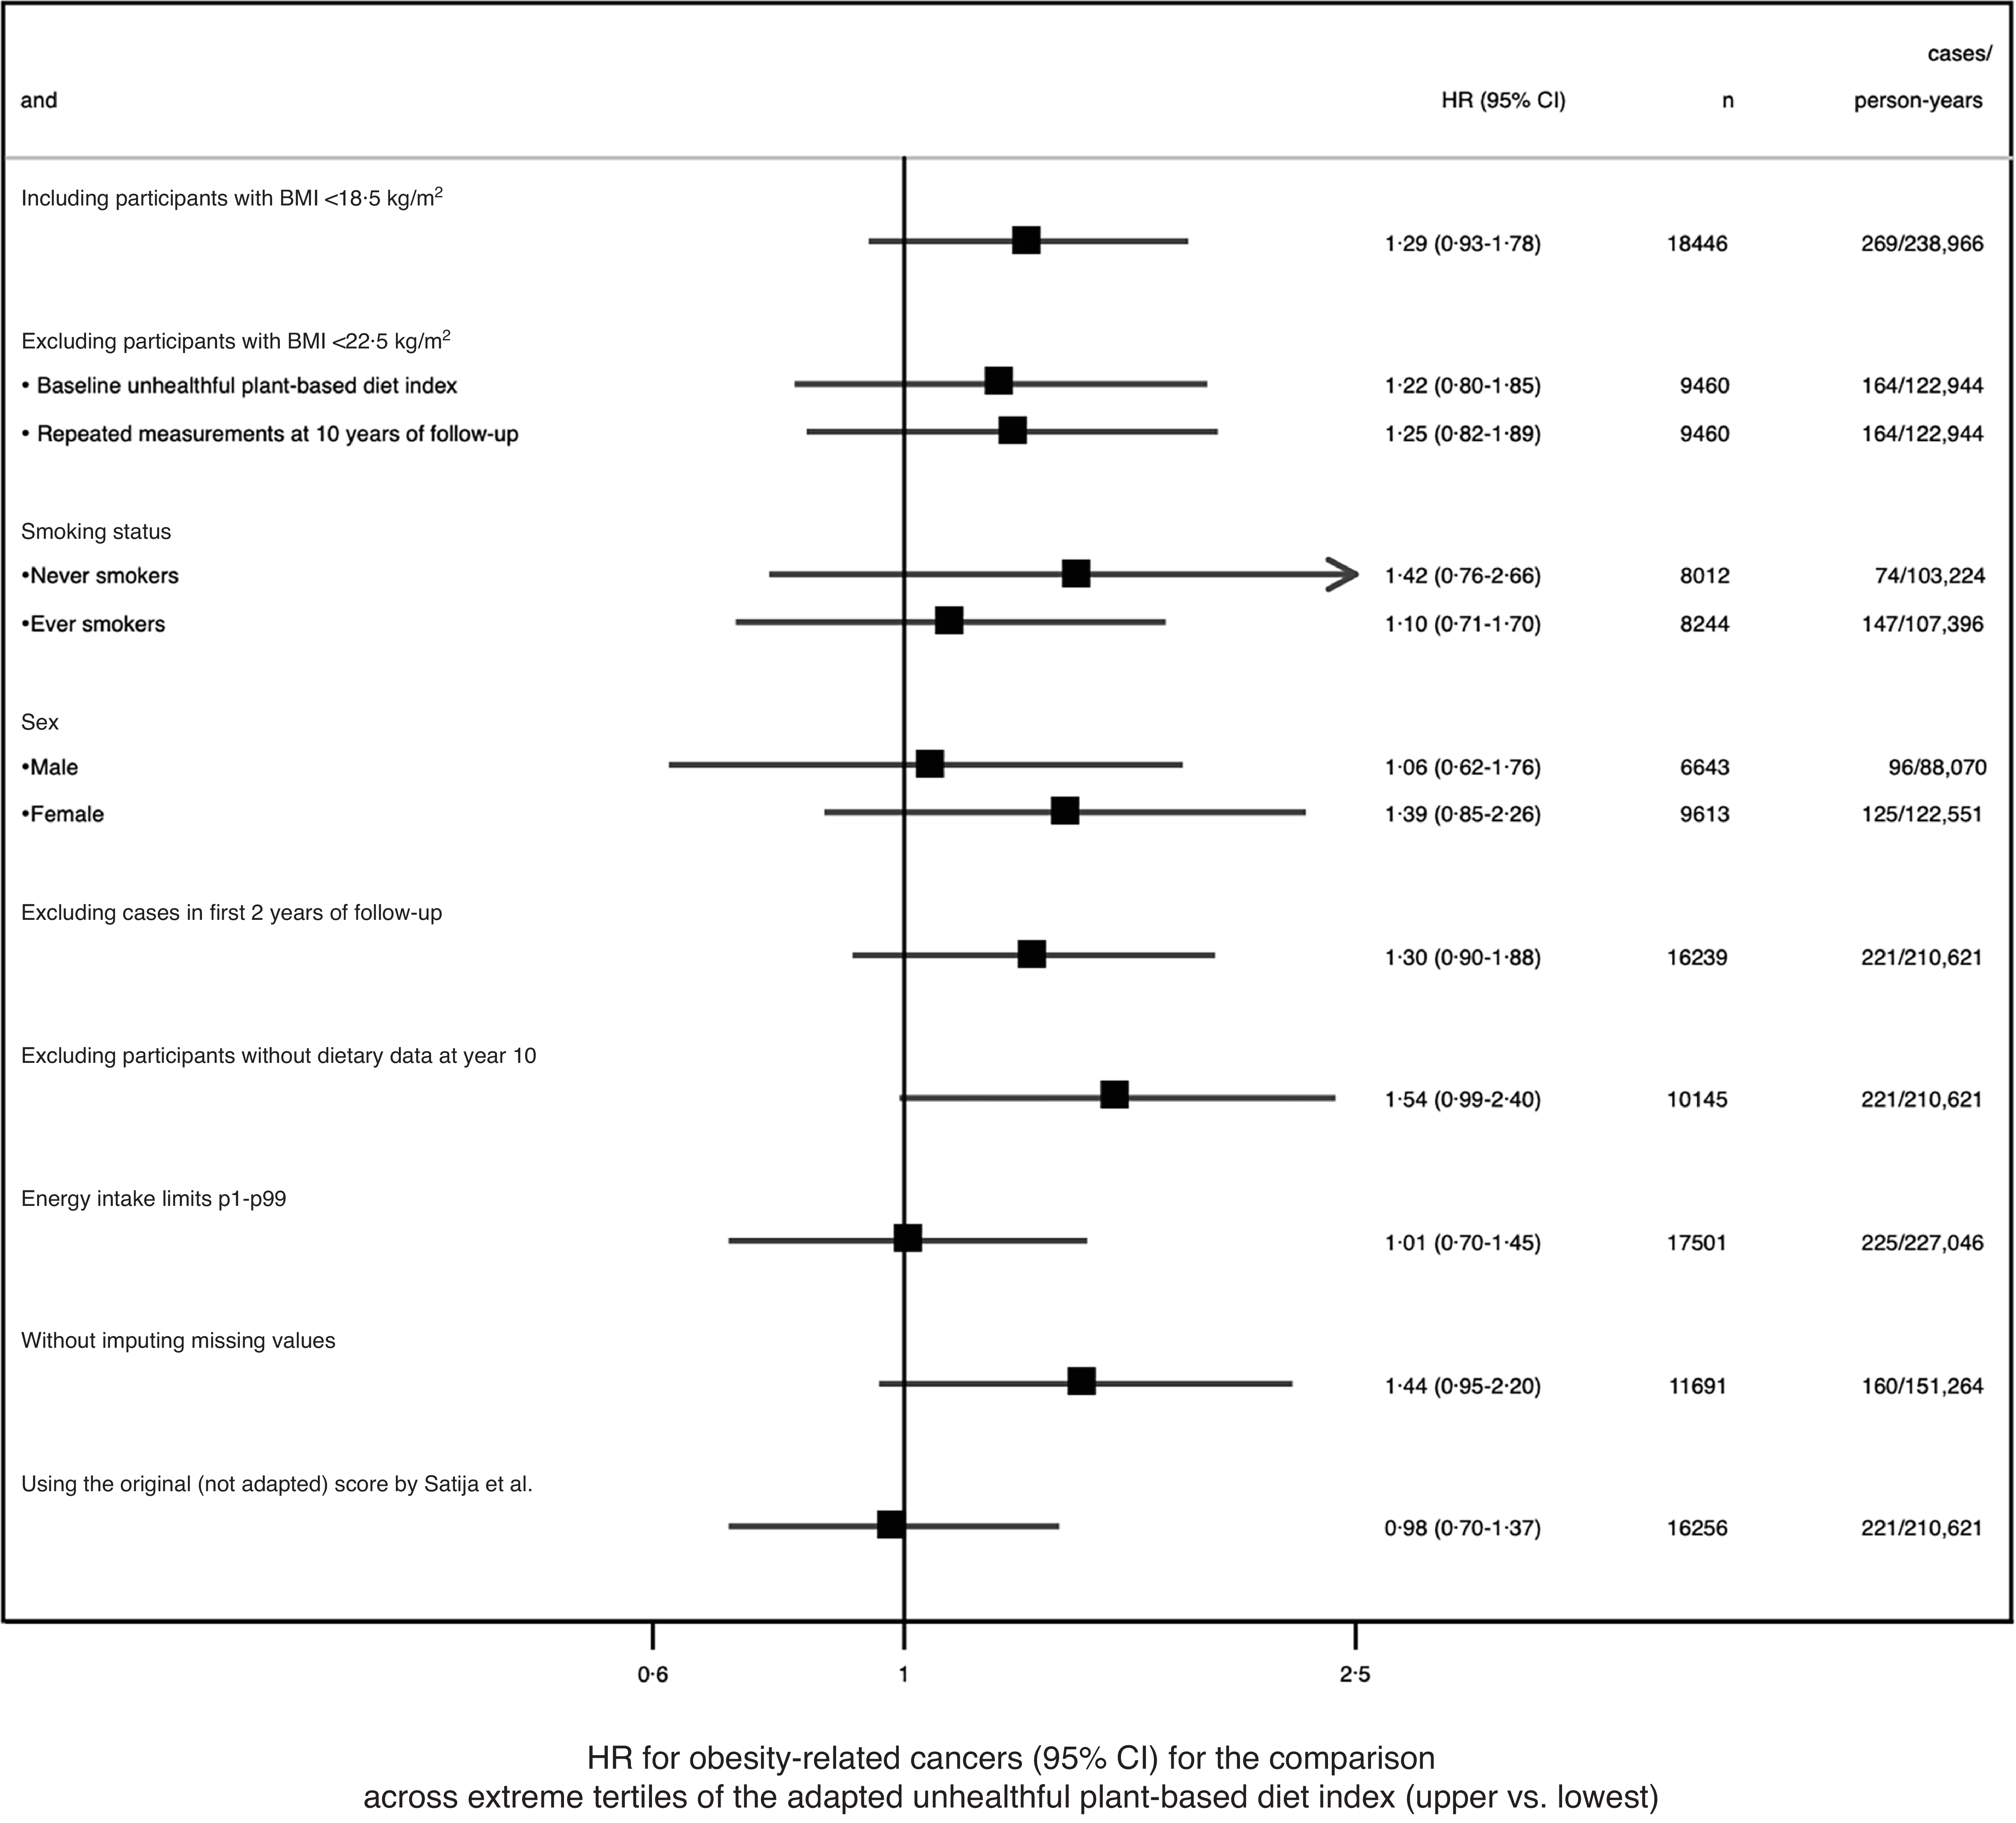
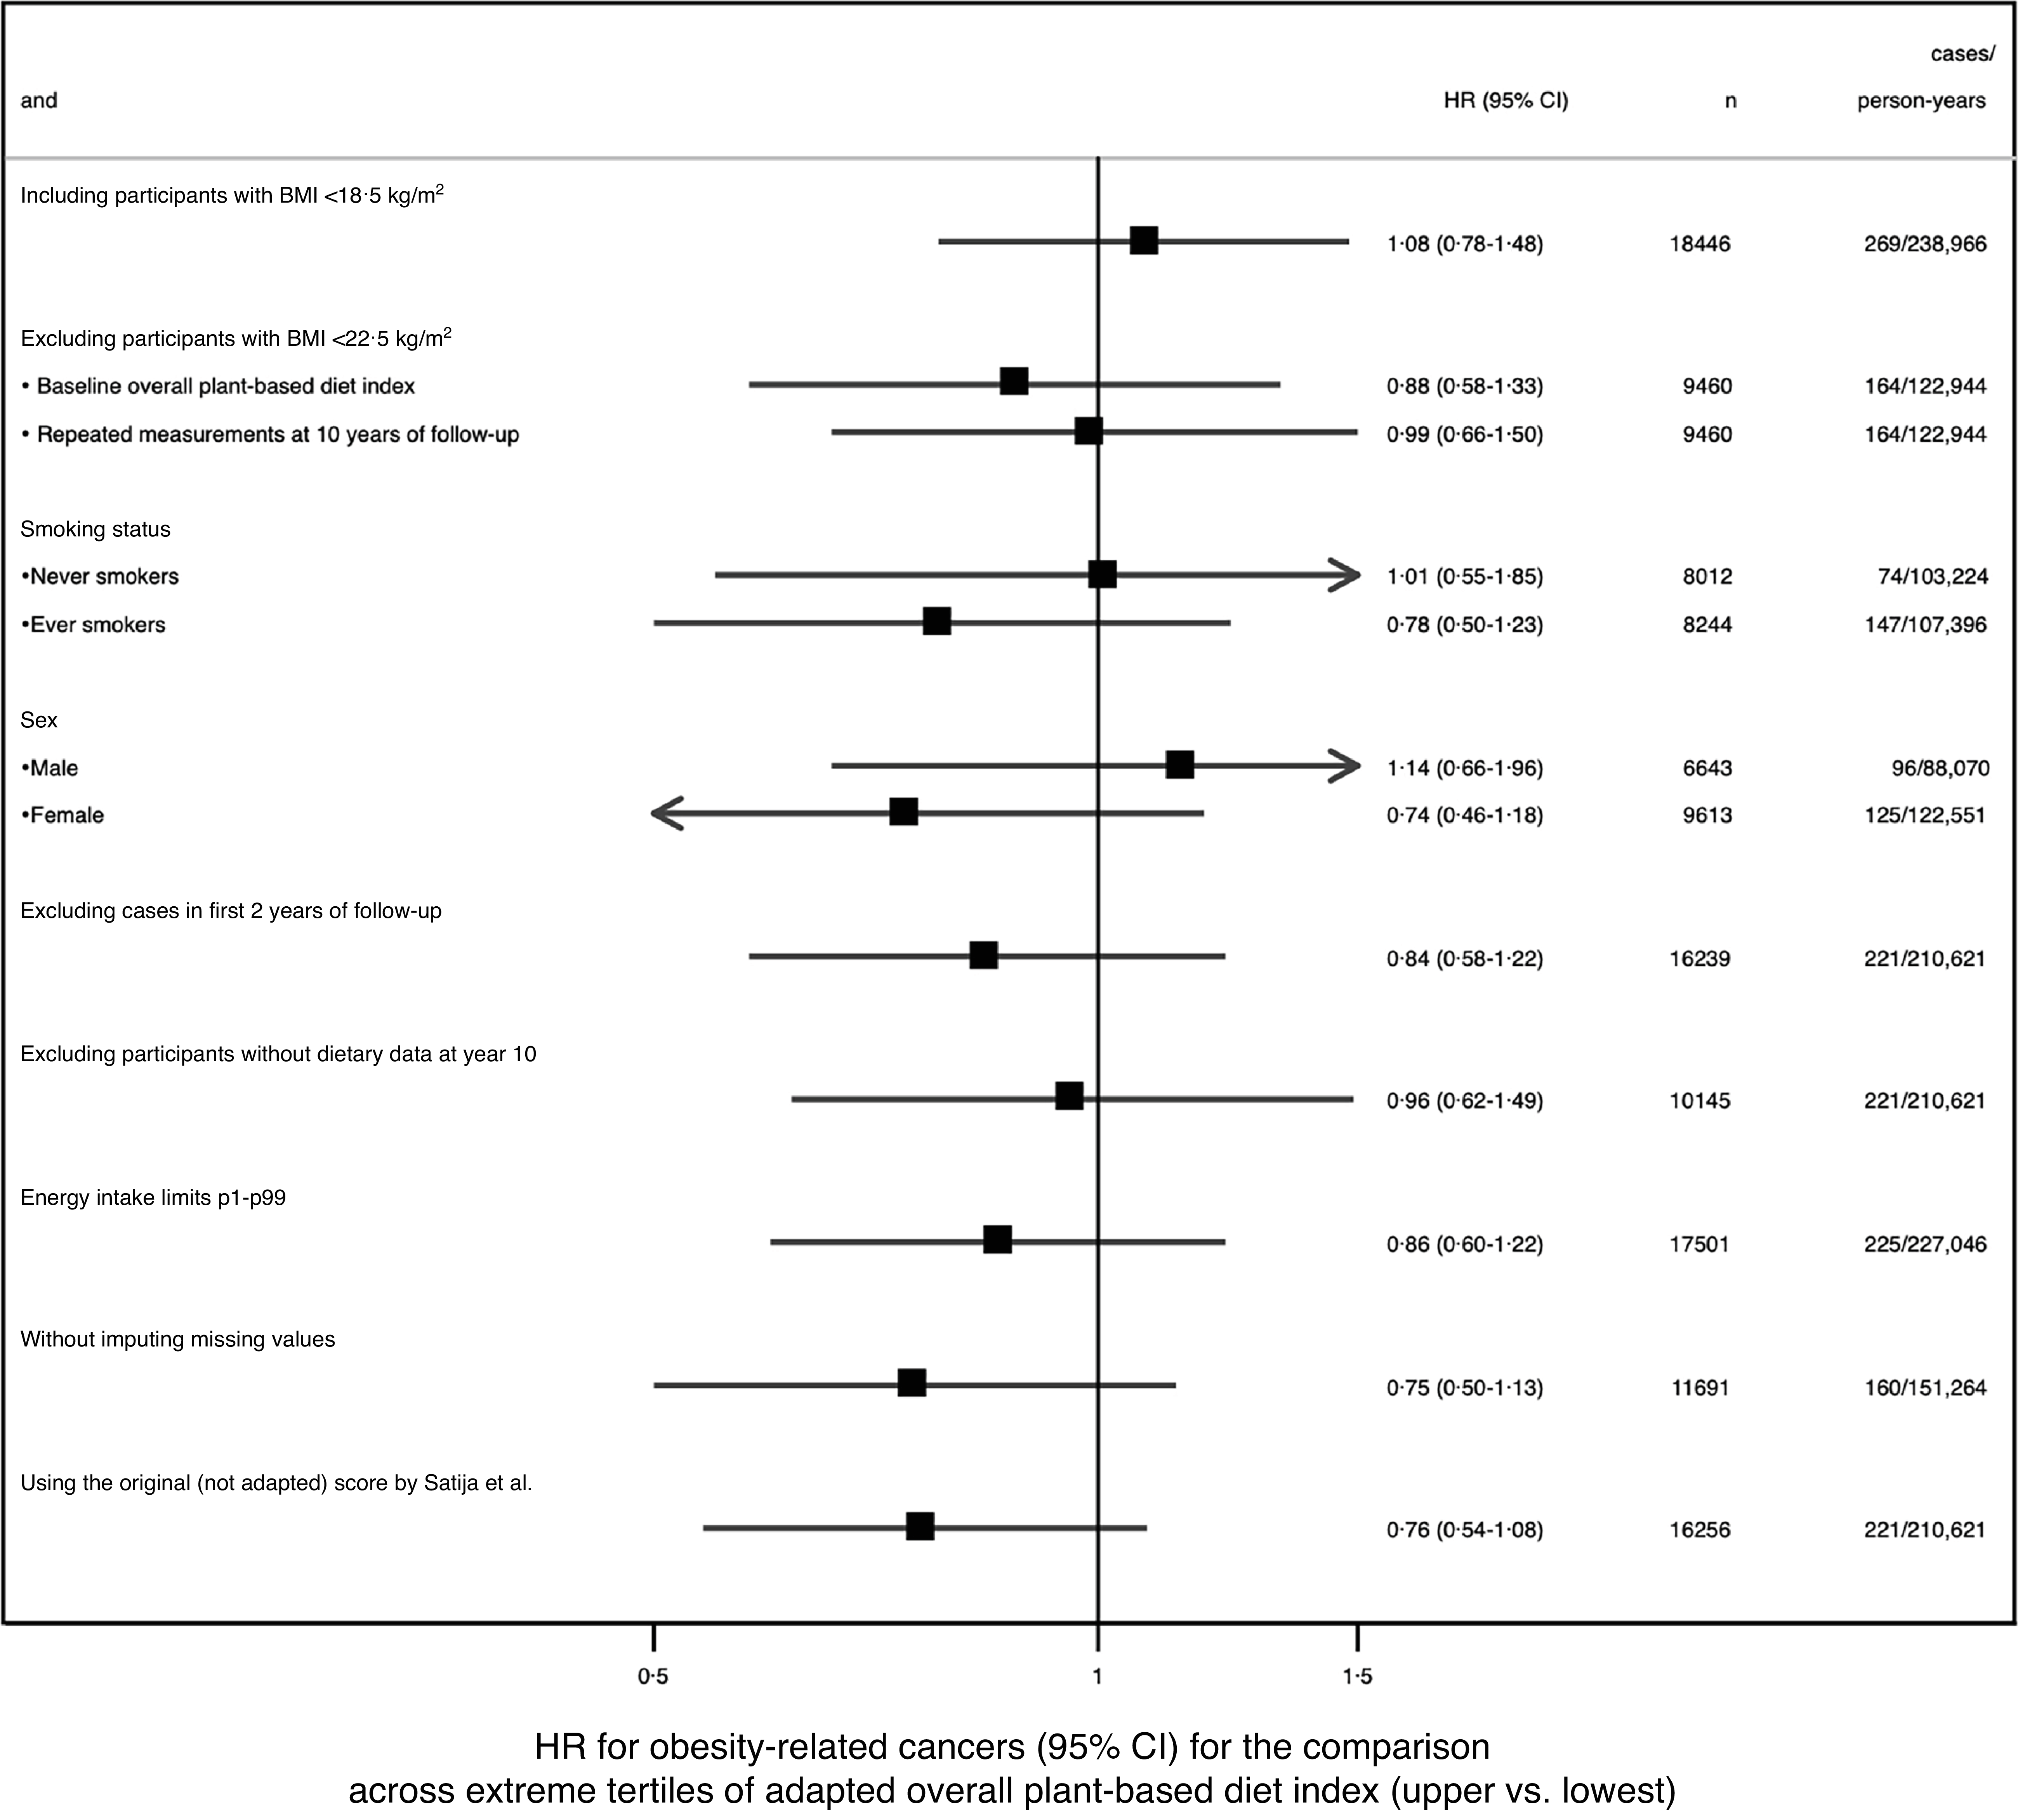
In sensitivity analyses, results barely changed for the adapted oPDI and the adapted uPDI (Figures 3 and 4), and no significant interactions were observed for either index.
Sensitivity analyses for the association between the highest and the lowest tertile of alignment with the adapted oPDI and the risk of obesity-related cancers in the SUN Project. Multivariable adjusted for: sex; BMI (kg/m2, continuous and quadratic); smoking habit (never, current and former smoker); lifetime tobacco exposure (pack-years); family history of breast or colon cancer and obesity (yes or no); years of university education (years, continuous); alcohol intake (g/day, tertiles); total energy intake (kcal/ day, continuous); margarine consumption (yes or no); height (cm, continuous); time spent watching television (hours/day, continuous) and doing physical activity (MET-h/week, tertiles); prevalent diabetes (yes or no); having undergone colonoscopy and mammography (yes or no); followed a special diet (yes or no), marital status (married or not); weight gain in the last 5 years (yes or no); postmenopausal status (yes or no), snacking (yes or no). oPVG, overall plant-based diet index; P, percentile; SUN, Seguimiento Universidad de Navarra.

Sensitivity analyses for the association between the highest and the lowest tertile of alignment with the adapted uPDI and the risk of obesity-related cancers in the SUN Project. Multivariable adjusted for: sex; BMI (kg/m2, continuous and quadratic); smoking habit (never, current, former smoker); lifetime tobacco exposure (pack-years); family history of breast or colon cancer and obesity (yes or no); years of university education (years, continuous); alcohol intake (g/day, tertiles); total energy intake (kcal/ day, continuous); margarine consumption (yes or no); height (cm, continuous); time spent watching television (hours/day, continuous) and doing physical activity (MET-h/week, tertiles); prevalent diabetes (yes or no); having undergone colonoscopy and mammography (yes or no); followed a special diet (yes or no), marital status (married or not); weight gain in the last 5 years (yes or no); postmenopausal status (yes or no), snacking (yes or no). P, percentile; SUN, Seguimiento Universidad de Navarra; uPDI: unhealthful plant-based diet index.

Figure 4. Long description
Panel A: A bar graph showing the hazard ratios for obesity-related cancers for participants with body mass index less than 18.5 kg per square meter. The horizontal axis represents the hazard ratio with a range from 0.3 to 1.7, and the vertical axis represents different participant groups. The graph shows a hazard ratio of 0.81 with a confidence interval of 0.58 to 1.12 for 18446 cases over 238966 person-years. Panel B: A bar graph showing the hazard ratios for participants excluding those with body mass index greater than 22.5 kg per square meter. The horizontal axis represents the hazard ratio with a range from 0.3 to 1.7, and the vertical axis represents different participant groups. The graph shows hazard ratios of 0.67 and 0.68 with confidence intervals of 0.43 to 1.02 and 0.44 to 1.06 for 9460 cases over 122944 person-years. Panel C: A bar graph showing the hazard ratios for never smokers and ever smokers. The horizontal axis represents the hazard ratio with a range from 0.3 to 1.7, and the vertical axis represents different participant groups. The graph shows hazard ratios of 0.81 and 0.60 with confidence intervals of 0.41 to 1.59 and 0.38 to 0.94 for 8012 and 8244 cases over 103224 and 107396 person-years, respectively. Panel D: A bar graph showing the hazard ratios for male and female participants. The horizontal axis represents the hazard ratio with a range from 0.3 to 1.7, and the vertical axis represents different participant groups. The graph shows hazard ratios of 0.99 and 0.52 with confidence intervals of 0.58 to 1.70 and 0.32 to 0.86 for 6643 and 9613 cases over 88070 and 122551 person-years, respectively. Panel E: A bar graph showing the hazard ratios excluding cases in the first 2 years of follow-up. The horizontal axis represents the hazard ratio with a range from 0.3 to 1.7, and the vertical axis represents different participant groups. The graph shows a hazard ratio of 0.67 with a confidence interval of 0.46 to 0.99 for 16239 cases over 210621 person-years. Panel F: A bar graph showing the hazard ratios excluding participants without dietary data at year 10. The horizontal axis represents the hazard ratio with a range from 0.3 to 1.7, and the vertical axis represents different participant groups. The graph shows a hazard ratio of 0.55 with a confidence interval of 0.35 to 0.88 for 10145 cases over 210621 person-years. Panel G: A bar graph showing the hazard ratios with energy intake limits from percentile 1 to 99. The horizontal axis represents the hazard ratio with a range from 0.3 to 1.7, and the vertical axis represents different participant groups. The graph shows a hazard ratio of 0.71 with a confidence interval of 0.50 to 0.99 for 17501 cases over 227046 person-years. Panel H: A bar graph showing the hazard ratios without imputing missing values. The horizontal axis represents the hazard ratio with a range from 0.3 to 1.7, and the vertical axis represents different participant groups. The graph shows a hazard ratio of 0.63 with a confidence interval of 0.41 to 0.96 for 11691 cases over 151264 person-years. Panel I: A bar graph showing the hazard ratios using the original score by Satija et al. The horizontal axis represents the hazard ratio with a range from 0.3 to 1.7, and the vertical axis represents different participant groups. The graph shows a hazard ratio of 0.78 with a confidence interval of 0.54 to 1.13 for 16256 cases over 210621 person-years.
Discussion
In this Mediterranean cohort, higher alignment with the adapted hPDI was associated with a lower risk of obesity-related cancers, especially for women, while the adapted oPDI and the adapted uPDI showed no significant association. These results were consistent in sensitivity analyses.
Examining dietary patterns, such as the plant based ones, offers a comprehensive approach to assessing the relationship between dietary habits and the risk of chronic diseases.
Case–control studies assessing colorectal and breast cancers reported protective associations with greater alignment with the hPDI and oPDI and higher risk for the uPDI(Reference Rigi, Mousavi and Benisi-Kohansal27,Reference Wu, Zhou and Ou28) . These discrepancies relative to our findings may reflect methodological differences, including the case–control design, outcome definition the younger age of our cohort and the healthy lifestyles of our highly educated participants. All of them are likely to be associated with reduced incidence. However, cohort studies provide additional insights into these associations. The Nutri-Santé cohort reported a lower overall cancer risk associated with an oPDI but found no significant associations specifically for breast cancer(Reference Kane-Diallo, Srour and Sellem29). As for pancreatic cancer, in a large cohort framed in a Cancer Screening Trial, significant inverse associations were observed for the alignment with the oPDI and hPDI(Reference Zhong, Li and You30), while a direct association was observed for the uPDI. Significant differences in age, education level and number of cases are observed between these cohorts and ours, which may influence the results.
Some previous studies have assessed the association between the alignment with the different plant-based diets and risk of cancer at any site, although evidence is not conclusive.
According to a recent meta-analysis on this topic, the overall and healthful plant-based diets were inversely associated with the overall cancer risk, while the unhealthful plant-based diet was directly associated with the overall cancer risk(Reference Wang, Liu and Sun31). In contrast, findings from a Italian cohort showed no significant associations between either the hPDI or the uPDI and overall cancer risk(Reference Martínez, Di Castelnuovo and Costanzo32). These discrepancies across studies highlight the importance of conducting additional well-designed prospective research, as such designs are more practical and informative for evaluating long-term outcomes such as cancer.
Regarding the stronger inverse association observed in women from our cohort, similar sex-specific differences have been reported, although mainly for specific cancers such as those of the digestive system(Reference Kim, Khil and Kim33), suggesting that the impact of plant-based dietary patterns on cancer risk may vary by sex, likely due to factors such as oestrogen exposure and other sex-linked mechanisms involving inflammation, apoptosis and microbiota regulation(Reference Heo, Kim and Sung34).
Although macronutrient content and energy density are important, plant-based foods offer additional benefits worth exploring, such as their nutritional adequacy. Healthful plant-based diets emphasise minimally processed plant-foods, healthy fats and whole grains – primary sources of micronutrients, antioxidants, phenolic compounds and fibre(Reference Kent, Kehoe and Flynn35,Reference Rana, Samtiya and Tejpal36) . These components may help lower blood pressure and improve glycaemic control, lipid profile and gut microbiome health(Reference Satija and Hu20). Their diverse micronutrient and phytochemical profile potentially support anti-inflammatory and antioxidant processes that may offer metabolic protection against cancer(2,Reference Subramaniam, Selvaduray and Radhakrishnan37,Reference Hever and Cronise38) . In contrast, unhealthy plant-based diets contain fewer of these protective compounds, limiting their potential benefits(Reference Hemler and Hu39).
Many food products available today meet the plant-based criteria but are not necessarily healthful as industrial processing often results in formulations with high energy density, but low nutritional value(Reference Asfura-Carrasco, Santiago and Zazpe40,Reference Gehring, Touvier and Baudry41) . Such formulations may reduce the potential benefits of plant-based diets and contribute to a nutritionally inadequacy, promoting low-grade inflammation and insulin resistance – potential mechanisms linking plant-based diets to cancer(Reference Avgerinos, Spyrou and Mantzoros3,Reference Brown and Scherer42) . Additionally, processing techniques, such as extrusion or extensive mechanical breakdown, can modify digestion and absorption, potentially increasing energy availability and may promote the formation of heat-induced compounds (e.g. Maillard reaction products, acrylamide) with documented adverse effects(Reference Rifai and Saleh43,Reference Huang, Liu and Ma44) .
Strengths of this study include its dynamic prospective design, large sample size, long follow-up, validated tools, high retention rate (91 %), and repeated dietary assessments. Residual confounding was minimised by adjusting for numerous potential confounders. Additionally, misclassification bias was reduced through blind cancer case verification by an oncologist and confirmation of fatal cases through the Spanish National Death Index.
However, we also acknowledge some limitations. First, the use of self-administered questionnaires may lead to misclassification, although we used a validated FFQ(Reference Martin-Moreno, Boyle and Gorgojo16), confirmed all cancer cases and included only university graduates may enhance the accuracy of the self-reported information while helping to control for socio-economic confounding. Second, despite adjusting for several potential confounders, residual confounding cannot completely be ruled out due to our observational design. Third, family history was only available for breast and colorectal cancer but not for other malignant cancers. Fourth, our participants may not represent the general Spanish population. However, extrapolation of the results on measures of association should rely on the biological and contextual determinants of effect modification rather than sample representativeness per se(Reference Lash, VanderWeele, Haneuse and Rothman45). Fifth, the overall healthy lifestyle and relatively young age of our highly educated participants may have contributed to the low number of cancer cases, which is likely associated with reduced incidence, thereby limiting the statistical power and the precision of the hazard ratio estimates. Finally, the use of adapted PDI scores may have influenced the observed associations and should be considered when interpreting the results.
This study suggests that alignment with an adapted healthful plant-based diet may decrease the risk of obesity-related cancers, with a stronger effect in women, underscoring the importance of prioritising the consumption of high-quality plant foods. To our knowledge, no other published papers to date have assessed the relationship between plant-based dietary patterns and all obesity-related cancers combined. Therefore, our findings provide new evidence, opening broader perspectives on the potential role of plant-based diets in cancer prevention.
Given the ongoing scientific debate on this topic, further prospective studies are needed to confirm our findings. From a public health perspective, individuals reducing animal food consumption should be encouraged to prioritise healthy plant-based choices.
Supplementary material
To view supplementary material for this article, please visit https://doi.org/10.1017/S0007114526107570.
Data availability statement
Data described in the manuscript, code book and analytic code will be made available upon request pending.
Acknowledgements
We thank all the members of the group, all the participants in the SUN cohort for their continued and enthusiastic collaboration and to our advisors and collaborators at Harvard University (TH Chan School of Public Health) Walter Willett, Alberto Ascherio, Frank B. Hu and Meir J. Stampfer.
The SUN Project has received funding from the Spanish Government-Instituto de Salud Carlos III, the European Regional Development Fund (FEDER) (RD 06/0045, CIBER-OBN, Grants PI10/02658, PI10/02293, PI13/00615, PI14/01668, PI14/01798, PI14/01764, PI17/01795, PI20/00564, PI23/01332, PI24/01723, G03/140), the Navarra Regional Government (27/2011, 45/2011, 122/2014), National Drug Plan (2020/021, 2023/19) and the University of Navarra. No funders had a role in the design, analysis or writing of this article.
The authors’ responsibilities were as follows: María José Cobo: Data curation, Formal analysis, Investigation, Methodology, Resources, Software, Validation, Visualisation, Writing – original draft. Andrea Romanos-Nanclares: Data curation, Writing – review & editing. María Olmedo: Data Curation, Writing –review & editing. Nerea Martín-Calvo: Writing – review & editing. Miguel Ángel Martínez-González: Data curation, Funding acquisition, Investigation, Methodology, Project administration, Resources, Writing – review & editing. Maira Bes-Rastrollo: Data curation, Funding Acquisition, Investigation, Methodology, Project administration, Resources, Writing – review & editing. Estefanía Toledo: Conceptualisation, Data curation, Formal analysis, Investigation, Methodology, Resources, Software, Supervision, Validation, Visualisation, Writing – review & editing.
The authors declare none.


 Open access

