Introduction
Interferons (IFNs) are multifunctional cytokines that play important roles in the defense against viral or parasitic infections. They also exhibit anti-proliferative and pro-differentiation activities, which prompted an evaluation of their potential as antitumor agents (Samuel, Reference Samuel2001; Afonso et al., Reference Afonso, Campbell, Iwama, Devlin and Donaldson1997). The pleiotropic effects of IFNs are mediated by various IFN-inducible transmembrane proteins (IFITMs) that are encoded by IFN-stimulated genes (ISGs) (Lewin et al., Reference Lewin, Reid, McMahon, Stark and Kerr1991).
Members of the IFITM family have been isolated in a number of mammalian species. In humans, IFITM genes were originally identified in neuroblastoma cells by their differential response to stimulation by interferon (Friedman et al., Reference Friedman, Manly, McMahon, Kerr and Stark1984). IFITMs belong to the CD225 superfamily, which is characterized by two highly conserved transmembrane regions, a highly conserved intracellular region, and termini with a high degrees of variance (Tanaka & Matsui, Reference Tanaka and Matsui2002). The family consists of five genes (ifitm1, ifitm2, ifitm3, ifitm5 and ifitm10), all of which are located on chromosome 11, and these genes encode proteins 125 to 133 amino acids in length that contain two transmembrane domains (Lewin et al., Reference Lewin, Reid, McMahon, Stark and Kerr1991). IFITM1, which is expressed by leukocytes and endothelial cells, has anti-proliferative effects and promotes homotypic cell adhesion. IFITM3 also inhibits cell proliferation, while the roles of ifitm5 and ifitm10 in humans are not well defined (Deblandre et al., Reference Deblandre, Marinx, Evans, Majjaj, Leo, Caput, Huez and Wathelet1995; Brem et al., Reference Brem, Oraszlan-Szovik, Foser, Bohrmann and Certa2003).
In mice, the ifitm gene family has also been characterized. The first murine ifitm gene (ifitm3) was identified in a screen for genes expressed specifically in early primordial germ cells (PGCs) (Saitou et al., Reference Saitou, Barton and Surani2002). Ifitm3, together with ifitm1, ifitm2, ifitm5, ifitm6 and ifitm10, are on chromosome 7, whereas ifitm7 is on chromosome 16. Murine ifitm genes encode proteins of 104–144 amino acids in length with two transmembrane domains (Tanaka et al., Reference Tanaka, Nagamatsu, Tokitake, Kasa, Tam and Matsui2004). In mice, ifitm1 is initially expressed in the extraembryonic tissue and the early mesoderm until differentiation occurs during murine embryonic development. This gene may be required for somite epithelialization and paraxial mesoderm formation. ifitm3 is expressed in the proximal epiblast beginning around 5.5 days post coitum (dpc) embryos, and its expression is gradually restricted to PGCs as gastrulation proceeds. Ifitm3 may play a role in germ cell development, whereas ifitm2 is initially expressed at the late-streak stage (Lange et al., Reference Lange, Saitou, Western, Barton and Surani2003). Ifitm5 is not detectable in the early embryo from 5.5–9.5 dpc, but it is expressed in the developing bone beginning around 14.5 dpc. Recent studies have shown that members of the IFITM family may also be involved in the promotion and maintenance of the pluripotent state in many progenitor cells through their anti-proliferative effects (Johnson et al., Reference Johnson, Sangrador-Vegas, Smith and Cairns2006).
In teleost fish, only ifitm1 from large yellow croaker and two rainbow trout ifitms (ifitm1 and ifitm2) have been identified to date. RT-PCR analysis has shown that rainbow trout ifitm1 mRNA is expressed in the head, kidney, gill and liver. This analysis also showed that the expression of ifitm2 mRNA was highest in the gill, heart and liver, but absent from the head, kidney and blood (Johnson et al., Reference Johnson, Sangrador-Vegas, Smith and Cairns2006; Wan & Chen, Reference Wan and Chen2008). However, little information is known about the expression profiles or functions of IFITMs in teleost fish. In the current study, we report the cloning and expression analysis of zebrafish ifitm1 and ifitm3. The distribution of ifitm1 and ifitm3 mRNA was studied in adult zebrafish tissues and the developing embryo using RT-PCR analysis. These findings are used to discuss the potential functional roles these proteins play in developing and adult zebrafish.
Materials and methods
Experimental animals
Zebrafish (Danio rerio) were obtained from the Institute of Hydrobiology at the Chinese Academy of Science and were maintained at 28.5°C on a 14 h/10 h light/dark cycle. Embryos were collected from spontaneously spawning fish and cultured in egg water (Westerfield, Reference Westerfield1993; Kimmel et al., Reference Kimmel, Ballard, Kimmel, Ullmann and Schilling1995). Oocytes were staged based on physiological and biochemical characteristics, in addition to the morphological criteria described by Selman et al. (Reference Selman, Wallace, Sarka and Qi1993).
Electronic cloning and sequence screen of ifitm-related ESTs in zebrafish
Electronic cloning was used to identify expressed sequence tags (ESTs) related to zebrafish ifitm1 and ifitm3. The cDNA sequences of mouse ifitm1 (GenBank accession no. NM_026820.3) and ifitm3 (NM_025378.2) were used as probes for BLAST analysis of the zebrafish EST database at the National Center for Biotechnology Information (NCBI). The ifitm1 (CN508493.1) and ifitm3 (EH281751.1) related ESTs were identified using this approach.
RNA isolation, cDNA synthesis and RT-PCR
Total RNA from adult zebrafish tissue, zebrafish larvae and embryos at specific developmental stages were isolated using TRIzol reagent (Invitrogen Corp, Carlsbad, CA, USA). To remove any DNA contamination, DNase I (Promega, Madison, WI, USA) was used to treat the total RNA. Afterwards, 3 μg of total RNA was used for cDNA synthesis (37°C for 60 min) using 0.5 μg of oligo d(T)18, 10 mM dNTP and 200 U of M-MLV reverse transcriptase (Promega).
RT-PCR was used to amplify zebrafish ifitm1 and ifitm3 cDNA from different adult zebrafish tissues and embryonic stages. First-strand cDNA was used as a template, and gene-specific primers were used to amplify the ifitm1 and ifitm3 transcripts (ifitm1 Forward: 5′-ACTAACAGGCATCACTGCGTCA-3′ and Reverse: 5′-TTCTCTGTGTTTATTCATCCTCCA-3′; ifitm3 Forward: 5′-GCACTCCGCTCACCAACTGT-3′ and Reverse: 5′-GGTGGTGGTAGGTTTGCTCG-3′). To verify RNA quality, zebrafish β-actin was used as an internal control (forward: 5′-CTGGGGCGCCCCAGGCACCA-3′ and reverse: 5′-CTCCTTAATGTCACGCACGATTTC-3′). PCR was performed in a 25 μl reaction mix containing 10 mM Tris–HCl (pH 8.3), 0.2 mM dNTP, 1.5 mM MgCl2, 50 mM KCl, 0.2 mM of each primer, and 1 U of Taq DNA polymerase. The amplification conditions included a 5 min denaturation step at 94°C, followed by 30 cycles of 94°C for 30 s, 65°C for 30 s, and 72°C for 2 min, with a final extension at 72°C for 10 min.
Rapid amplification of cDNA ends (RACE)
All RACE assays were performed according to the BD SMART RACE cDNA amplification kit user manual. 3′-UPM (5′-CTAATACGACTCACTATAGGGC-3′) was used as a common primer. To extend the 3′-end of the ifitm1 cDNA, 3′-RACE was performed using ifitm1 gene-specific primer1 3′if1GSP1 (5′-CCAGAGACCGCAGATTGCTTGGAGAC-3′) and 3′if1GSP2 (5′-CATCGCTTCTGTTATTCTTGGCGTCCTC-3′). First round touchdown PCR was performed with 3′if1GSP1 using the following conditions: 94°C for 30 s, followed by five cycles of 72°C for 2 min, 94°C for 30 s, and 70°C for 30 s, followed by five cycles of 72°C for 2 min, 94°C for 30 s, 68°C for 30 s, and finally 25 cycles of 72°C for 2 min; a final extension at 72°C was performed for 10 min. First round PCR product (diluted 1:50) was then used as a template for the second round of PCR amplification. Second round PCR was performed with 3′if1GSP2 under the following conditions: 94°C for 3 min, followed by 30 cycles of 94°C for 30 s, 65°C for 30 s, and 72°C for 2 min and a final extension at 72°C for 10 min. The ifitm3 gene-specific primer1 3′if3GSP1 (5′-CATTCTTGCTTCGGGCTGGAACCTC-3′) and 3′if3GSP2 (5′-ACCTACCACCACCTCCAAACCTTCT-3′) were used to extend the 3′-end of the ifitm3 cDNA. The methods were the same as those used for ifitm1.
Conversely, 5′-RACE experiments were performed using a common primer 5′-NUP (5′-AAGCAGTGGTATCAACGCAGAGT-3′). To extend the 5′-end of the ifitm1 cDNA, 5′if1GSP1 (5′-CAGACATTCTTTGAAGGGTTATTGGTGGC-3′) and 5′if1GSP2 (5′-GCATAGTCTCCAAGCAATCTGCGGTCTC-3′) were used. To extend the 5′-end of the ifitm3 cDNA, 5′if3GSP1 (5′-AGAAGCAGGACCAGCAGACCCAACA-3′) and 5′if3GSP2 (5′-AAGCCCAGGCAGCAGAAGTTGACG-3′) were used. The PCR conditions were similar to those used for 3′-RACE.
In situ hybridization and whole-mount in situ hybridization
Zebrafish ifitm1 riboprobe was prepared from a 704 bp fragment (GU457425, nucleotides 19–722), and the ifitm3 riboprobe was prepared from a 426 bp fragment (GU457426, nucleotides 70–495). Antisense riboprobes for each transcript were labelled with digoxigenin-UTP using SP6 RNA polymerase, while the control, sense probes were synthesized with T7. The hybridization signal was detected using NBT/BCIP according to the manufacturer's instructions (Roche).
In situ hybridization was performed at 65°C. The ovary samples were embedded in tissue freezing medium (Leica, Wetzlar, Germany) at −25°C and then cut into 8 μm sections. Frozen sections were placed onto gelatinized slides, and in situ hybridization analysis was performed as described (Dijkman et al., Reference Dijkman, Mentzel, De Jong and Assmann1995). For whole-mount in situ hybridization, the embryos were staged according to established morphological criteria using the protocol described by Westerfield (Reference Westerfield1993). Images of the embryos and all sections were captured using an Olympus BH-2 microscope (Olympus).
Results
Cloning and sequence analysis of zebrafish ifitm1 and ifitm3
Two ifitm-related zebrafish ESTs (CN508493.1 and EH281751.1) were identified in the UniGene sequence database. Full-length cDNAs of ifitm1 and ifitm3 were obtained by performing RACE analysis and were submitted to the GenBank database (GU457425 and GU457426, respectively).
The 744 bp full-length cDNA of ifitm1 contains a 345 bp open reading frame (ORF), which is preceded by a 63-bp 5′-untranslated region (UTR) and followed by a 336-bp 3’-UTR. A typical putative polyadenylation signal (AATAA) was found upstream from the polyA tail. The initiation codon was located at position 64–66 bp, whereas the stop codon was located at position 406–408 bp (Fig. 1 A). The ifitm1 gene is located on zebrafish chromosome 5 and contains two exons and one intron. Nucleotide sequence analysis indicated that the splice junctions between the introns and exons followed the ‘AG-GT’ rule. Zebrafish ifitm1 encodes a 114 amino acid (aa) protein with a theoretical molecular weight of 12.558 kDa and an isoelectric point (pI) of 8.89.
(A) Full-length cDNA and the deduced amino acid sequence of zebrafish ifitm1. The initiation codon, stop codon and polyadenylation signal are all shown in bold. The amino acid sequence is represented using capitalized one-letter codes below the nucleotide sequence. (B) Full-length cDNA and the deduced amino acid sequence of zebrafish ifitm3. The initiation codon, stop codon and polyadenylation signal are all shown in bold. The amino acid sequence is represented using capitalized one-letter codes below the nucleotide sequence.

The 702 bp full-length cDNA of ifitm3 consisted of a 429-bp ORF, which extends from position 36 to 464. Alignment of the cDNA sequence with genomic DNA revealed that ifitm3 is on zebrafish chromosome 25 and includes two exons and one intron, similar to ifitm1. The splice junctions between the introns and exons also adhered to the ‘GT–AG’ rule. The zebrafish ifitm3 encodes a 142 aa protein with a theoretical molecular weight of 15.638 kDa and a pI of 8.10 (Fig. 1 B)
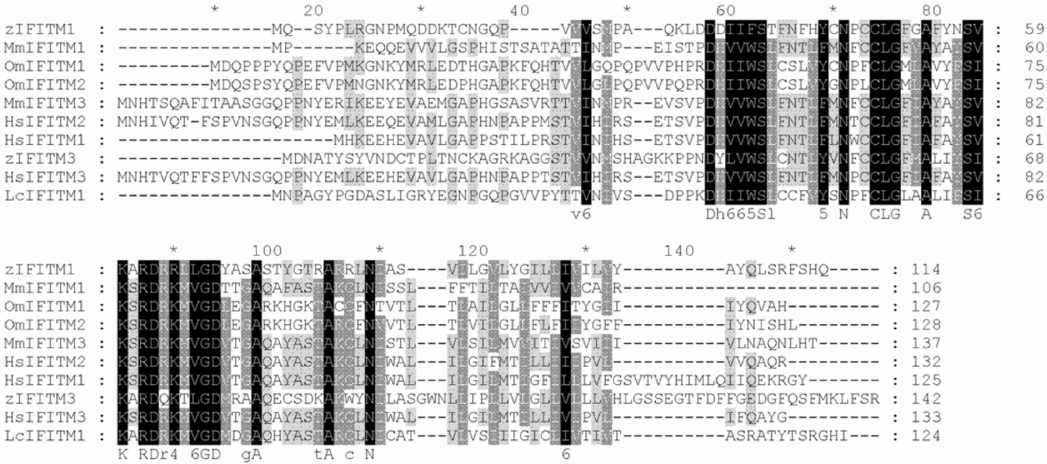
Based on multiple alignments, zebrafish IFITM1 (ADK55689) shared 39, 41, 34, 33, 37, 41, 47, 46 and 50% aa sequence homology with zebrafish IFITM3 (ADD38964), Larimichthys crocea LcIFITM1 (ABY55168), rainbow trout OmIFITM1 (CAC83757), OmIFITM2 (CAC85160), mouse MmIFITM1 (NP_081096), MmIFITM3 (NP_079654), human HsIFITM1 (CAA59337), HsIFITM2 (CAG46672) and HsIFITM3 (NP_066362), respectively (Fig. 2).
Multiple alignment of the deduced amino acid sequence of zebrafish zIFITM1 with zebrafish zIFITM3 (ADD38964), Larimichthys crocea LcIFITM1 (ABY55168), rainbow trout OmIFITM1 (CAC83757), OmIFITM2 (CAC85160), mouse MmIFITM1 (NP_081096), MmIFITM3 (NP_079654), human HsIFITM1 (CAA59337), HsIFITM2 (CAG46672) and HsIFITM3 (NP_066362) using ClustalX software. Grey shading indicates similar residues, whereas black shading indicates identical residues.

According to protein–protein BLAST (BlastP) analysis at the NCBI database, a conserved domain (aa 19–99 and aa 26–108 in IFITM1 and IFITM3, respectively) was identified in both proteins. This domain belongs to the CD225 family, which is characterized by an intracellular domain located between two conserved transmembrane domains. Structural analysis showed that zebrafish IFITM1 and IFITM3 consisted of five putative domains, including the N- and C-terminal extracellular domains, two putative transmembrane domains, and an intracellular domain between the two transmembrane domains. In regards to IFITM1, aa 1–36 of the N-terminal and aa 106–114 of the C-terminal domains are extracellular; aa 49–82 are intracellular, while aa 37–48 and aa 83–105 constitute the transmembrane regions. For IFITM3, aa 1–42 of the N-terminal and aa 118–142 of the C-terminal domains are extracellular; aa 65–97 are intracellular, while aa 43–64 and aa 98–117 constitute the transmembrane regions. According to the SignalP 3.0 server, neither protein is predicted to have a signal peptide or a signal anchor and are not likely to be secretory proteins.
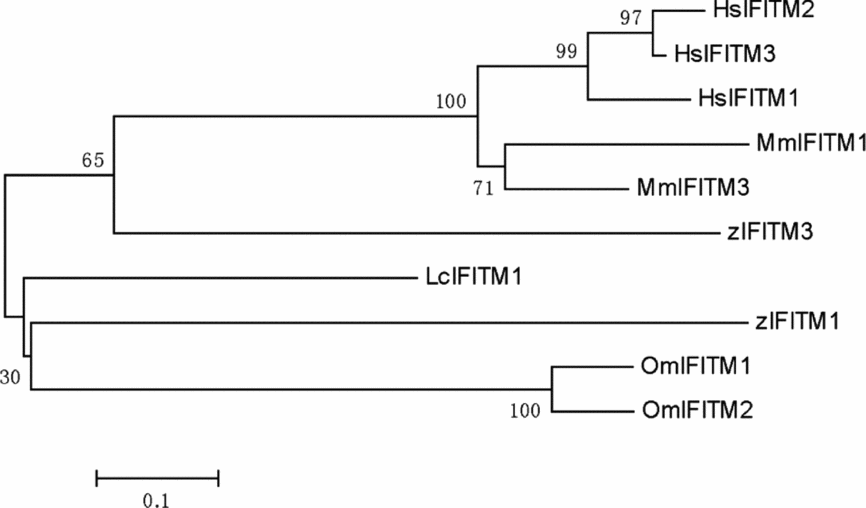
To better understand the evolutionary relationship between zebrafish IFITM1 and IFITM3 and the IFITM family members in other species, a phylogenetic tree was constructed with the ClustalX and MEGA (Ver. 3.1) software using the neighbor-joining and maximum-likelihood methods. The results showed that zebrafish IFITM1 and IFITM3 lie within the IFITM group containing Larimichthys crocea IFITM1, rainbow trout IFITM1, IFITM2, mouse IFITM1, IFITM3, human IFITM1, IFITM2, and IFITM3. Zebrafish IFITM1 had a closer evolutionary relationship to Larimichthys crocea and rainbow trout IFITMs, while zebrafish IFITM3 was more closely related to mammalian IFITMs than zebrafish IFITM1 (Fig. 3).
The phylogenetic tree of IFITM family proteins was constructed with the ClustalX and MEGA (Ver. 3.1) software using the neighbour-joining and maximum-likelihood methods. The numbers at the branches represent the bootstrap values (%) from 500 replicates.

Expression of zebrafish ifitm1 and ifitm3 mRNA in adult tissues
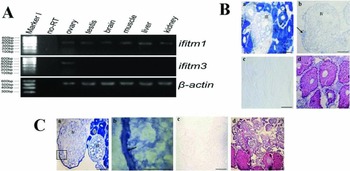
The adult tissue distribution of zebrafish ifitm1 and ifitm3 mRNA was determined using RT-PCR analysis. The results show that ifitm1 is expressed in the ovary, testis, brain, muscle, liver and kidney, while ifitm3 mRNA was only detected in the ovary (Fig. 4 A). To examine the expression patterns of ifitm1 and ifitm3 mRNA during zebrafish oogenesis, we performed in situ hybridization analysis. Ifitm1 mRNA was strongly expressed in the ooplasm from stage I to stage II, but became weaker in the stages III to IV oocyte. The decrease of the expression level of ifitm1 mRNA may be due to the large accumulation of yolk within the cytoplasm during these stages (Fig. 4 Ba, Bb). In addition, ifitm3 mRNA was strongly expressed in the cytoplasm from stage I to stage II oocytes, and was decreased in stage III oocytes. However, it was ultimately localized in the cortical region beneath the plasma membrane of the lower hemisphere of the stage IV oocytes. In addition, the blue signal was not observed in the upper hemisphere of the stage IV oocytes (Fig. 4 C). No signal was detected using control sense probes (Fig. 4 Bc, Cc). Hematoxylin and eosin (HE) staining (Fig. 4 Bd, Cd) was performed to characterize oocyte morphology.
mRNA expression of zebrafish ifitm1 and ifitm3 in adult tissues. (A) Tissue analysis of zebrafish ifitm1 and ifitm3 mRNA expression using RT-PCR. RNA template and ß-actin were used as negative and internal controls, respectively. (B) Expression of zebrafish ifitm1 mRNA in the ovary using in situ hybridization. (Ba, Bb) Based on antisense probe detection, intense positive signals were observed throughout the cytoplasm of stage I to stage II oocytes, and this signal decreased in the later stage oocytes. Arrow indicates the blue staining of the stage I oocyte; (Bc) negative control (sense probe); (Bd) HE staining. (C) Expression of zebrafish ifitm3 mRNA in the ovary. (Ca) ifitm3 mRNA was strongly expressed in the ooplasm from stage I to stage II and was mainly localized to the cortex region beneath the plasma membrane of stage IV oocytes; (Cb) partial enlargement of (Ca). The arrow points to the cortex region beneath the plasma membrane; (Cc) negative control (sense probe); (Cd) HE staining. I: stage I oocyte; II: stage II oocyte; III: stage III oocyte; IV: stage IV oocyte. Scale bars: 0.5 mm in all panels.

Expression of zebrafish ifitm1 and ifitm3 mRNA during early embryonic development
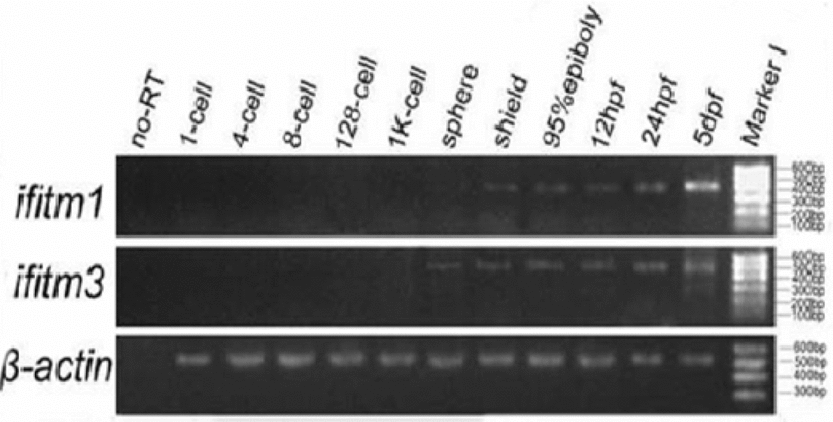
The mRNA expression patterns of zebrafish ifitm1 and ifitm3 mRNA were investigated in embryos from the 1-cell stage to 5 days post-fertilization (dpf) using RT-PCR. The results show that the expression of ifitm1 was first detected in shield stage embryos, and ifitm3 mRNA was first detected in sphere stage embryos. Transcripts of these two genes were present in embryos at all later stages but were not detectable in embryos from the 1-cell to the 1k-cell stage (Fig. 5).
RT-PCR analysis of zebrafish ifitm1 and ifitm3 mRNA expression in embryos from the 1-cell stage to 5 dpf. Ifitm1 was first expressed at the shield stage, and ifitm3 mRNA was first expressed at the sphere stage.

We further investigated the spatial expression patterns of the identified zebrafish ifitm1 and ifitm3 mRNAs in embryos from the 1-cell stage to 24 hpf via whole-mount in situ hybridization. The ifitm1 mRNA was not expressed from the cleavage stage to the sphere stage, and the ifitm1 transcripts were localized in the blastoderm cells of the shield stage embryos (Fig. 6 A, B). Ifitm1 mRNA was then detected in a ubiquitous expression, which, strikingly, included the PGCs at the 80% epiboly stage. Throughout the segmentation stage to embryos of 24 hpf, strong hybridization signals were mainly detected in the head, trunk and tail of the embryos, but could no longer be detected in the PGCs (Fig. 6 C–E). In 24 hpf embryos, no signals were detected with the sense probes, which served as negative controls (Fig. 6 F).
Expression of zebrafish ifitm1 mRNA during early embryonic development. (A) No signal was detected at the sphere stage. (B) Zebrafish ifitm1 expression began in the shield stage embryos. (C) Ifitm1 transcripts appeared in PGCs at the 80% epiboly stage. The same regions are boxed and magnified. The arrows indicate the PGCs. (D, E) Ifitm1 transcripts were detected in the head, trunk and tail. (F) No hybridization signals were detected in 24 hpf embryos using the sense probe (negative control). The signal was not detected from the 1-cell stage through the shield stage (data not shown). Scale bars: 0.2 mm in all panels.

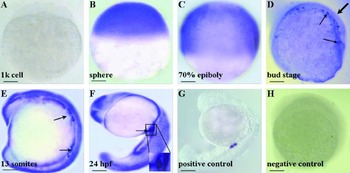
Unlike ifitm1, ifitm3 expression was initially detected in sphere stage embryos and was widely expressed throughout the embryo, from the 70% epiboly to 24 hpf (Fig. 7 B–F). Interestingly, at the bud stage, ifitm3 transcripts were detected in PGCs on the dorsal side of the embryo. The signal later accumulated in PGCs in the caudal portion of 24 hpf embryos (Fig. 7 D–F). The ifitm1 and ifitm3 transcripts were not detected in embryos from the 1-cell to the 1k-cell stage (data not shown), which was consistent with the results of the RT-PCR analysis. Expression of the PGC marker gene vasa was used as a positive control to identify the PGCs in 24 hpf embryos (data not shown).
Expression of zebrafish ifitm3 mRNA during early embryonic development. (A) No signal was detected in the 1k-cell stage. (B–F) Ifitm3 was first expressed in embryos at the sphere stage and became widely expressed in embryos from the 70% epiboly stage to 24 hpf. (D–F) The transcripts appeared in PGCs of embryos from the bud stage to 24 hpf. The same regions are boxed and magnified in (F). The signal was not detected from 1-cell stage until the sphere stage (data not shown). The thin arrows indicate the PGCs in (D–F). The thick arrow in (D) indicates the dorsal. (G) The transcripts appeared in PGCs of 24 hpf embryos using the vasa probe (positive control). (H) No hybridization signals were detected in somites stage embryos using the sense probe (negative control). Scale bars: 0.2 mm in all panels.

Discussion
Characterization of zebrafish ifitm1 and ifitm3
The ifitm gene family encodes proteins that contain two highly conserved putative transmembrane domains and an intracellular domain (Lewin et al., Reference Lewin, Reid, McMahon, Stark and Kerr1991; Tanaka & Matsui, Reference Tanaka and Matsui2002). In the present study, we cloned the 744 bp full-length cDNA of zebrafish ifitm1, which encodes a 114 aa protein, and the 702 bp full-length cDNA of ifitm3, which encodes a 142 aa protein. The deduced proteins of the two genes possess the stereotypical structural features of IFITM family members, including two conserved transmembrane domains with an intervening intracellular domain. Therefore, this analysis indicates that ifitm1 and ifitm3 belong to the IFITM family.
Phylogenetic analysis of the IFITM family proteins showed that zebrafish IFITM1 and IFITM3 lie within the IFITM group, consistent with their evolutionary conservation. Zebrafish IFITM1 has a closer evolutionary relationship to Larimichthys crocea and rainbow trout IFITMs, while zebrafish IFITM3 is more homologous to mammalian IFITMs than zebrafish IFITM1 (Fig. 3). We suggest that the functions of zebrafish IFITM3 may be distinct from those of IFITM1 but similar to those of mammalian IFITMs.
Expression of ifitm1 and ifitm3 mRNA in zebrafish adult tissues
Human IFITM1 is expressed in leucocytes and endothelial cells (Lewin et al., Reference Lewin, Reid, McMahon, Stark and Kerr1991). In teleost fish, the spleen, kidney and gills are major immune organs, which contain large numbers of immune cells including leucocytes and lymphocytes. In rainbow trout, ifitm1 was highly expressed in the kidney, gills and liver (Johnson et al., Reference Johnson, Sangrador-Vegas, Smith and Cairns2006). In the present study, we demonstrated that zebrafish ifitm1 mRNA was also expressed in the kidney and liver, organs associated with immunological functions, similar to rainbow trout ifitm1 (Fig. 4A). The results of our study reveal that zebrafish ifitm1 may play a role in tissues that perform immune or hematopoietic functions (Hoar et al., Reference Hoar, Randall, Iwama and Nakanishi1997).
The zebrafish Dazl gene plays pivotal roles during zebrafish germ cell development. The Dazl mRNA was detected in the cytoplasm of stage I oocytes, and was expressed in the region near the cortex of stage II oocytes. Interestingly, Dazl mRNA was ultimately localized at the vegetal cortex region (lower hemisphere), but was not found at the other regions (upper hemisphere) of the stage III to stage IV oocytes (Howley & Ho, Reference Howley and Ho2000). In this study, we also demonstrated that zebrafish ifitm1 and ifitm3 mRNA were expressed during oogenesis. Particularly, ifitm3 was only transcribed in the ovary, but not in other tissues (Fig. 4A). By in situ hybridization analysis, we found that ifitm1 and ifitm3 mRNA were strongly expressed in the ooplasm of stage I to II oocytes. And ifitm3 was ultimately localized in the cortex region of the lower hemisphere of the stage IV oocytes. The blue signal was not observed in the upper hemisphere (Fig. 4 C). Our results demonstrate that the expression patterns of the ifitm3 are similar to that of Dazl during the oocytes development. Thus, we hypothesize that zebrafish ifitm3 is required during oogenesis. Future studies will be performed to investigate the functions of ifitm3 in the female gonad.
Expression of zebrafish ifitm1 and ifitm3 during early embryonic development
Mouse ifitm genes exhibit a dynamic temporal and spatial expression pattern during early embryonic development. Ifitm1 is initially expressed in the epiblast at the early gastrula stage and is expressed in the epiblast, mesoderm and the PGCs later in gastrulation. Subsequently, ifitm1 is expressed in the paraxial mesoderm, but not in the PGCs, throughout the segmentation period. Mouse ifitm1 is required for the transition of the PGCs from the mesoderm into the endoderm and plays an essential role during organogenesis (Lange et al., Reference Lange, Saitou, Western, Barton and Surani2003; Tanaka et al., Reference Tanaka, Yamaguchi, Tsoi, Lickert and Tam2005). In this study, we show that zebrafish ifitm1 transcripts were localized in the blastoderm cells of the shield stage embryos (Fig. 6 A, B). Throughout the segmentation phase (10.25–24 hpf), strong ifitm1 expression was primarily detected in the head, trunk and tail of the embryo, but could no longer be detected in the PGCs (Fig. 6 D, E). The expression pattern of ifitm1 is similar to that of mouse ifitm1 during early embryonic development. These results suggest that ifitm1 may play an important role during embryonic development (Hoar et al., Reference Hoar, Randall, Iwama and Nakanishi1997). A zebrafish nanos gene is essential for the development of PGCs. Nanos1–GFP (green fluorescent protein) 3′-UTR are the labels of the PGCs in zebrafish. Marion Ko et al. demostrated that differential GFP expression levels can distinguish between zebrafish germ cells and somatic cells by Nanos1–GFP 3′-UTR during the gastrulation stages (Köprunner et al., Reference Köprunner, Thisse, Thisse and Raz2001). In our study, zebrafish ifitm1 mRNA is expressed not only in the embryonic cells, but also in the PGCs in the 80% epiboly stage which is similar to those of nanos at the 50% epiboly stage (the gastrulation stages) (Fig. 6 C). These data suggest that ifitm1 mRNA may play roles in the PGCs. Further investigation is required to understand the functions of ifitm1 in the PGCs at the gastrulation stages.
PGCs have been identified morphologically and can be used to confirm the migratory pathway of the PGCs from their location during the gastrula stages to the gonadal anlagen in zebrafish. In zebrafish, vasa mRNA is the component of the germplasm (molecular marker). And the vasa mRNA is uniquely localized to the cleavage planes at the 2- and 4-cell stages. By the 1k-cell stage, the PGCs assemble into four clusters and then begin to proliferate from the sphere stage to the 30% epiboly stage. During gastrulation, they transform from round, immotile cells into a polarized migratory population localizing at the anterior and lateral boundaries of the mesoderm. The PGCs continue to migrate toward the intermediate region bordering the mesoderm throughout the segmentation period and are bilaterally restricted to the anterior end of the yolk extension at 24 hpf stage (Mich et al., Reference Mich, Blaser, Thomas, Firestone, Yelon, Raz and Chen2009). Vasa mRNA is a germ cell-specific marker that is used to identify zebrafish PGCs. In these studies, we found that zebrafish ifitm3 mRNA was initially expressed in migrating PGCs at gastrula stages. During somitogenesis, its expression was restricted to the PGCs located at the anterior and lateral boundaries of the mesoderm. Ifitm3-expressing cells then migrated toward the region of the genital ridge and stayed in that position of embryos of 24 hpf. Our work demonstrates that zebrafish ifitm3 mRNA is expressed in the migrating PGCs, which is similar to that of vasa in the developing zebrafish PGCs. Therefore, we infer that ifitm3 is required for the migration and localization of PGCs in zebrafish. Further work should be focused on performing gene knock-down, such as antisense morpholinos, to elucidate its functions.
In Drosophila, maternal mRNAs are stable after fertilization and play roles in embryonic development (Akam, Reference Akam1987). Oocyte-derived mRNAs are degraded shortly after fertilization and cannot direct more than the first few cell divisions in mammals (Thompson et al., Reference Thompson, Legouy and Renard1998). In our study, we found that the ifitm3 was expressed in developing oocytes, but not expressed in early stage embryos. We suggest that ifitm3 is degraded after fertilization, which is similar to some maternal mRNAs in mammals. About the mechanism of maternal mRNA degradation after fertilization, recently, it has been reported that MiR-430 participates in the degradation progress in zebrafish (Giraldez et al., Reference Giraldez, Mishima, Rihel, Grocock, Dongen, Inoue, Enright and Schier2006). Further studies are needed to determine the mechanism of degradation of ifitm3 mRNA in early stage embryos.
In conclusion, we identified zebrafish ifitm1 and ifitm3 and have determined that their corresponding proteins contain the typical structural features of IFITM family members. ifitm1 mRNA is expressed in the ovary, testis, brain, muscle, liver and kidney, while ifitm3 mRNA is only expressed in the ovary. During early embryo development, ifitm1 mRNA is broadly expressed in the somatic cells, whereas ifitm3 is specifically expressed in the PGCs. Expression analysis suggests that ifitm1 may play an important role in early oogenesis, and ifitm3 may be crucial for PGC migration. In future studies, antisense morpholinos should be used to knock-down expression of ifitm1 and ifitm3 to elucidate their functions.
Acknowledgements
We thank the Natural Science Foundation of China (Grant number 31372147) for their support.