INTRODUCTION
The cyclopoid family Oncaeidae is one of the most diverse taxa of marine pelagic copepods (Boxshall & Halsey, Reference Boxshall and Halsey2004). They exhibit a ubiquitous distribution throughout the world oceans, ranging from tropical to polar regions (Malt, Reference Malt1983 for a review) and from the surface to bathypelagic depths (e.g. Boxshall, Reference Boxshall1977; Böttger-Schnack, Reference Böttger-Schnack1994; Nishibe & Ikeda, Reference Nishibe and Ikeda2004). Species of this family are small, usually less than 1.0 mm in body length as adults (Malt, Reference Malt1983; Böttger-Schnack et al., Reference Böttger-Schnack, Lenz and Weikert2004). Recent investigations using appropriate net meshes of 0.1 mm or finer have shown that the oncaeids highly dominate the copepod communities in terms of abundance, especially in oceanic midwater and deep water (e.g. Böttger-Schnack, Reference Böttger-Schnack1996, Reference Böttger-Schnack1997; Yamaguchi et al., Reference Yamaguchi, Watanabe, Ishida, Harimoto, Furusawa, Suzuki, Ishizaka, Ikeda and Takahashi2002). The oncaeids are known to be loosely associated with discarded houses of appendicularians (Alldredge, Reference Alldredge1972; Ohtsuka et al., Reference Ohtsuka, Kubo, Okada and Gushima1993; Steinberg et al., Reference Steinberg, Silver, Pilskaln, Coale and Paduan1994). They feed on phytoplankters and protists remaining on the houses, as well as on the actual membranes and incurrent filters of the houses (Ohtsuka & Kubo, Reference Ohtsuka and Kubo1991; Ohtsuka et al., Reference Ohtsuka, Böttger-Schnack, Okada and Onbe1996). Because of their high numerical abundance and substrate-feeding behaviour, oncaeids may play important trophic roles which are considerably different from those of suspension-feeding calanoids.
Information about the species composition and vertical distribution of oncaeid copepods is still scarce for the western North Pacific and its adjacent waters as compared to other regions of the world ocean. Tsalkina (Reference Tsalkina1977) investigated the vertical distribution and diel vertical migration of some oncaeid species in the upper 500 m of the tropical North Pacific and the Sulu Sea. Several studies have also provided data on the depth-distribution pattern of oncaeids (Furuhashi, Reference Furuhashi1966; Minoda, Reference Minoda1971; Hirakawa et al., Reference Hirakawa, Ikeda and Kajihara1990; Lo et al., Reference Lo, Shih and Hwang2004). Itoh & Mizushima (Reference Itoh and Mizushima1999) reported the seasonal distribution of oncaeid copepods at a coastal site in Suruga Bay, central Japan. By using coarse nets with 0.2–0.3 mm meshes, however, all of these studies were unable to include quantitative data on smaller oncaeid species (<0.5 mm in body length), which generally account for a large proportion of total number of oncaeids (e.g. Böttger-Schnack, Reference Böttger-Schnack1990, Reference Böttger-Schnack1997). Nishibe & Ikeda (Reference Nishibe and Ikeda2004) studied the vertical structure of the oncaeid copepod community, including the abundant smaller species, in the upper 2000 m of the Oyashio region, western subarctic Pacific by analysing samples taken with nets of 0.1 mm mesh size.
The present study investigates and compares the community structure and vertical distribution of oncaeid copepods collected with a net of 0.063 mm mesh size from the upper 500 m at an offshore site of Tosa Bay, located on the Pacific coast of southern Japan, between samples taken in August and November 2005. The results are compared with published data based on fine-mesh net samples from the other oceanic regions. The depth-distribution of appendicularians is also examined in order to compare with that of oncaeid copepods. Vertical differences in the oncaeid copepod community are discussed in relation to the hydrographic conditions in the water column.
MATERIALS AND METHODS
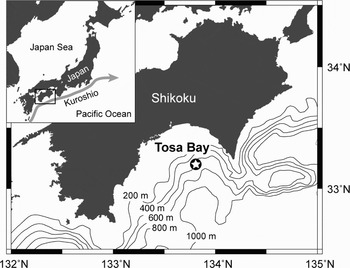
Tosa Bay has a wide mouth open to the Pacific Ocean, with a narrow continental shelf (10–20 km) and steep slope that falls to depths greater than 800 m (Figure 1). The hydrographic conditions of the bay are strongly influenced by the Kuroshio Current (Miyata et al., Reference Miyata, Yamashige and Sugiura1985; Fujimoto, Reference Fujimoto1987), the western boundary current of the North Pacific subtropical gyre, flowing eastward off just south of Shikoku, Japan.
Location of sampling site (circled star) in Tosa Bay, southern Japan, with bathymetric isolines (200, 400, 600, 800 and 1000 m).

Zooplankton samples were collected on 4 August and 3 November 2005 on board the RV ‘Shirafuji-Maru’ at a station (33°12′N 133°48′E, 700 m deep) located on the shelf slope region of Tosa Bay (Figure 1). A closing type net (36 cm mouth diameter, 0.063 mm mesh size; Itoh & Mochioka, Reference Itoh and Mochioka2005) was hauled vertically at a speed of 0.5 m s−1 from eight discrete layers: 0–20, 20–50, 50–100, 100–150, 150–200, 200–300, 300–400 and 400–500 m. All samplings were carried out in the daytime (11:00–14:30 in local time). The volume of water filtered was estimated from the reading of a flow meter (Rigosha) mounted inside the mouth of the net. The depth the net reached was estimated from the wire angle and wire paid out. After collection, samples were preserved immediately on board ship in a 2% formaldehyde–seawater solution buffered with borax. Vertical profiles of temperature and salinity were determined simultaneously by using a CTD system (Integrated CTD, Falmouth Scientific, Inc.). Water samples for measurement of chlorophyll-a concentration were collected with 1.7 l Niskin bottles mounted on a rosette multisampler from depths of 10, 20, 30, 40, 50, 60, 80, 100, 150 and 200 m. Surface water was collected with a plastic bucket. A 400 ml portion of each water sample was filtered onto a Whatman GF/F filter. Each sample collected on a filter was extracted in 8 ml of 90% acetone for 24 hours, and chlorophyll-a concentration was then determined with a fluorometer (10–AU, Turner Designs).
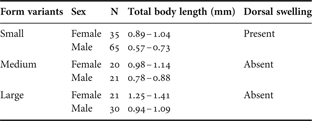
The oncaeid copepods (adults and copepodid stages) were sorted from the entire sample or aliquots (from 1/2 to 1/8) taken by using a box type splitter (Motoda, Reference Motoda1959). About 200–1000 individuals per sample were enumerated under a stereomicroscope. The abundance of appendicularians was assessed from the entire sample or aliquots (from 1/2 to 1/16). Taxonomic identification of oncaeid copepods was made only for adults (CVI females and males); immature copepodid stages (CI–CV) of all oncaeid species were pooled without identification and counted as Oncaea spp. juveniles. The adult females and males were counted separately. Species identification followed Shmeleva (Reference Shmeleva1969), Gordeyeva (Reference Gordeyeva1972, Reference Gordeyeva1973), Heron (Reference Heron and Pawson1977), Kršinić & Malt (Reference Kršinić and Malt1985), Boxshall & Böttger (Reference Boxshall and Böttger1987), Böttger-Schnack & Boxshall (Reference Böttger-Schnack and Boxshall1990), Heron & Bradford-Grieve (Reference Heron and Bradford-Grieve1995), Böttger-Schnack (Reference Böttger-Schnack1999, Reference Böttger-Schnack2001, Reference Böttger-Schnack2002, Reference Böttger-Schnack2003, Reference Böttger-Schnack2005) and Huys & Böttger-Schnack (Reference Huys and Böttger-Schnack2007). A more detailed microscopic examination with dissection was conducted for identification of some sibling species of smaller species. According to the description given in Böttger-Schnack & Huys (Reference Böttger-Schnack and Huys2004), female O. venusta were separated into distinct forms by their body length and presence/absence of a dorsal swelling on the second pediger. Male O. venusta were assigned to the forms merely by their body size. Undescribed Triconia sp. and Oncaea sp., which could clearly be distinguished by morphological characters, were treated as separate taxa.
To examine the seasonal and vertical differences in community structure of oncaeid copepods, we conducted cluster analysis and non-metric multidimensional scaling (MDS) ordination based on species abundance data, using the software package Primer 5 (Primer-E Ltd.). Abundance data (ind m−3) of each oncaeid species were transformed by log (x+1) values prior to analysis, in order to reduce the bias of very abundant species. The Bray–Curtis index was used to examine the similarities of abundance and species composition between samples. For grouping the samples, similarity indices were coupled with hierarchical agglomerative clustering with the unweighted pair-group method using arithmetic means (UPGMA). The MDS ordination was carried out to delineate the sample groups on the two-dimensional map.
RESULTS
Hydrography
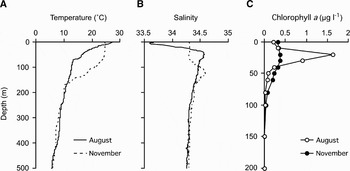
Surface temperatures were 28.4°C in August and 24.5°C in November (Figure 2A). The vertical profiles of temperature showed a strong thermal stratification of the water column in both sampling months; the seasonal thermoclines were well established at 20–70 m depth in August and 70–150 m depth in November. In August, low-salinity water (<34.0) was observed near the surface (Figure 2B), possibly due to the inflows of river water into the bay. The salinity maxima (~34.6), influenced by the offshore Kuroshio Current, were seen at 55 m in August and 120 m in November. Below 170 m depth, there were no apparent differences in the temperatures (5.5–11.0°C) and salinities (34.2–34.4) between August and November. Chlorophyll-a concentrations showed a conspicuous peak at 20 m depth in August, but were more homogeneous between the surface and 40 m depth in November (Figure 2C).
Vertical profiles of (A) temperature, (B) salinity and (C) chlorophyll-a concentration at the sampling site in Tosa Bay in August and November 2005. Note the different depth scales.

Appendicularians
The maximum abundances of appendicularians were found in the shallowest layer (0–20 m), reaching 4140 and 2180 ind m−3 in August and November, respectively. Below 50 m (August) or 100 m (November) depth, the abundances of appendicularians decreased substantially, with densities being less than 20 ind m−3.
Species richness and taxonomic accounts
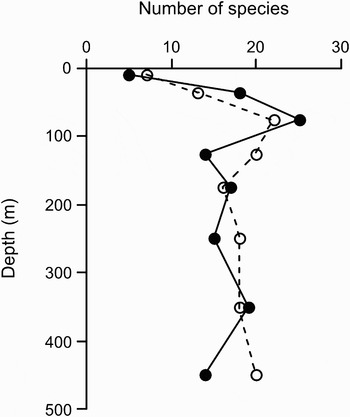
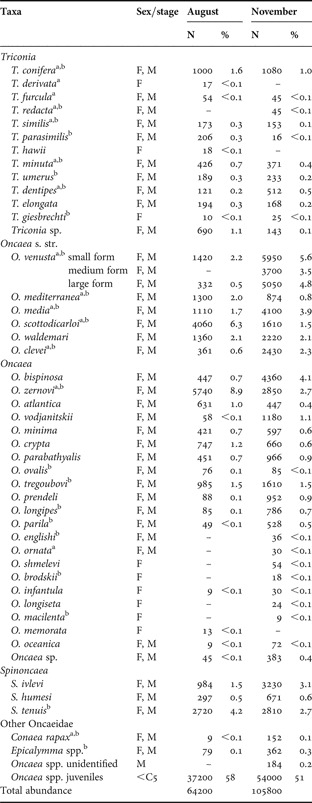
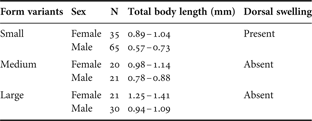
The present study identified five genera, Triconia, Oncaea, Spinoncaea, Conaea and Epicalymma, and 45 species including two as yet undescribed morphotypes of Triconia and Oncaea (Table 1). Three form variants (small, medium and large) of O. venusta were distinguished by the size and presence/absence of the prosomal dorsal swelling (Table 2). The small and large forms were collected in both August and November, whereas the medium form was found only in November (Table 1). Of the two undescribed species, Triconia sp. (body length: 0.62 mm in female) was similar to T. rufa Boxshall & Böttger, but differed by the length ratio of the outer distal spine to the conical projection on the endopods of the legs 2 and 3 and by the absence of the small dorso-posterior projection on the second pediger. Oncaea sp. (body length: 0.36 mm in female and 0.31 mm in male) was similar to O. parabathyalis Böttger-Schnack in habitus and in leg armature, but differed in body size. This species might belong to the setosa- or lacinia-group of the family Oncaeidae (cf. Böttger-Schnack, Reference Böttger-Schnack2005). Species of Epicalymma were not identified further due to their small size. Of a total of 48 taxa, including the three form variants of O. venusta, 37 were found to be common to both August and November (Table 1). The vertical patterns of the number of oncaeid species were fairly similar between the two months (Figure 3): in both months the number increased from the surface to maximal values of more than 20 species at 50–100 m, and were more or less constant below that depth.
Vertical distribution of the number of species of oncaeid copepods at the sampling site in Tosa Bay in August (closed circle) and November 2005 (open circle). Epicalymma spp. and each form variant of Oncaea venusta are counted as one species.

Abundance (N: ind m−2) of oncaeid copepods in the 0–500 m water column at the sampling site in Tosa Bay. Proportional abundance (%) of each species to the total is also shown. F, females; M, males; –, no individuals.

a and b indicate the species have previously been recorded in the Kuroshio and Oyashio regions, respectively (see text for details).
Body length (mm) of form variants of Oncaea venusta in Tosa Bay. The presence/absence of dorsal swelling on the second pediger of female specimen is also shown. N, number of individuals examined.
Abundance and species composition
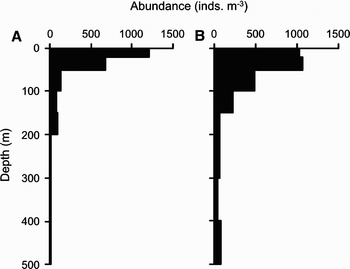
Abundance of oncaeid copepods showed maximal values in the upper part of the epipelagic zone (0–20 m in August and 20–50 m in November) above the thermocline, reaching 1200 and 1100 ind m−3 in August and November, respectively, and then gradually decreased by more than one order of magnitude by 200 m depth (Figure 4). Below that depth, their abundances were more or less constant with lower values. In the water column from 0 to 500 m depth, the abundance of total oncaeid copepods in November (105,800 ind m−2) was about twice as high as that in August (64,200 ind m−2) (Table 1). Oncaea spp. juveniles accounted for about half of the total number of oncaeids in both August and November (Table 1).
Vertical distribution of abundance of oncaeid copepods at the sampling site in Tosa Bay in (A) August and (B) November 2005.

The species composition and abundance of individual species in the water column from 0 to 500 m depth are given in Table 1. Dominant species, each contributing more than 1% of the total abundances in both August and November, were Triconia conifera, Oncaea venusta small form, O. media, O. scottodicarloi, O. waldemari, O. zernovi, O. tregoubovi, Spinoncaea ivlevi and S. tenuis. Oncaea venusta medium form was not observed in August, but became one of the most abundant species in November (3.5% of the total). Oncaea venusta large form and O. bispinosa also showed a much higher relative abundance in November (~5%) than in August (~0.5%). Several deep-water oncaeid species, such as O. englishi, O. ornata, O. shmelevi, O. brodskii, O. longiseta and O. macilenta, were recorded only in November, although their contribution to the total number was low (<0.1%).
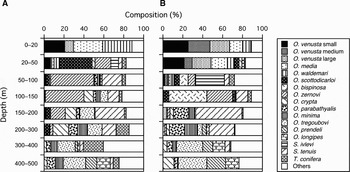
The community structure of adult oncaeid copepods varied considerably according to the depth layers in both August and November (Figure 5). In August Oncaea venusta small form, O. media and O. waldemari predominated in the upper epipelagic zone above the thermocline (0–20 m), each comprising more than 20% of the total number of adults (Figure 5A). Within the thermocline (20–50 m), O. scottodicarloi became the most abundant species, although the above mentioned species remained abundant in this depth layer. In the lower epipelagic zone between 50 and 200 m, very small species O. zernovi and Spinoncaea tenuis were highly abundant, accounting for 15–45% and 10–30%, respectively, of the total oncaeids. Several Triconia species, such as T. minuta, T. umerus, T. dentipes, T. elongata and Triconia sp. occurred in this depth zone, although their combined contribution to the total number was relatively low (<10%). Below 200 m depth, the species compositions were almost the same between the depth layers sampled. Most numerous in this mesopelagic zone were O. crypta, O. parabathyalis, O. minima, O. tregoubovi, O. prendeli, O. longipes and T. conifera.
Vertical community structure of adult oncaeid copepods at the sampling site in Tosa Bay in (A) August and (B) November 2005. Only species contributing more than 10% to the total abundance of adults at least at one depth layer are considered.

In November, the dominant species and their vertical succession were almost identical to those observed in August (Figure 5B), although several species (e.g. Oncaea venusta small and large forms, O. media, O. waldemari, O. crypta, O. parabathyalis, O. tregoubovi and Spinoncaea ivlevi) tended to show a downward shift of their depth-range of distribution as compared to August. In the epipelagic zone, the relative importances of O. venusta medium form, O. bispinosa and S. ivlevi were higher in November than in August, whereas those of O. scottodicarloi and O. zernovi were much lower.
Community analysis
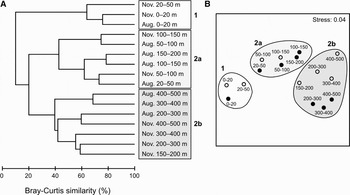
The 16 samples could be separated into two distinct groups by cluster analysis at the similarity level of 10%, according to sampling depth layers (Figure 6A). The first group (Group 1) comprised three samples collected from the upper epipelagic zone above the thermocline in August (0–20 m) and November (0–20 and 20–50 m). The second group (Group 2) consisted of the remaining 13 samples and was further divided into two subgroups, Group 2a and 2b, at the similarity level of 20%. Group 2a included the samples collected from the lower epipelagic zone within or below the thermocline (20–50, 50–100, 100–150 and 150–200 m in August and 50–100 and 100–150 m in November), while Group 2b contained all samples from the mesopelagic zone (200–500 m), with one exception from the lower epipelagic zone (150–200 m) in November. Samples from the same depth layer but on different months were grouped together in a single group or subgroup, except for those from 20–50 m and 150–200 m. Hence, the vertical changes in abundance and species composition appeared to be more pronounced than the seasonal difference between August and November. The arrangement of the samples according to sampling depth layers was also reflected on the MDS ordination plot (Figure 6B), thereby confirming the results of cluster analysis. The upper epipelagic samples (Group 1) were clearly separated from the lower epipelagic and mesopelagic samples (Groups 2a and 2b) on the MDS ordination plot.
(A) Dendrogram for hierarchical clustering of the 16 samples, using group-average linking of Bray–Curtis similarities calculated on log (x+1) transformed abundance data of oncaeid copepods in Tosa Bay, 2005. Cluster groups are shown as 1, 2a and 2b; (B) ordination plot of comparison of samples using non-metric multidimensional scaling (MDS) and Bray–Curtis similarities. Cluster groups determined in the panel A are superimposed. Axis scales are relative in MDS plot. Closed and open circles are samples collected in August and November 2005, respectively.

DISCUSSION
A total of 45 species of four genera and one genus (Epicalymma) were identified from the 0–500 m water column in Tosa Bay. The number of species is much higher than that previously reported in the Kuroshio region from east of the Philippines to east of Honshu, Japan, where 20 species of oncaeid copepods have so far been recorded (Chen et al., Reference Chen, Zhang and Zhu1974; Hirota, Reference Hirota1995; Itoh, Reference Itoh, Chihara and Murano1997; Itoh & Mizushima, Reference Itoh and Mizushima1999). Of the 43 known species identified in the present study, 15 have been recorded in the region, although earlier records of some of them (e.g. Oncaea zernovi, Triconia dentipes and T. similis) may have included their sibling species (O. bispinosa, T. elongata/T. giesbrechti, and T. parasimilis), which have been recently described (cf. Böttger-Schnack, Reference Böttger-Schnack1999, Reference Böttger-Schnack2002). Four species, O. curta, O. notopus, O. tenella and Monothula subtilis, listed by Hirota (Reference Hirota1995) were not found in the present study. Instead, for three of them their sibling species (O. media/O. scottodicarloi/O. waldemari for O. curta, O. parila for O. notopus, and O. zernovi/O. bispinosa for O. tenella) were identified. The large number of oncaeid species in the present study is partly attributable to the finer mesh net used, since many of the newly recorded species are small in size (<0.5 mm in body length). Furthermore, this is also a result of the better taxonomic resolution by taking into account the latest findings in oncaeid species differentiation in the present study.
The species diversity of oncaeid copepods in Tosa Bay is similar to or even higher than that obtained with fine-mesh net samples from other tropical and warm-temperate oceanic areas, such as the Red Sea (47 species from 0–1650 m; Böttger-Schnack et al., Reference Böttger-Schnack, Lenz and Weikert2004), the eastern Mediterranean Sea (28 species from 0–1850 m; Böttger-Schnack, Reference Böttger-Schnack1997) and the Adriatic Sea (22 species from 0–800 m; Kršinić & Grbec, Reference Kršinić and Grbec2002). However, the species number in Tosa Bay is considerably lower as compared to the Arabian Sea, where 69 oncaeids were recorded from the 0–1850 m water column (Böttger-Schnack, Reference Böttger-Schnack1996). However, considering that nearly two-thirds of the species were found in the bathypelagic zone below 1000 m in the Arabian Sea, the number of species for the epipelagic and mesopelagic zones appears to be comparable between the two areas. Thus, a high species richness of the oncaeid copepod community in Tosa Bay (and therefore also in the Kuroshio region) can be concluded from the present study, which amounts to about half the number of known oncaeid species in the world ocean (~100 species; Böttger-Schnack et al., Reference Böttger-Schnack, Lenz and Weikert2004).
It is noteworthy that three form variants of Oncaea venusta were found in Tosa Bay, which have been observed in the western North Pacific before (Böttger-Schnack, Reference Böttger-Schnack2001; Böttger-Schnack & Huys, Reference Böttger-Schnack and Huys2004) and which have recently been assigned to different genetic lineages (Elvers et al., Reference Elvers, Böttger-Schnack, Blohm and Hagen2006). The different seasonality in occurrence of these variants suggests that the medium form, which occurred only in November, has a different physiology from the large and small forms in both August and November. Such a difference in the temporal distribution pattern of O. venusta form variants was also reported in the Red Sea (Böttger-Schnack, Reference Böttger-Schnack1990). The occurrence of O. bispinosa in Tosa Bay was also notable, because the records of this species were previously restricted to the northern and equatorial Indian Ocean (Böttger-Schnack, Reference Böttger-Schnack2002), and thus this species in Tosa Bay is new to the copepod fauna of the Pacific Ocean. Only O. zernovi, a sibling species of O. bispinosa, has previously been recorded from the western North Pacific. Further taxonomic examinations on zernovi-type oncaeids are needed for other areas in the western North Pacific, in order to elucidate their geographical distribution in the Indo-Pacific region.
Of the nine dominant species in the 0–500 m water column, Oncaea zernovi, O. tregoubovi, Spinoncaea ivlevi and S. tenuis were typically small, with body length less than 0.5 mm. These four species and O. bispinosa (a highly abundant species in November), together made up 30–40% of the total number of adults, indicating the numerical importance of these small-sized species in the oncaeid community. Other small species including O. crypta, O. parabathyalis, O. minima, O. prendeli and O. longipes showed high relative abundances especially in the mesopelagic zone between 200 and 500 m. Numerical dominance of small oncaeid species in the mesopelagic zone has also been reported from other oceanic regions (Böttger-Schnack, Reference Böttger-Schnack1995, Reference Böttger-Schnack1996, Reference Böttger-Schnack1997; Nishibe & Ikeda, Reference Nishibe and Ikeda2004). However, their ecological significance is not understood yet due to a paucity of information about feeding and reproduction (Böttger-Schnack et al., Reference Böttger-Schnack, Lenz and Weikert2004).
In the western North Pacific, available information on the abundance and species composition of oncaeids based on fine-mesh net samples is limited to that from the subarctic Oyashio region (Nishibe & Ikeda, Reference Nishibe and Ikeda2004). Comparing the present results with those in the Oyashio region, abundances in the water column from 0 to 500 m are similar between the two areas (64,100–123,600 ind m−2 in the Oyashio region), although it should be noted that the net mesh used in the study of Nishibe & Ikeda (Reference Nishibe and Ikeda2004) was somewhat coarser (0.1 mm) than the present one (0.063 mm). With regard to the species composition, 24 out of all oncaeid species found in Tosa Bay have also been reported from the Oyashio region. In the latter region, however, about half of these common species (Triconia conifera, T. minuta, T. umerus, T. parasimilis, T. dentipes, T. giesbrechti, Oncaea venusta, O. mediterranea and O. media) were assumed to be warm-water immigrants, because they occurred only when the effect of warm-core rings originating from the Kuroshio Extension was evident (Nishibe & Ikeda, Reference Nishibe and Ikeda2004). Excepting these species from the comparison, it becomes apparent that the common oncaeids between the two areas are mostly restricted to deep-water species, such as O. parila, O. englishi, O. macilenta, O. brodskii, O. longipes, O. tregoubovi, Conaea rapax and Epicalymma spp. These eight taxa probably occur widespread in the deep-water throughout the western North Pacific.
The highest abundances of oncaeid copepods in Tosa Bay corresponded with the depth where appendicularians occurred in high numbers. Previous studies have clearly shown that oncaeid copepods utilize discarded appendicularian houses as both a habitat and as a food source (Alldredge, Reference Alldredge1972; Ohtsuka & Kubo, Reference Ohtsuka and Kubo1991; Ohtsuka et al., Reference Ohtsuka, Kubo, Okada and Gushima1993; Steinberg et al., Reference Steinberg, Silver, Pilskaln, Coale and Paduan1994; Ohtsuka et al., Reference Ohtsuka, Böttger-Schnack, Okada and Onbe1996). Hence, the depth-distribution pattern of oncaeid copepods in Tosa Bay may partly be determined by that of appendicularians, although the density of discarded houses in the water column was not examined in the present study. The maximum abundances of oncaeids also agree with the depth of high chlorophyll-a concentrations observed. The major components of primary production in Tosa Bay are pico-phytoplankton and nano-phytoplankton (Ichikawa & Hirota, Reference Ichikawa and Hirota2004), which cannot be utilized directly by oncaeids due to their small size (<10 µm). As suggested by Ohtsuka et al. (Reference Ohtsuka, Böttger-Schnack, Okada and Onbe1996), oncaeids might utilize indirectly such small phytoplankton concentrated on discarded appendicularian houses.
The oncaeid copepod community in Tosa Bay could be differentiated into three distinct groups (Group 1, 2a and 2b), according to the depth layers. Group 1 is the upper epipelagic community, above the seasonal thermocline, and was predominated by Oncaea venusta, O. media and O. waldemari. Group 2a is the lower epipelagic community, found within or below the thermocline, and was dominated by the smaller oncaeid species, O. scottodicarloi, O. zernovi, O. bispinosa, Spinoncaea ivlevi and S. tenuis. Group 2b is the mesopelagic community, below 150 m or 200 m, where only minimal temperature and salinity gradients were observed. This community is represented by O. crypta, O. parabathyalis, O. minima, O. tregoubovi, O. prendeli, O. longipes and Triconia conifera. This vertical zonation of the oncaeid copepod community seems to be related to the difference in hydrographic conditions in the water column. In particular, the strong separation of the upper epipelagic community from the lower epipelagic and mesopelagic communities, which is clearly shown in the MDS ordination plot, indicates a large influence of the thermocline on vertical structuring of oncaeid assemblages in Tosa Bay.
ACKNOWLEDGEMENTS
We would like to express our gratitude to Dr R. Böttger-Schnack for her critical comments on an earlier draft of this paper. We thank the captain and crews of RV ‘Shirafuji Maru’, National Research Institute of Fisheries and Environment of Inland Sea, Fisheries Research Agency, for their help in field samplings. This study was supported partly by the ‘21st Century COE Program’, the Japanese Ministry of Education, Culture, Sports, Science and Technology, at Ehime University.