


Introduction
Analysis of atmospheric sea-level pressure (SLP) fields in the Northern Hemisphere for 1946−97 suggests a regime change in the late 1990s (Reference Johnson, Proshutinsky and PolyakovJohnson and others, 1999). The Arctic Oscillation (AO) index, defined as a time series of the leading empirical orthogonal function (EOF) mode of wintertime SLP variability (Reference Thompson and WallaceThompson and Wallace, 1998), shows a steady increase between the mid-1980s and the early 1990s, followed by a sharp fall toward the end of the century. The North Atlantic Oscillation (NAO) index described by Reference HurrellHurrell (1996) has a generally similar trend during the last two decades. The positive build-up of these indices through the early 1990s can be characterized, among other things, by an increase of cyclonic activity (in magnitude, duration and frequency) over the Nordic/Barents Seas and extending into the central Arctic Ocean. The ice-ocean response to this regime has become evident from observations made in the early 1990s, and is believed to have begun in the late 1980s (e.g. Reference McLaughlin, Carmack, Macdonald and BishopMcLaughlin and others, 1996; Reference Morison, Steele and AndersenMorison and others, 1998; Reference Steele and BoydSteele and Boyd, 1998). Some coupled models of the Arctic Ocean and sea ice have simulated similar changes in ice-ocean circulation in response to prescribed realistic atmospheric forcing (Reference Proshutinsky and JohnsonProshutinsky and Johnson, 1997; Reference Zhang, Rothrock and SteeleZhang and others, 1998; Reference Maslowski, Newton, Schlosser, Semtner and MartinsonMaslowski and others, 2000).
Two possible explanations of the cyclonic-regime shift in the late 1980s/early 1990s can be suggested. One relates the changes in the sea ice and the upper ocean circulation to an increased northward heat flux due to higher temperatures and/or stronger northward transport of Atlantic Water carried from the North Atlantic into the Arctic Ocean. This hypothesis assigns the primary source of the changes in the Arctic Ocean to variability of the global ocean thermohaline circulation, which in our experiment we define as originating in the region outside the model domain. The other possible cause of the cyclonic-regime shift in the ice-ocean system in the early 1990s involves variability of the "local" weather patterns over the northern polar region, as determined by one (AO) or possibly more principal modes of atmospheric variability. Major uncertainties remain about the role of ice-ocean processes that feed back to the Arctic atmosphere and how these interactions influence Arctic climate and its interannual to decadal variability.
Our model results discussed in the following sections are in support of the second hypothesis. Simulation of the cyclonic shift in the late 1980s/early 1990s has been described by Reference Maslowski, Newton, Schlosser, Semtner and MartinsonMaslowski and others (2000). Their model results for 1979−93 are in qualitative agreement with observations and show that the atmospheric interannual variability by itself can force a regime shift in the ice-ocean system as seen in the late 1980s/early 1990s. In this paper we emphasize results from a continuation of their earlier simulation for five more years (1994−98). In the following sections we briefly describe the coupled model and then discuss results from the late 1990s, their indication of a new trend in the ice-ocean circulation and its similarity to the state known from the 1970s/80s.
Model Description
The coupled Arctic Ocean and sea-ice model employs the Parallel Ocean Program (Reference Smith, Dukowicz and MaloneSmith and others, 1992) adapted to the pan-Arctic region and coupled to a parallel version of the Reference HiblerHibler (1979) dynamic-thermodynamic sea-ice model with viscous-plastic rheology and a zero-layer thermodynamics approximation (Reference Zhang, Maslowski and SemtnerZhang and others, 1999; Reference Maslowski, Newton, Schlosser, Semtner and MartinsonMaslowski and others, 2000). The model grid is configured in a rotated spherical coordinate system, and its resolution is 1/6° (-18 km) with 30 levels. The model domain extends from the Bering Strait through the Arctic Ocean into the subpolar North Atlantic (to −45° N), and includes the Canadian Archipelago and the Nordic, Barents and Labrador Seas. No water mass flux is allowed through the lateral boundaries, but a 30 day restoring to monthly temperature and salinity climatology is used there. Surface temperature and salinity are restored toward monthly climatologies (Reference Levitus, Burgett and BoyerLevitus and others, 1994a, Reference Levitus, Boyer and Atonovb) on timescales of 365 and 120 days, respectively. Daily-averaged operational atmospheric fields from the European Centre for Medium-range Weather Forecasts (ECMWF) for 1994−98 are used in addition to the 1979−93 re-analyzed data. An annual cycle of daily-averaged runoff data is used to account for fresh-water input from rivers. It is important to note here that the only interannual forcing in the model comes from the prescribed atmospheric fields. The model has been integrated initially for 200 years forced with 1990−94 atmospheric fields. It was then spun up for 20 years using the repeated 1979 annual cycle, which was followed by an additional two-decade integration using interannual 1979−98 atmospheric data.
Fresh-water and Atlantic Water tracers are introduced at the beginning of the 20 year spin-up with the 1979 annual cycle, and are integrated for a total of 40 years. Runoff from all the major Russian rivers, the Mackenzie River and Bering Strait inflow are marked with a separate "dye" tracer. This approach allows tracking of various water masses to determine their distribution, mixing and export from/into the Arctic Ocean. In addition, we have completed two more reference integrations. One extends the 1979 20 year spin-up for 20 more years. The other is a new experiment starting the dye-tracer concentrations from zero after the initial 200 year spin-up and integrating them for 10 years with the repeated 1997, followed by 30 years with the repeated 1998 annual cycle, and is discussed later. These two runs are to verify that the regime shifts in the 1990s are the result of the prescribed interannual variability during the last two decades, not a model drift. Compared to the end of the 20 year spin-up with the 1979 annual cycle, the ice-ocean circulation patterns remain qualitatively unchanged in the last 20 years of the 40 year run with the same atmospheric forcing. This indicates that the model drift (if any) is negligible and cannot explain the modeled variability in the Arctic Ocean during 1979−98. Additional details about the model, forcing fields, experiment design and earlier results can be found in Reference Zhang, Maslowski and SemtnerZhang and others (1999), Maltrud and others (1998) and Reference Maslowski, Newton, Schlosser, Semtner and MartinsonMaslowski and others (2000).
Results
In this section we describe model results as they represent large-scale regime shifts in the sea-ice and the upper ocean circulation during the last two decades. These results are analyzed in a qualitative sense, mainly to determine relative variability and sign of simulated changes, and not the absolute magnitudes of various properties. We argue that this approach allows for improved understanding of real changes in the ice-ocean system as it responds to the prescribed realistic atmospheric variability.
In the earlier integration covering the years 1979−93, Reference Maslowski, Newton, Schlosser, Semtner and MartinsonMaslowski and others (2000) have simulated an eastward shift in the sea-ice and the upper ocean circulation of the late 1980s/early 1990s, which is in qualitative agreement with observations. Their sea-ice results for the late 1970s and 1980s show the typical large-scale anticyclonic Beaufort Gyre covering the entire Canadian Basin, and theTranspolar Drift aligned along the Lomonosov Ridge. By contrast, a cyclonic sea-ice drift over most of the Makarov Basin and a significantly reduced anticyclonic Beaufort Gyre has been simulated in the early 1990s. The Transpolar Drift in the latter case shifted its position eastward to over the Alpha and Mendeleyev Ridges. The upper halocline water, as represented by fresh-water dye tracers, has retreated from the Eurasian Basin following the general trend imposed by the sea-ice drift of the late 1980s/early 1990s. The Atlantic Water tracer accumulates in the Makarov Basin by the early 1990s. Results from the 40 year reference run with the repeated 1979 annual cycle do not show any of these changes, which proves that the modeled ice-ocean shifts in the primary run are in response to the prescribed atmospheric interannual variability.
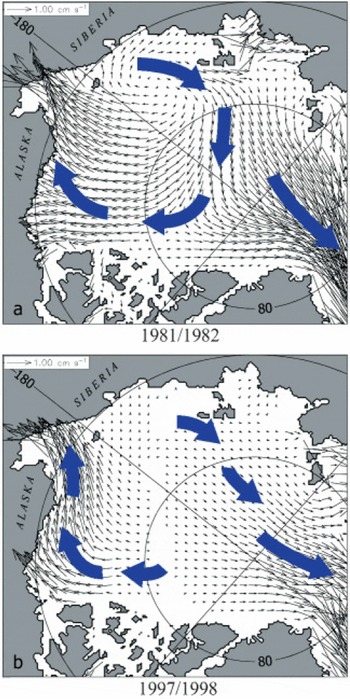
Continuation of the interannual run for five more years modifies the ice-ocean conditions of the early 1990s in such a way that they begin to resemble their state from the 1970s/ 80s, suggesting a reversal of the regime associated with the early 1990s. To provide a clear picture of undergoing changes, we have calculated differences between the 2 year means of ice velocity for 1991/92−1981/82 (Fig. 1a) and 1997/98−1991/92 (Fig. 1b). In Figure 1a we obtain a cyclonic pattern of the sea-ice drift anomaly covering the entire Arctic Ocean. In Figure 1b the situation is exactly the opposite. The first case shows an eastward regime shift of the sea-ice circulation, and the second shows a westward shift. In Figure 1c the difference between the mean ice drift of 1997/98 and 1981/82 is shown. There are significant differences in some regions, but with no particular pattern. In addition, a comparison of the actual ice-drift fields of the early 1980s (Fig. 2a) and the late 1990s (Fig. 2b) reveals a similarity between the two circulation regimes. A predominantly anticyclonic drift pattern in the Canadian Basin and the alignment of the Transpolar Drift transport through the Eurasian Basin in Figure 2b are not exactly the same as in Figure 2a. They are markedly different, though, from the mean ice drift of the early 1990s (see Reference Maslowski, Newton, Schlosser, Semtner and MartinsonMaslowski and others, 2000, fig. 2b).
Two-year-average ice-motion difference fields (cm s−1): (a) 1991/92−1981/82, (b) 1997/98−1991/92 and ( c) 1997/ 98−1981/82 depth contours are at 500 and 2500 m.

Two-year-average ice motion (cm s−1) (a) 1981/82, displaying strong anticyclonic ice motion and outflow; (b) 1997/98, displaying weaker yet similar anticyclonic flow.
The distribution of fresh water as represented by dye tracers provides important information about the circulation at the surface down to the upper halocline layer, and about the effectiveness of sea-ice cover in transferring vorticity from the atmosphere to the ocean. The surface ocean salinity is also an important parameter from the point of view of sea-ice thermodynamics, as it determines the stability of the upper ocean and the freezing-point temperature of sea water. The sea-ice drift responds to atmospheric forcing on much shorter time-scales than the ocean. Hence, even in the upper ocean the change due to atmospheric variability can be delayed. The ocean requires longer time-scales (interannual to decadal) than sea ice to integrate synoptic to seasonal weather variability and to respond to it. To partly account for this delayed effect we analyze the distribution of total fresh-water tracers in the upper 20 m at the end of 1983, 1993 and 1998 (Fig. 3a−c, respectively).
Surface ocean circulation and total fresh-water tracer distribution (per cent concentration, 0−20 m), (a) at the end of 1983, (b) at the end of 1993 and (c) at the end of 1998 depth contours are at 500 and 2500 m.

The surface ocean circulation at the end of 1983 (Fig. 3a) resembles the well-known pattern of the sea-ice drift from the late 1970s/1980s. The schematic circulation pattern at a given time has been determined from animations of monthly tracer distribution for 1979−98 (www.oc.nps.navy.mil/sbi). The anticyclonic Beaufort Gyre with minimum tracer concentrations in the center extends over the entire Canadian Basin, and its northernmost portion follows the Lomonosov Ridge axis. The fresh waters from the Chukchi and East Siberian shelves flow westward and converge with the fresh waters from the Kara and Laptev Seas to enter the deep basin in the area where the Lomonosov Ridge merges with the Siberian shelves. Most of the fresh water from the Kara Sea is advected eastward towards the East Siberian Islands. The flow splits there into two branches, one continuing into the Laptev Sea through Vilkitsky Strait, and the other following the western side of the islands into the Voronin Trough to enter the Nansen Basin. Waters from the Laptev shelf enter the Eurasian Basin in two areas: the southern end of the Lomonosov Ridge, and along the continental slope to the north of the East Siberian Islands. In the Chukchi Sea there is a strong eastward flow along the northern coast of Alaska exiting into the Beaufort Sea along Barrow Canyon, where it merges with the westward boundary currents of the Beaufort Gyre. The Mackenzie River tracer spreads mainly to the east and then to the south into the Canadian Archipelago, but there is little evidence of a strong tracer transport into Baffin Bay. The dominant path for fresh-water tracer export appears to be through Fram Strait.
This picture changes dramatically by the end of 1993 (Fig. 3b). The most noticeable change in the distribution of fresh-water tracers is their significant accumulation in the Makarov Basin. A cyclonic shift in the surface ocean circulation of the central Arctic is clear. This pattern includes the increased eastward flow from the Kara Sea (through Vilkitsky Strait) and from the Laptev Sea towards the Mendeleyev Ridge. A major portion of fresh waters from the Siberian shelves enters the deep basin there to be advected roughly along the Mendeleyev and Alpha Ridge system, towards Fram Strait. There are still high concentrations of tracers and flow along the Lomonosov Ridge. Another area of significant change in fresh-water tracer concentrations is over the Chukchi Cap and generally in the Beaufort Sea. Finally, a significantly increased tracer transport exists through the Canadian Archipelago. There is a well-established eastward boundary current carrying the fresh waters from the Chukchi Sea and the Mackenzie River into the Canadian Archipelago and towards Baffin Bay. This flow appears to develop in response to a reduced horizontal shear resulting from a partial collapse and/or weakening of the anticyclonic Beaufort Gyre circulation.
Five years later, by the end of 1998, the concentration of fresh-water tracers in the Arctic Ocean suggests more changes in the upper ocean circulation (Fig. 3c). Only half a decade later the eastward shift in the surface circulation of the central Arctic Ocean is not present. The dominant freshwater transport along the Lomonosov Ridge is re-established, similarly to the regime described in Figure 3a. High tracer concentrations are found in the Eurasian Basin, which again starts receiving most of the fresh water from the Kara and Laptev Seas. An increased accumulation of tracers in the western Kara Sea and even some in the southern Barents Sea occurs when at the same time there is only a limited eastward flow through Vilkitsky Strait to the Kara Sea. Much of the fresh water from the Chukchi and East Siberian Seas flows westward towards the Lomonosov Ridge, but there is still significant flow exiting the shelves eastward over the Chukchi Cap and continuing northward across the Canadian Basin. The eastward boundary current along the north slope of Alaska and Canada present in Figure 3b seems to be weakening, possibly in part due to the increased horizontal velocity shear, which might explain northward spreading of high tracer concentrations in that region. This also results in clear reduction of the fresh-water transport through the Canadian Archipelago. In general, the large-scale picture of the surface distribution of fresh-water tracers begins to resemble the one described at the end of 1983 (Fig. 3a). The remaining differences suggest that the upper ocean requires more than 5 years to move from one regime to another.
In order to determine the trend and spatial distribution of fresh-water tracer anomalies, we calculated differences in tracer concentrations for 1993−83 (Fig. 4a) and 1998−93 (Fig. 4b). The changes that resulted from the cyclonic shift between 1983 and 1993 are shown in Figure 4a. Positive/ negative anomalies indicate regions with higher/lower concentrations of fresh-water tracers in 1993 than in 1983. It is evident from this figure that in 1993 significantly more fresh water accumulated in the Canadian Basin and in the Makarov Basin in particular. A major deficit of fresh waters throughout the Eurasian Basin, and the northward shift of high tracer concentrations in the Chukchi and East Siberian Seas balance this surplus. The primary path for fresh-water exit from the Siberian shelves is from the Laptev Sea northeastward toward the Mendeleyev Ridge. The dominant route of fresh-water export from the Arctic Ocean seems to be through the Canadian Archipelago to Baffin Bay. Increased export through Fram Strait is also apparent, which might be in part a result of a shorter tracer-residence time in the Arctic Ocean in the early 1990s than in the 1980s.
Totalfresh-water tracer anomaly distribution (percent concentration, 0−20 m), (a) 1993−83 and (b) 1998−93 depth contours are at 500 and 2500 m.

The fresh-water tracer anomalies between 1998 and 1993 are shown in Figure 4b. The main part of the Arctic Ocean has anomalies of opposite sign when compared with those from Figure 4a. Most importantly there is an increased accumulation of fresh water in the Eurasian Basin and a large deficit in the Makarov Basin. A preferred pathway for fresh-water exit from the Siberian shelves is from the East Siberian Sea toward the Lomonosov Ridge and from the Kara and Laptev Seas northward into the Eurasian Basin. High positive anomalies from the Makarov Basin in 1993 seem to move southward and then eastward in the Canadian Basin by the end of 1998. Negative tracer anomalies exist both throughout the Canadian Archipelago and in the Nordic Seas. This indicates that overall export of fresh water from the Arctic Ocean decreased, which in turn suggests a longer residence time for these water masses in the late 1990s. It is important to note that the pattern of positive anomalies shown in Figure 4b to some degree resembles the modeled fresh-water tracer distribution from 1983 (Fig. 3a). Since Figure 4b can be interpreted as showing a 5 year trend after 1993, its resemblance to the actual circulation regime from the 1970s/80s leads us to predict that we should return to similar conditions within 5 years or so. This is assuming an oscillatory behavior of the Arctic climate.
Discussion
To verify that the results of the 1979−98 interannual integration are actually the outcome of the prescribed atmospheric variability and not the model drift, we compare them against the 40 year reference integration with the repeated 1979 atmospheric forcing. The length of the reference run was chosen to be the same as in the interannual simulation, so years 35 and 40 of the reference run are equivalent to 1993 and 1998 of the interannual integration. The spreading of the Atlantic Water (AW) tracer from the Greenland-Scotland Ridge is confined to the Eurasian Basin throughout the reference simulation. After 15 years of the interannual run (i.e. at the end of 1993) the AW tracer has crossed the Lomonosov Ridge and accumulated in the Makarov Basin (see Reference Maslowski, Newton, Schlosser, Semtner and MartinsonMaslowski and others, 2000, fig. 1b). This indicates that the change is forced by atmospheric variability, and if there were no year-to-year changes in the prescribed atmospheric fields the model would not simulate the eastward shift of the sea-ice and ocean circulation in the early 1990s. This also suggests that within 15 years the vertical transfer of horizontal momentum can reach the Atlantic Layer from the atmosphere through the sea ice and the upper ocean.
At the end of 1998 the AW tracer still dominates in the Makarov Basin, but at the same time we see a significant increase in the recirculation of this tracer in the Eurasian Basin, as compared to 1993 (Fig. 5). The difference in the AW tracer concentrations at 200 m between the end of 1998 and 1993 still has elevated positive concentrations over the Alpha and Mendeleyev Ridges and in the northern Beaufort Sea. At the same time, higher concentrations of AW tracer are also simulated in the Eurasian Basin, where they were absent at the end of 1993 (see Reference Maslowski, Newton, Schlosser, Semtner and MartinsonMaslowski and others, 2000, fig. 1c). Our interpretation of these results is that a new trend modeled in the circulation of sea ice and the surface ocean becomes apparent at the Atlantic Layer depths 5 years later. The elapsed time is too short to allow a complete regime shift even at the surface. We may need to wait for several more years before we can positively verify the model prediction. In the meantime, it is would be essential to continue collection of ice and ocean datasets from at least a few key regions around the Arctic Ocean in order to allow critical verification of model results, as occurred in the 1990s. According to the model, the most important areas for observations should include the Makarov and Eurasian basins, the Chukchi/Beaufort shelves and slopes and the Canadian Archipelago/Baffin Bay.
Atlantic water tracer anomaly distribution (per cent concentration, 180−220 m) between the end of 1998 and 1993 depth contours are at 500 and 2500 m.

Having this powerful tool (i.e. the ice-ocean model), we can further explore the trend of changes modeled after 1993. A new experiment that helps to shed more light on this topic is another integration for several decades with the repeated 1997/98 atmospheric cycle. We have completed this experiment starting from the end of the 200 year initial spin-up, and integrated the model for 40 years using the 1997 atmospheric data for the first decade and then continuing with the repeated 1998 cycle. Through the end of this integration the AW tracer remains contained within the Eurasian Basin, which is a quantitatively similar result to the one we obtained with the repeated 1979 atmospheric forcing. Neither the model integration with the 1979 nor that with the 1998 repeated annual cycle of atmospheric fields leads to a simulation of the cyclonic shift modeled in the late 1980s/early 1990s. At the same time there is an indication from the interannual run that the circulation of sea ice and the upper ocean is heading back towards the conditions known from the 1970s/80s after a major eastward shift in the early 1990s. Completion of nearly two regime shifts in two decades suggests a decadal climate oscillation in the Arctic region. An alternative explanation of such results could be that the late 1980s and the early 1990s were anomalous years in otherwise "climatologically normal" longterm Arctic conditions. At least a century-long integration with realistic interannual atmospheric forcing would be required to verify the latter hypothesis and/or to determine cyclic behavior of Arctic climate in a statistical sense.
Summary and Conclusions
Using a regional, coupled ice-ocean model of the pan-Arctic region forced with the prescribed atmospheric fields from ECMWF for 1979−98 we have simulated two large-scale shifts in the ice-ocean circulation. A cyclonic shift is modeled in the late 1980s/early 1990s in qualitative agreement with observations. A new opposite trend in the late 1990s is predicted, though it is yet to be verified with data. A continuation of model integration beyond the year 2000 with realistic atmospheric forcing is necessary to conclusively determine the pattern of recent changes. Atmospheric variability appears to be the dominant dynamic driver of modeled changes. The sea-ice cover appears to be an effective medium for vertical momentum transfer from the atmosphere into the upper ocean. The energy flux from the Arctic atmosphere into the sea ice and ocean provides sufficient forcing to drive changes qualitatively similar to those known from hydrographic observations. At the same time, the absence of the global interannual thermohaline forcing signal from outside of the model domain suggests that its influence on the recently observed changes has a secondary role. Such a conclusion, as yet unverified, requires use of global ice-ocean and climate models with proper representation of the Arctic Ocean and feedback processes between the atmosphere, the sea ice and the ocean underneath. On the other hand, results from this regional coupled ice-ocean model prove that global ocean and climate studies can no longer neglect the Arctic Ocean and its multi-year ice cover.



