Introduction
For at least a century, modeling has played an integral and critical role in alloy design. Two-dimensional maps, equations, and rules are some of the most popular and utilized forms of modeling. Ashby maps have facilitated materials selection, enabling comparisons between classes of alloys against measurable performance indices, such as specific stiffness and yield strength.Reference Ashby and Cebon1 The Hall–Petch scaling law has been used through the years to relate material strength/hardness to grain size in a polycrystal.Reference Hall2,Reference Petch3 The Hume–Rothery rules are widely used to guide the choice of alloying elements to indicate whether the alloy will be single or multiphase.Reference Hume-Rothery and Powell4
While the insights afforded by straightforward rules, expressions, and maps are greatly appreciated, there continues to be a need to develop better materials models. Alloy design has been stretched to encompass more than simply choosing which and how many solute atom(s) to add. Additions of just a few percent of alloying elements can profoundly affect the activation of nanoscale mechanisms (operating over Ångström to nanometer scales) when the alloy is deformed. With heat treatment and mechanical processing, these atomic-scale element additions can affect the evolution of the internal microstructure (characteristic length scales > nanometer scale). The resulting alloy microstructures are often complex, consisting of multiple phases with each phase containing more than one type of precipitate, particle, or interface. Changes in any of these features can, in turn, influence a broad suite of critical bulk structural properties (samples > millimeter scale), such as strength, ductility, fatigue, fracture, and creep. In order to continue to benefit the design and optimization of alloys, materials models need to be multiscale, spanning from atoms to the continuum.
A full-spectrum, “atoms-to-continuum,” multiscale materials model (MMM) for alloy design, however, does not exist. Atomic-scale models that treat a polycrystal as a collective arrangement of atoms exist. Continuum models that treat the sample or structure as a deformable continuum also exist. The modeling components that are missing lie in the intermediate scales, between the nanometer and millimeter scales, collectively referred to as the mesoscale. Crossing the vast mesoscale gap is where MMM meets its greatest challenges.
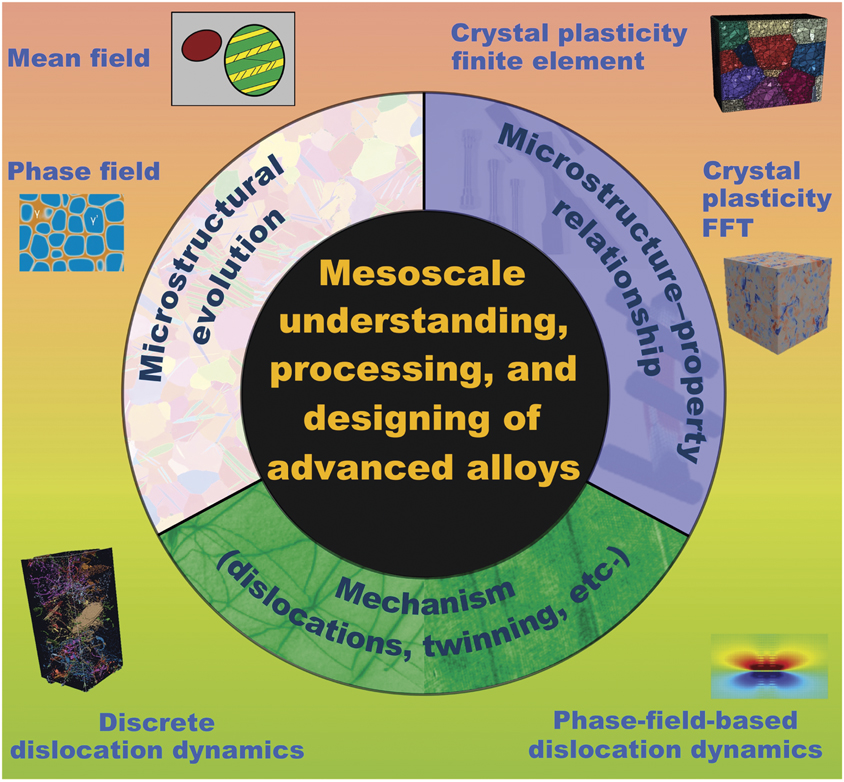
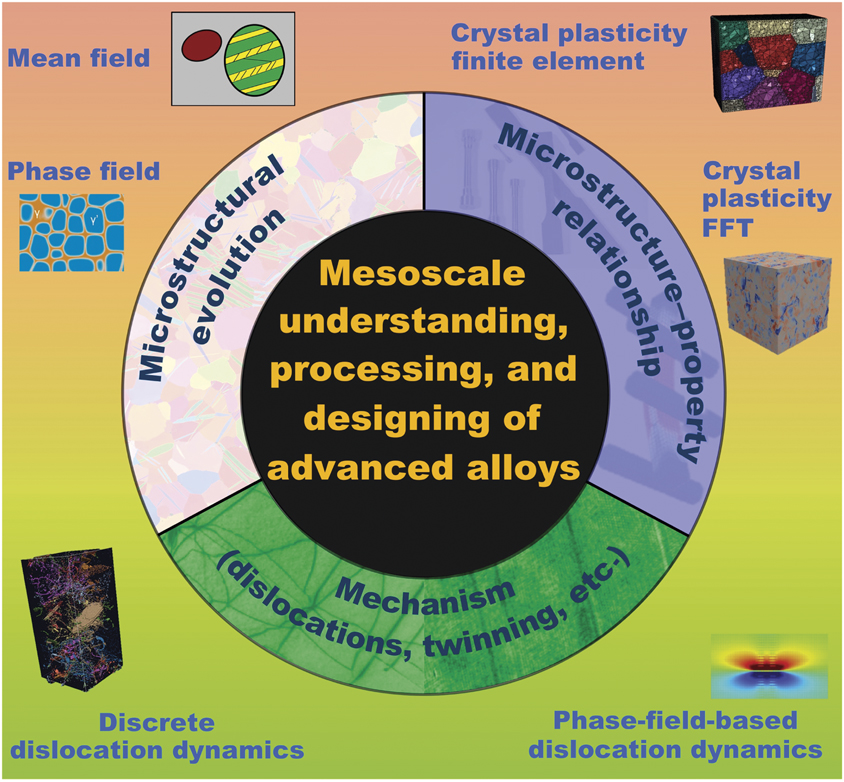
Figure 1 displays a current view on mesoscale MMMing for advanced alloys. At its core (central circle), a mesoscale MMM intends to benefit alloy design by aiding in the understanding, processing, and design of new materials. These MMMing efforts tend to pursue one of three goals (intermediate ring). Some MMMs are built to improve and discover deformation mechanisms. Other MMMs are developed to simulate microstructural evolution under a specific manufacturing process so they can identify pathways to achieve target microstructures. Last are MMMs that focus on determining microstructure–materials response relationships in an effort to address the question, “which microstructures are the ‘right’ ones?” At the periphery (Figure 1) lie the multitude of mesoscale multiscale models to date that treat more than one length scale in the mesoscale spectrum. This article aims to highlight some of these MMMing achievements for alloy design.
Current view of the state of multiscale materials modeling (MMM) on the mesoscale. Note: FFT, fast Fourier transform.
Coupling the thermodynamics and mechanics of precipitation
Precipitation hardening is well established as one of the most efficient strategies to increase the yield strength of alloys. Precipitates are metastable intermetallic particles with sizes ranging from a few to a few hundred nanometers that appear during aging of alloys. Improvements in alloy strength depend on the precipitate size, shape, and spatial distribution, as well as how moving dislocations interact with them. In their article in this issue, Nie and WangReference Nie and Wang5 highlight many recent achievements in precipitation design for improved lightweight alloys.
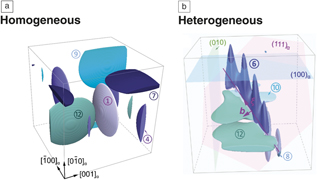
Multiscale modeling strategies can aid in the design of novel precipitation hardened alloys by replacing costly experimental trial and error approaches. Recently, one such MMM was built for the precipitation process in Al-Cu alloys.Reference Rodríguez-Veiga, Bellón, Papadimitriou, Esteban-Manzanares, Sabirov and Llorca6–Reference Santos-Güemes, Esteban-Manzanares, Papadimitriou, Segurado, Capolungo and Llorca11 At its foundation is an analysis of thermal stability for each kind of precipitate, which is accomplished by first-principles calculations of the Helmholtz free energy.Reference Liu, Papadimitriou, Lin and Llorca7 Precipitate nucleation and growth are then predicted, respectively, via classical nucleation theory and phase-field mesoscale simulations (Figure 2).Reference Liu, Papadimitriou, Lin and Llorca7,Reference Liu, Bellón and Llorca8 The former is used to predict the initial dimensions and shape of the precipitate nucleus. When nucleation is homogeneous, it calculates the chemical, interfacial, and elastic driving forces using computational thermodynamic data, first-principles calculations, and lattice correspondence during the transformation. In the likely situation of heterogeneous nucleation—that is, when the stress fields from other precipitates, dislocations, or defects, can alter the nucleation process—such stresses can be taken into account in the multiscale framework. Once the initial dimensions and shape of the precipitate nucleus have been determined, growth of the precipitate to its stable shape is calculated using the phase-field method.Reference Liu, Bellón and Llorca8
Final precipitate size and morphologies predicted from multiscale simulations elucidating the differences that can be expected in high-temperature precipitate homogeneous and heterogeneous nucleation, and growth in Al-Cu alloys. Note: circled numbers, precipitate variants; b, Burgers vector.Reference Liu, Bellón and Llorca8

Multiscale simulations from this strategy can reveal the stability and growth sequences of precipitation, as well as the expected final precipitate microstructure. Figure 2 demonstrates the profound effect dislocations can have on the final equilibrium shape of precipitates, being flat disks when nucleation is homogeneous versus cones and platelets with morphologically rough edges when nucleation is heterogeneous.Reference Liu, Papadimitriou, Lin and Llorca7,Reference Liu, Bellón and Llorca8
Chemo-mechanical interactions between gliding dislocations and precipitates
The amount of strengthening provided by precipitates in an alloy depends on atomistic and mesoscale aspects of the mechanisms used by dislocations to bypass these precipitates. While a few bypass processes have been proposed and studied, the mechanism is usually not known a priori since it depends on strong couplings among the geometric, chemical, and mechanical properties (e.g., crystal structure, composition, stiffness, lattice orientation) of the precipitates.
Ni-Al-based superalloys provide one prominent example of the need to consider both mechanical and chemical aspects in the processes underlying dislocation/precipitate interactions. While alloying provides for a microstructure consisting of precipitates (e.g., the  ${\rm{\gamma '}}$ phase), further improvements in strength could be gained by adding solute elements, such as W, Re, Co, and Cr. However, solute segregation to defects, such as dislocations and stacking faultsReference Koizumi, Nukaya, Takeshi, Suzuki, Kurosu, Li, Matsumoto, Sato, Tanaka and Chiba12–Reference Kontis, Li, Collins, Cormier, Raabe and Gault15 could instead lead to precipitate dissolution, enhanced directional coarsening (“rafting”), and degradation of mechanical properties. Due to the chemo-mechanical couplings involved, calculation of the mechanisms and associated critical energies and stresses required by dislocations to bypass the precipitate call for a multiscale strategy.
In the last few decades, multiscale models combining atomistic calculations and phase-field modeling have been developed to simulate dislocation motion.Reference Wang and Li16–Reference Mianroodi, Hunter, Beyerlein and Svendsen18 To treat alloys, the energetics used in the phase-field dislocation simulations have been advanced to include chemo-mechanical couplings.Reference Shi, McAllister, Zhou, Detor, DiDomizio, Mills and Wang19,Reference Mianroodi, Shanthraj, Kontis, Gault, Raabe and Svendsen20 In these models, the roles played by morphology and chemistry in the mechanisms that underlie dislocation–interface interactions are encompassed in the energetic terms used in the master energy function of the phase-field method.
Figure 3 shows a result from one recent example in this class.Reference Mianroodi, Shanthraj, Kontis, Gault, Raabe and Svendsen20 The MMM combines a general phase-field-based chemo-mechanical methodologyReference Svendsen, Shanthraj and Raabe21 with phase-field dislocation modeling to simulate dislocation shearing of a precipitate in Ni-Al-Co. Under an applied stress, the dislocation glides in the matrix toward the precipitate. Before reaching the precipitate, the dislocation dissociates into two Shockley partial dislocations and is decorated by Co (Figure 3a). At the  ${\rm{\gamma }}$–
 ${\rm{\gamma '}}$ interface in Figure 3b, these partials recombine into a perfect edge dislocation before they enter and shear the precipitate. As the dislocation glides into the
 ${\rm{\gamma '}}$ precipitate, it deposits Co on the
 ${\rm{\gamma }}$–
 ${\rm{\gamma '}}$ interface (Figure 3b) as well as drags Co into the precipitate (Figure 3c). Ultimately, as seen in Figure 3d, Co segregation enriches the faults left by the shearing process and depletes Co in the precipitate
 ${\rm{\gamma '}}$ matrix.
(a–c) Shear of  ${\rm{\gamma '}}$ precipitate by Co decorated
 $\left\langle {110} \right\rangle /2$ edge dislocation in the
 ${\rm{\gamma }}$ phase. Dark blue and dark red represent 3.2 and 6.0 at.% Co, respectively. All faults are separated by partial dislocations. The scale is the same in (a–c). (d) Fault energy results for a dissociated
 $\left\langle {110} \right\rangle /2$ dislocation in Ni3Al-Co (red curve). The segregated Co concentration profile is shown in blue. Results in (a–c) are for a moving dislocation, and those in (d) for a static dislocation.Reference Mianroodi, Shanthraj, Kontis, Gault, Raabe and Svendsen20 Note: CSF, complex stacking fault; APB, antiphase boundary.

The coupling between dislocation shearing and solute segregation could promote precipitate dissolution, directional coarsening (“rafting”), loss of strength, and lifetime reduction. The insights obtained by such multiscale simulations can be useful for optimizing the alloying composition to delay or inhibit such effects.
Moving dislocations across scales
One computational approach that can provide understanding and prediction of the deformation of alloys is the three-dimensional discrete dislocation dynamics (3D DDD) simulation method. This mesoscale technique was developed to model plastic deformation as a result of collective motion of many dislocations gliding in a crystal.Reference Kubin, Canova, Condat, Devincre, Pontikis and Bréechet22–Reference Weygand, Friedman, Van der Giessen and Needleman25 In recent years, DDD has been applied to model microstructure-response relationships in superalloys and, in particular, to explore the effects of several dislocation/precipitate interactions in a crystal.Reference El-Awady, Fan, Hussein, Weinberger and Tucker26
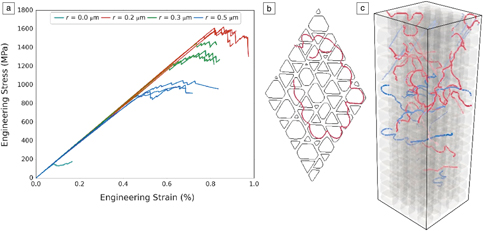
Figure 4a shows the predicted response of Ni-based superalloys as a function of the size of cuboidal precipitates within single crystals of the polycrystalline alloy. In these calculations, this mesoscale technique advantageously accounts for randomness in the distribution and shapes of the precipitates in the crystal, the evolution of a collection of dislocations, and the numerous precipitate–dislocation interactions. The model reveals that the precipitate size effect is due to a change in the dislocation–precipitate bypass mechanism with increasing precipitate size (see Figure 4b–c).
The effect of precipitate size, r, on the (a) engineering stress–strain response; and (b) dislocation density versus engineering strain, for freestanding single-crystal Ni-based superalloy microcrystals. The simulation cell volume was fixed at 1 × 1 × 3 μm3, the precipitates were cuboidal with a volume fraction of 0.7, and the antiphase boundary energy was 0.2 J/m2. The precipitate distribution and the dislocation network at the onset of the plastic flow are shown in (b, c) for r = 0.2 μm and 0.5 μm, respectively. The dislocation lines in (b, c) are colored according to their slip system.Reference Hussein, Rao, Uchic, Parthasarathy and El-Awady27

Three-dimensional DDD simulations have been successfully used to quantify many other important microstructure–strength relationships, such as a nearly independent relationship with grain size (compared to the strong precipitate size effect), a linear increase with precipitate volume fraction, and an approximately square-root relationship with antiphase boundary (APB) energy. Such strength–microstructure relationships can improve calculations of deformation and failure in simulations that treat larger length scales and time scales, such as crystal plasticity (CP) simulations. Three-dimensional DDD simulations have also been advanced to track the formation and destruction of intrinsic and complex faults,Reference Hussein, Rao, Uchic, Parthasarathy and El-Awady27 processes that are strongly dependent on superalloy composition. Another noteworthy extension is the inclusion of misfit stresses resulting from significant lattice mismatch between two phases.Reference Yang, Li and Huang28,Reference Huang, Zhao and Tong29
Using alloying to improve formability in magnesium
Hexagonal close-packed (hcp) metals, such as Mg, Zr, and Ti and their alloys, are being considered for a broad range of high-performance structural applications.Reference Gao, Fivel, Ma and Hartmaier30,Reference Tomé, Beyerlein, McCabe, Wang and Horstemeyer31 They bear many attractive intrinsic properties, such as low specific density, fatigue resistance, biocompatibility, corrosion resistance, and radiation resistance. Successful incorporation of hcp alloys into engineering designs has been hindered because their structural behavior is challenging to predict.
Mg alloys represent one prominent and current example. For several decades, they have drawn attention as an ideal candidate for lightweight transportation due to their low density and high specific strength.Reference Kim32,Reference Kulekci33 However, their poor formability at room temperature limits widespread use.Reference Suh, Shim, Shin and Kim34 For Mg, there are several modes of slip, with the common modes being basal 〈a〉, prismatic 〈a〉, and pyramidal 〈c + a〉. Each is distinct in terms of crystallographic slip plane and direction as well as critical resolved shear stress (CRSS) to activate it.Reference Partridge35,Reference Yoo36 Poor formability is a consequence of the significant differences in slip mode CRSS.
Alloying can increase or diminish CRSS differences. In recent work, a multiscale polycrystal plasticity model (MPPM) was employed in an attempt to comprehensively explore solute effects on the CRSS values and on formability.Reference Arul Kumar, Beyerlein and Tomé37 At the highest length scale, the model utilizes a micromechanics formulation to relate the deformation of an aggregate of crystals to the deformation of an individual crystal. A grain-scale model for deformation twinning has been used to account for division of a crystal into twinned and untwinned crystalline domains. Each domain is permitted to deform by crystallographic slip. Finally, the CRSS values for slip for a particular alloy are used as input and these are allowed to evolve with local amounts of slip strain.
CRSS differences among slip modes can be quantified via a plastic anisotropy (PA) measure. Presuming that basal slip is the easiest slip mode, typically the case for Mg alloys, this measure is given as:
 $${\rm{PA = }}{{\tau _0 ^{Prismatic} - \tau _0 ^{Basal} } \over {\tau _0 ^{Twin} - \tau _0 ^{Basal} }},$$
where τ0 is CRSS and the superscript indicates the slip or twin mode. MPPM was employed to simulate the plastic response and extract quantitative measures associated with formability for a number of high-performance Mg alloys ranging broadly in PA measure.
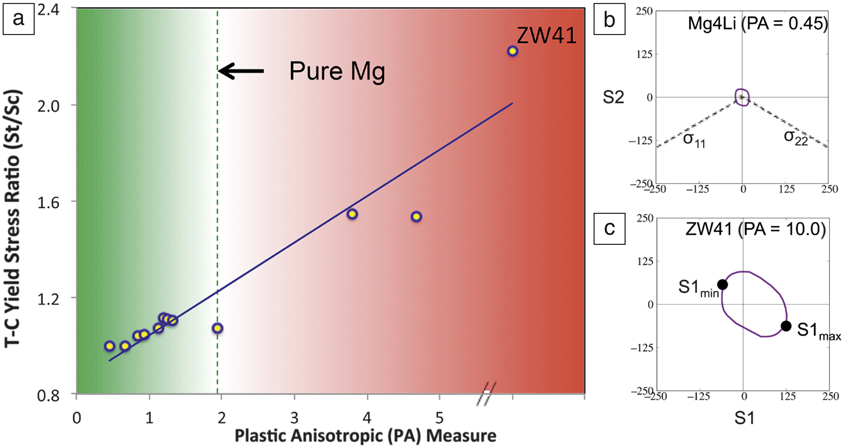
Figure 5a presents the calculated ratios of the tensile yield stress to the compressive yield stress. Overall, the values are consistent with experimental measurements.Reference Lentz, Klaus, Coelho, Schaefer, Schmack, Reimers and Clasuen38–Reference Yi, Bolen, Heineman and Letzig44 The important finding in Figure 5a is the strong relationship between the calculated tension-compression yield stress ratio and the plastic anisotropy PA measure.
(a) Effect of alloying addition on tension-compression (T–C) yield stress ratio for magnesium alloys. Magnesium alloys with different alloying elements are characterized by the plastic anisotropic (PA) measure. (b, c) Polycrystal yield surface (π-plane projection) for different magnesium alloys at 3% compressive strain along the rolling direction.Reference Arul Kumar, Beyerlein and Tomé37 (b) The Mg4Li alloy has one of the smallest PA measures, showing low tension-compression yield stress asymmetry; (c) the ZW41 alloy has the largest PA measure and concomitantly large tension-compression asymmetry.

As another measure of formability, the MPPM was used to calculate the polycrystal yield surfaces (PCYSs) of many alloys. A yield surface is a five-dimensional surface in the six-dimensional space of stresses. When the stress state lies on the surface, the material is said to have reached its yield point and to have become plastic. Figure 5b–cReference Arul Kumar, Beyerlein and Tomé37presents calculated π-plane projections of the PCYSs for pure Mg and two different Mg alloys. A remarkable feature is the broad range of yield stresses that can be achieved via alloying. The Mg4Li alloy (96 wt% Mg and 4 wt% Li) has the smallest PCYS (Figure 5b) and the ZW41 alloy (0.4 wt% Zr, 3.7–4.3 wt% Y, 2.4–4.4 wt% Nd, with the rest being Mg) has one of the largest (Figure 5c). Asymmetries in the PCYSs reflect that plastic anisotropy, and as anticipated, the level of asymmetry, scales with the PA measure. In revealing a strong correlation between the PA measure for slip and key measures for formability, MPPM introduced a new measure that can be used to screen for alloys that would potentially be formable.
Hierarchical microstructure-sensitive structural properties
The structural properties of today’s most advanced alloys are highly dependent on a hierarchy of material microstructure, with length scales ranging from the nanoscale (e.g., small precipitates, dislocations, interfaces) to the microscale (e.g., large precipitates, dislocation cell substructure) and above (e.g., arrangement of phases and grains).Reference McDowell, Shin and Saal45 As we have seen, Ni-based superalloys are an outstanding example. Within the mesoscale regime alone, their microstructures involve three length scales: (1) the subgrain scale, including the size/shape of γ′ precipitates and their spacing within the γ matrix; (2) the grain scale, such as the size and crystallographic orientations of grains; and (3) the polycrystal scale concerning how grains are aggregated.Reference Keshavarz and Ghosh46 Other families of high-performance alloys bearing such complex, multiphase microstructures include Co-based superalloys, Al-Cu alloys, Mg-Ca-Zn alloys, and twinning-induced and transformation-induced plasticity steels.Reference Liu, Papadimitriou, Lin and Llorca7,Reference Mianroodi, Shanthraj, Kontis, Gault, Raabe and Svendsen20,Reference Luo47,Reference De Cooman, Estrin and Kim48
Many MMMs for the plastic deformation response of polycrystalline alloys employ crystal plasticity (CP) theory. CP theory relates the distortions of a strained crystal to slip on crystallographic slip systems. Ideal for microstructure-sensitive calculations in alloys are combinations of CP with 3D full-field, spatially resolved mechanics techniques, such as CP finite element (CPFE) or CP fast Fourier transform (CP-FFT) solvers. To date, these MMMs have been advanced so that they span a wide range of scales, from nonuniform, time-varying applied fields (such as in mechanical shaping processes) to the sample, the multiphase microstructure at the mesoscale, granular features such as texture and grain size within each phase at the microscale, and the crystal structure and associated operation of slip and twinning at the nanoscale. They explicitly couple the effects of microstructure morphology and crystallinity in the calculation of stress and strain evolution inside the grains and at the boundaries and interfaces.
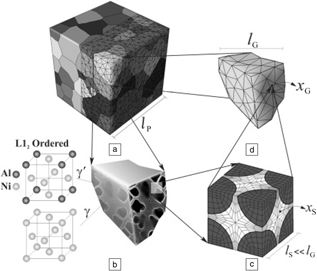
Application of CPFE-based modeling for Ni-based superalloys, including multiscale microstructures, can be found in many recent works.Reference Bagri, Weber, Stinville, Lenthe, Pollock, Woodward and Ghosh49,Reference Pinz, Weber, Lenthe, Uchic, Pollock and Ghosh50 Keshavarz and GhoshReference Keshavarz and Ghosh46 developed a two-scale CPFE model to incorporate three mesoscale microstructures (Figure 6). At the subgrain scale, mechanistic processes, such as dislocation evolution with non-Schmid effects and temperature dependence, APB shearing of γ′ precipitates, and microtwinning, have been taken into account. (Non-Schmid effects mean that dislocation slips are not initialized on slip planes with the largest resolved shear stress.) At the grain and polycrystal scales, they introduced an activation energy (AE)-based CP model that homogenized subgrain scale responses; a model for geometrically necessary dislocations was also developed. The MMM was able to reproduce the tension-compression asymmetry and temperature-dependent change in the type of slip mode that dominates, an unusual characteristic of these alloys that had been a challenge to predict.
Schematic representation of multiple scales in the development of a crystal plasticity finite element (CPFE) model for Ni-based superalloys. (a) Polycrystalline microstructure showing the finite element mesh, (b) subgrain microstructure in a single grain, (c) discretized subgrain microstructural representative volume element, and (d) homogenized CPFE model for a grain. Note: l G, grain size; l P and l S, model constants. Reprinted with permission from Reference 46. © 2015 Elsevier.

Grain neighborhood effects in alloys that twin
Challenges remain in designing structural hcp alloys since they can potentially deform not only by slip, but also by deformation twinning. Deformation twinning is receiving a lot of attention, since it is not as well understood as plastic slip, and has a stronger effect on the mechanical response when it occurs.Reference Beyerlein, Arul Kumar, Andreoni and Yip51 When the alloy is strained, atomic-scale twins can form inside grains or grain boundaries and grow a few orders of magnitude to span the grain. The twin domain abruptly reorients and shears the lattice.
Alloying greatly affects the propensity of twinning and plays a significant role in the twin architecture that develops with straining. Twins that transmit across grain boundaries can detrimentally lead to the formation of “twin chains” percolating across the sample and triggering fatigue cracks and premature failure.Reference Simkin, Crimp and Bieler52–Reference Yin, Yang, Yang, Wu, Li and Li54 Twins that instead remain in their parent grain and multiply in the form of 3D intersecting networks can favorably lead to simultaneous high-strength and large-compression strain to failure.Reference Lentz, Risse, Schaefer, Reimers and Beyerlein55 How alloying controls twin development is largely unknown.
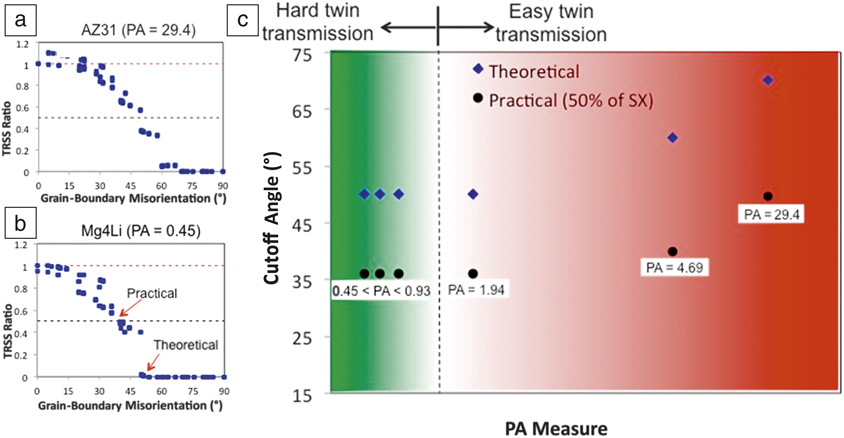
In the last few years, multiscale modeling tools for discrete twin domains in this mesoscale regime have been developed.Reference Cheng and Ghosh56–Reference Arul Kumar, Beyerlein and Tomé59 These techniques enable calculations of the local stress fields and dislocation activity around twin lamellae, shedding light on the effects of size and local grain neighborhoods on the propensity for twin growth. In one study, this type of multiscale model based on CP-FFT was employed to study the effect of alloying on the transmission of twins across grain boundaries.Reference Kumar, Beyerlein, Lebensohn and Tome60 Figure 7a–b plots the ratio of a driving force for transmission into the neighboring crystal across the boundary to that for growth of the same twin in its own parent crystal with respect to the misorientation of the neighboring grain. Two Mg alloys, AZ31 and Mg4Li, are considered, and in both, the driving force ratio rapidly decreases from unity at zero misorientation (no grain boundary) to zero as the misorientation between the two crystals increases, a trend that would be expected from purely geometric arguments. The important finding is the strong influence of alloying on the cutoff misorientation angle, Δθcut, above which the driving force and chances for twin transmission are zero. The alloy with the higher PA (Equation 1), AZ31, has a much higher Δθcut than Mg4Li, with the lower PA. Evidently, alloys with larger CRSS gaps among their slip modes promote twin transmission.
Variation of the driving force for twin transmission across a grain boundary with the misorientation of the grain boundary for two Mg alloys (a) AZ31 and (b) Mg4Li. A value of unity implies that the driving force for twinning in the neighboring grain at the tip of the twin is equal to that for twin propagation of the same twin in its parent crystal. A high (or too high) misorientation regime is well marked by a cutoff misorientation angle Δθcut, above which the chances for twin transmission are zero. (c) Map of the variation of cutoff angles for a wide range of alloys. Alloys are indicated by their plastic anisotropic (PA) measure in Equation 1. An arbitrarily defined practical cutoff angle, associated with a driving force ratio of 0.5 is also marked. This angle corresponds to a neighboring grain that bears a driving force that is 50% lower than that to propagate a twin in its own parent crystal. These more practical cutoff angles follow the same variation with PA as seen in (c). However, this 50% chance misorientation angle is more likely to be consistent with experimental observation. It is reasonable to expect that twin transmission would rarely be seen, particularly when the data sets are small, for misorientations corresponding to this practical cutoff angle, which is ∼36° for the low PA alloys and ∼50° for the highest one.Reference Kumar, Beyerlein, Lebensohn and Tome60

Figure 7c maps the calculated Δθcut for a wide range of Mg alloys. For more anisotropic (higher PA) alloys, Δθcut increases with PA, while for lower PA alloys, Δθcut is fixed at a lower value of ∼50°. These multiscale CP-FFT predictions reveal that alloying can have a more direct effect on twin morphologies than first thought. This insight suggests that alloying can help prevent twin chains from forming and acting as preferred paths for shear banding or cracking.
Opportunities and challenges
As we have highlighted, significant advances have been made in linking composition, microstructure, and mechanisms with the development of local stress states and deformation response. Yet several multiscale modeling challenges remain in the quest to fully understand the processing–microstructure–response relationships of an alloy.
During deformation, particularly under elevated temperatures and over long periods of time, a number of phenomena can occur that involve stress-induced migration of internal boundaries, such as phase transformations, recrystallization, grain growth, crack growth, and deformation twins. Many of these aspects have been studied intensively using atomic-scale simulations and phase-field methods, but incorporating their effects into slip and twinning in MMM codes has been challenging. Recent advances in this area have involved concurrently combining phase-field and CP theory into a single simulation tool, allowing for updates of crystalline and thermodynamic properties of the phases, lattice defects, and kinetics of migrating interfaces in time or strain.Reference Cottura, Appolaire, Finel and Le Bouar61–Reference Wu, Zaiser and Sandfeld63 These have been used to understand the influence of dislocation dynamics on rafting and how microstructural evolution can constrain or facilitate dislocation activity.
Many newly developed ultrastrong alloys have a highly heterogeneous grain structure. Some microstructural regions consist of micron-sized grains, while other regions are nanostructured, comprised of nanotwins, bimetal nanolayers, metal-ceramic nanolaminates, and nanograins.Reference Li, Pradeep, Deng, Raabe and Tasan64,Reference Xiong, Zhou, Pang, Beyerlein, Ma and Zheng65 No model to date can treat the plasticity in a such a significantly varied grain structure. Current multiscale models treat plasticity in coarse grains by using scale-independent, statistical dislocation densities over long time scales, and in nanograins by the scale-dependent motion of discrete dislocations over short time scales. New methodologies that can address discrete slip occurring over long times, in which microstructural evolution can be captured, are needed to design newer forms of heterogeneous alloys. Some recent advances to implement discrete slip events into a CPFE framework have been applied to relatively simple single-phase, pure metal systems.Reference Yuan, Beyerlein and Zhou66
Many high-performance alloys are multiphase, wherein more than one phase can plastically deform. Atomic-scale simulation and in situ microscopy of deforming groups of grains have revealed a number of defect–interface reactions (transference, recovery, nucleation) that could significantly affect the types of slip and twinning modes that would be selected in deformation.Reference Beyerlein, Zhang and Misra67,Reference Beyerlein, Demkowicz, Misra and Uberuaga68 Representing the role of such highly resolved atomic-scale reactions into the local orientation of crystals and ultimately the mechanical response is beyond current modeling capabilities. To benefit from advancements in alloys by microstructure design and control, MMM extensions toward incorporating the role of dislocation/interface interactions is recommended.
Outlook
Overcoming the “mesoscale gap” is rapidly becoming an MMM community-level effort. Notable research-center-level efforts exist that have successfully connected methodologies that span the broad atoms-to-continuum time scale and length scale spectrum.69,70 Data I/O, codes, and reports are increasingly being shared in repositories, publications, and public websites and hubs worldwide.71,72 In tandem are growing efforts to train users, via online manuals, example cases, summer schools, and workshops.73,74 Leaps in computing power are undeniably indispensable to fully develop and realize the predictive capabilities of many MMMs. Promising ways toward enabling larger and longer time simulations include adopting novel computing architectures, innovating efficient computational schemes, and using government and national laboratory facilities such as the High Performance Computing facilities,75–78 and the US Department of Energy’s Exascale Project.79 The Minerals, Metals & Materials Society recently published two reports, Modeling Across Scales80 and Core Knowledge and Skills,81 to inform the public of methodology and knowledge gaps. By coming together, MMMs for alloys can truly conquer the length scales within our lifetime.
Acknowledgments
I.J.B. and S.X. gratefully acknowledge support in part from the Office of Naval Research under Contract ONR BRC Grant N00014–18–1-2392. The work of S.X. was supported in part by the Elings Prize Fellowship in Science offered by the California NanoSystems Institute of the University of California, Santa Barbara. J.L. acknowledges support by the European Research Council under the European Union’s Horizon 2020 research and innovation program (Advanced Grant VIRMETAL, Grant Agreement No. 669141). J.A.E. acknowledges support from the National Science Foundation CAREER Award No. CMMI-1454072 and the Office of Naval Research Award No. N00014–18–1-2858. J.R.M. and B.S. gratefully acknowledge financial support of the work through Project M5, Priority Program 1713 (Chemo-mechanics), German Science Foundation, and through EPSRC Program Grant EP/R001715/1 (LightForm).

Irene J. Beyerlein is a professor at the University of California, Santa Barbara, with a joint appointment in the Mechanical Engineering and Materials Departments. She received her PhD degree in theoretical and applied mechanics at Cornell University in 1997. She was a J.R. Oppenheimer Fellow at Los Alamos National Laboratory, where she remained on the scientific staff in the Materials Science Division and later, the Theoretical Division, until 2016. She has published more than 250 peer-reviewed articles, five book chapters, and one book in the fields of structural composites, dislocations and twinning, materials processing, and polycrystalline plasticity. She is an editor for Acta Materialia and Scripta Materialia. She is also on the editorial boards of the International Journal of Plasticity and Modelling and Simulation in Materials Science and Engineering. Beyerlein can be reached by email at beyerlein@ucsb.edu.

Shuozhi Xu is an Elings Postdoctoral Fellow in the California NanoSystems Institute at the University of California (UC), Santa Barbara. He received his PhD degree in mechanical engineering from the Georgia Institute of Technology in 2016, followed by postdoctoral research in the same group, before moving to UC Santa Barbara in 2017. He has published 34 peer-reviewed journal articles and one book chapter based on his research in mechanical and thermal problems in materials at nano- and mesoscales using density functional theory, atomistic, concurrent atomistic-continuum, and phase-field modeling approaches. He is on the international advisory board of Materials Research Express. Xu can be reached by email at shuozhixu@ucsb.edu.

Javier Llorca is the scientific director and founder of the Instituto Madrileño De Estudios Avanzados (IMDEA) Materials Institute and professor and head of the research group on “Advanced Structural Materials and Nanomaterials” at the Polytechnic University of Madrid, Spain. He is a Fulbright scholar, a Fellow of the European Mechanics Society, and a member of the Academia Europaea, and has held visiting positions at Brown University, Shanghai Jiao Tong University, China, the Indian Institute of Science, and Central South University, China. His current research focuses on the application of computational tools and multiscale modeling strategies to establish processing–structure–properties relationships of structural materials. Llorca can be reached by email at javier.llorca@imdea.org.

Jaafar A. El-Awady is an associate professor of mechanical engineering at Johns Hopkins University. He received his BS and MS degrees from Cairo University, Egypt, and his PhD degree from the University of California, Los Angeles, all in aerospace engineering. He has been a visiting scientist at the Wright-Patterson Air Force Base Research Laboratory. His research interests include predicting the underlying deformation, damage, and failure mechanisms in materials through both multiscale simulations and microscale experiments. He is the recipient of the DARPA Young Investigator Award (2012), ASME Orr Early Career Award (2014), and the National Science Foundation CAREER Award (2015). El-Awady can be reached by email at jelawady@jhu.edu.

Jaber R. Mianroodi is a postdoctoral researcher in the Department of Microstructure Physics and Alloy Design at the Max-Planck-Institut für Eisenforschung GmbH, Germany. He received his BSc and MSc degrees in mechanical engineering from Sharif University of Technology, Iran, and his PhD degree in materials science from RWTH Aachen University, Germany. His research interests include atomistic simulations, multiscale material modeling, dislocation dynamics, and coupled problems. Mianroodi can be reached by email at j.mianroodi@mpie.de.

Bob Svendsen is a professor of material mechanics at RWTH Aachen University, Germany, and affiliated with the Department of Microstructure Physics and Alloy Design, Max-Planck-Institut für Eisenforschung GmbH, Germany. He received his PhD degree in geophysics from the California Institute of Technology, and his Habilitation degree in theoretical and applied mechanics from the Technical University of Darmstadt, Germany. His research interests include multiscale material theory, modeling and simulation, statistical and nonequilibrium thermodynamics, and theoretical and applied mechanics. Svendsen can be reached by email at b.svensden@mpie.de.