


In their pioneering article, Easterly and Levine (Reference Easterly and Levine1997) suggested that sub-Saharan Africa's high level of ethnic diversity can explain the region's poor economic performance. They found that in a broad cross section of countries, ethnic diversity was correlated with bad economic policies, slow economic growth, and low levels of per capita income. Subsequent research has confirmed these patterns, as ethnically diverse countries were found to have poor quality of government and inadequate provision of public goods (Alesina et al. Reference Alesina, Devleeschauwer, Kurlat and Wacziarg2003; La Porta et al. Reference La Porta, Lopez-de-Silanes, Shleifer and Vishny1999). Yet, because of the well-known limitations of cross-country studies, it remains unclear whether the adverse effects of ethnic diversity are causal and, if so, through what main mechanisms they operate (Alesina and La Ferrara Reference Alesina and La Ferrara2005).
A leading set of explanations for the poor economic performance of ethnically diverse countries is political. It is often argued that ethnic diversity leads to costly rent-seeking by different ethnic groups (e.g., Easterly and Levine Reference Easterly and Levine1997) and generates conflict over the provision of public goods (e.g., Alesina, Baqir, and Easterly Reference Alesina, Baqir and Easterly1999). These arguments imply that politically dominant ethnic groups will use their power to provide economic benefits to their own members. La Porta et al. (Reference La Porta, Lopez-de-Silanes, Shleifer and Vishny1999, 231) explicitly link the costs of ethnic diversity to ethnic favoritism: “In ethnically heterogeneous societies, it has been common for the groups that come to power to fashion government policies that expropriate . . . the ethnic losers . . ., and limit the production of public goods to prevent those outside the ruling group from also benefiting and getting stronger.” Easterly and Levine (Reference Easterly and Levine1997) and Alesina et al. (Reference Alesina, Devleeschauwer, Kurlat and Wacziarg2003) also use anecdotes of ethnic favoritism from several African countries to illustrate the economic costs of ethnic diversity.
Ethnic favoritism has also been a prominent theme in formal theories of ethnic politics. In the models of Fearon (Reference Fearon1999) and Caselli and Coleman (Reference Caselli and John Coleman2006), ethnicity is used as an exclusion device, and the winning ethnic groups redistribute resources toward their own members. Likewise, Padro i Miguel (Reference Padro i Miguel2007) predicts that a change in the ethnic group in power should lead to a change in taxation and allocation of public goods across the groups. He also argues that ethnic favoritism is prevalent in Africa and can explain the low accountability of African political leaders.
In contrast to the theoretical arguments that link poor economic outcomes of African countries to ethnic favoritism, there is no systematic empirical evidence that members of African ethnic groups actually benefit from having their leaders in power. African leaders appear to tax more heavily the crops grown in their own ethnic regions (Kasara Reference Kasara2007); and in Guinea, a change in the president's ethnicity was found to have no effect on the relative levels of infant mortality among the country's ethnic groups (Kudamatsu Reference Kudamatsu2007).
In this article, we reassess the role of ethnic favoritism in sub-Saharan Africa. Using the Demographic Health Surveys (DHS), we construct time-variant ethnic-level measures of education and health and study how they were affected by changes in the ethnicity of top political leaders in 18 African countries over the last 50 years. We use the difference-in-difference methodology and estimate the average effects of ethnic favoritism in our sample of countries, as well as its effects in each individual country.
In our analysis of education, we rely on the fact that most Africans who attend primary school do so between ages 6 and 13 (World Bank 2008). This allows us to measure the ethnic groups’ educational achievements in different time periods using the DHS data on primary education and literacy of people from different age cohorts. In our analysis of health, we follow Kudamatsu (Reference Kudamatsu2006; Reference Kudamatsu2007) and measure past levels of infant mortality using the DHS retrospective reports of African women regarding the death or survival of their children.
Intuitively, our difference-in-difference estimates answer two questions. First, did people who happened to be between 6 and 13 years old during the rule of their coethnic country leader have a higher probability of attending/completing primary school or becoming literate? Second, did children who happened to be born when their coethnic leader was in power have a lower probability of dying during the first year of their lives?Footnote 1
We find that ethnic favoritism is an important determinant of education and infant mortality in sub-Saharan Africa. We estimate that the leaders of the 18 countries in our sample have on average increased the primary school attendance, completion, and literacy of their ethnic groups by about 2 percentage points and reduced their infant mortality by about 0.4 percentage point. These effects of ethnic favoritism are large relative to the average time trends in education and infant mortality, corresponding to approximately three years of secular improvement in these outcomes in the countries we study. They are also similar to the effects of direct policy interventions typically found in the broader literature on education and health in developing countries (e.g., Glewwe and Kremer Reference Glewwe, Kremer, Hanushek and Welch2006; Jones et al. Reference Jones, Steketee, Black, Bhutta and Morris2003).
Our analysis of individual African countries confirms the importance of the leader's ethnicity. Although the effects of ethnic favoritism vary from country to country, we find that in most countries in our sample it has a strong impact on education, infant mortality, or both. Thus, in sub-Saharan Africa, ethnic favoritism is not only important on average, but is also quite widespread.
Overall, our findings are consistent with the theoretical arguments that link Africa's poor economic performance to ethnic favoritism. At the same time, they are inconsistent with earlier empirical work that found no evidence of ethnic favoritism in Africa. In particular, even if African leaders impose higher taxes on their coethnics (Kasara Reference Kasara2007), they also provide them with large education and health benefits in return.
We also make an attempt to address another important question: Why is ethnic favoritism more prevalent in some African countries than in others? To evaluate some of the available theoretical arguments, we run education and infant mortality regressions in which we interact our measure of the leader's ethnicity with the relevant country-level variables. This analysis, which captures bivariate correlations across the 18 countries in our sample, produces several interesting results.
First, we find mixed evidence on the role of the fiscal capacity of African governments (Herbst Reference Herbst2000) in explaining the uneven spread of ethnic favoritism on the continent. In particular, countries whose governments collect more revenues and have greater resources to spend on the provision of public goodsFootnote 2 tend to have more ethnic favoritism in education, but less ethnic favoritism in infant mortality. Second, four countries with one dominant religion (Islam) have significantly lower levels of ethnic favoritism than the other 14 that have much higher degree of religious fractionalization (Alesina et al. Reference Alesina, Devleeschauwer, Kurlat and Wacziarg2003). Third, the political variables (polity scores, experience with multiparty or single-party elections, and frequency of coups) that could affect the incentives of the leaders to cater to their ethnic groups cannot explain the cross-country differences in ethnic favoritism. Finally, countries whose ethnic groups speak more distant languages (Fearon Reference Fearon2003) or live in more segregated areas (Matuszeski and Schneider Reference Matuszeski and Schneider2006) also do not display higher levels of ethnic favoritism.
On the whole, by showing the importance of ethnic favoritism in Africa, this article provides evidence in support of ethnicity-based explanations of the continent's underdevelopment. But the costs of African ethnic diversity may be even higher than suggested by our analysis. First, some of the transfers that ethnic groups receive from their leaders may not be translated into immediate gains in their education and health. Thus, until we have better data on changes in the income of different groups, we may underestimate the amount of ethnic favoritism in Africa. Second, while we estimate the benefits to the ordinary members of ethnic groups from having their coethnics in power, African leaders may deliver even larger favors to ethnic elites. Such narrower elite-based ethnic favoritism can exacerbate ethnic rent-seeking and conflict, and further hamper economic development. Finally, while we only focus on the political role of ethnicity, African ethnic diversity may have other economic costs. For example, people from different ethnic groups may be less productive working together (Habyarimana et al. Reference Habyarimana, Humphreys, Posner and Weinstein2007; Lazear Reference Lazear1999) or may find it hard to sanction free riders and solve the collective action problem in the provision of local public goods (e.g., Miguel and Gugerty Reference Miguel and Gugerty2005).
The rest of the article is organized as follows. The next section provides some theoretical background for our empirical analysis. We then describe our leader ethnicity data and explain the construction of our measures of education and health. Next we estimate the average effects of ethnic favoritism in our sample of 18 countries and its separate effects in each individual country. We also present a case study of Congo-Brazzaville that illustrates how ethnic favoritism can operate in practice. We then provide evidence in support of the causal interpretation of our regression results and examine why ethnic favoritism is more prevalent in some African countries than in others. The last section concludes.
THEORETICAL BACKGROUND
In this section, we provide some theoretical background for our empirical analysis. First, we describe three general models of ethnic politics and discuss their implications for ethnic favoritism in Africa. We show that the models produce different theoretical predictions, and argue that it is ultimately an empirical task to demonstrate the existence of ethnic favoritism in Africa. Second, we discuss the possible mechanisms through which African leaders who pursue policies of ethnic favoritism can improve education and reduce infant mortality among their coethnics.
Should the Leader's Ethnicity Matter in Sub-Saharan Africa?
Borrowing from the literature on distributive politics in democracies (Cox and McCubbins Reference Cox and McCubbins1986; Dixit and Londregan Reference Dixit and Londregan1996; Lindbeck and Weibull Reference Lindbeck and Weibull1987), we can think of three broad models describing the relationship between the political leader and the members of his ethnic group.
The first model assumes that the political leader derives direct utility from his ethnic group's higher level of well-being. For example, a Kikuyu politician may feel happier if ordinary Kikuyu become better educated or healthier. The implication of this model is obvious: The ethnic leader will be interested in providing favors to the members of his group, regardless of their actual political behavior. We call this the “ethnic altruism” model, because the leader is essentially assumed to have altruistic preferences toward his ethnic group.
The second model assumes that the leader is an opportunistic politician who only cares about staying in power and transfers resources to different ethnic groups in order to maximize his total political support. Importantly, the model also assumes that the members of the ethnic groups receive large “psychic benefits” (Chandra Reference Chandra2004) from seeing their coethnics in office. For example, the ordinary Kikuyu may feel happier if a Kikuyu becomes the president of Kenya, in the same way that they feel happier if a Kikuyu wins an Olympic medal or becomes a celebrity. This “psychic benefits” model implies that the members of the ethnic groups will tend to support their political leaders unconditionally, without demanding any material benefits in return. As a result, the leaders will have little incentive to cater to their coethnics and might even prefer to spend more resources in securing the support of other ethnic groups. This argument is reminiscent of the probabilistic voting models of electoral politics (e.g., Lindbeck and Weibull Reference Lindbeck and Weibull1987), in which redistributive benefits are targeted at groups of swing voters rather than core supporters.Footnote 3
The third model maintains the assumption that the political leader is purely an office-seeker in need of political support, but drops the psychic benefits assumption of the previous model. Now, the members of the leader's ethnic group (like those of other groups) will only support him in exchange for material benefits such as schools or hospitals. In this model, there are at least two reasons why the leader may favor his ethnic group. First, it may be cheaper for the leader to buy the support of his coethnics (than the support of other groups) because he better understands their needs and can transfer benefits to them more efficiently (Dixit and Londregan Reference Dixit and Londregan1996). Second, it may be less risky for the risk-averse leader to trust the promises of his own group that it will support him politically in exchange for the benefits he provides (Cox and McCubbins Reference Cox and McCubbins1986). We call this the “quid pro quo” model, because it involves a mutual exchange of support between the ethnic leader and the ordinary members of his group.
Overall, these models of ethnic politics have several implications for the study of ethnic favoritism in Africa. First, “ethnic altruism” could be one reason for ethnic favoritism in Africa. Its empirical importance would depend on the number of African leaders who directly cared about the well-being of their ethnic groups.
Second, ethnic favoritism in Africa could be also generated by “quid pro quo” mechanisms. These mechanisms would be most relevant for African leaders who needed broad political support to remain in power. Thus, they were most likely to be at work during the periods of democracy, but also in African autocracies whose leaders tried to mobilize popular support by creating political parties and using them to provide benefits to the masses (Geddes Reference Geddes2005). Conversely, the “quid pro quo” model might be less applicable to African autocrats whose political survival depended on the loyalty of a narrow circle of close allies and military officers (Tullock Reference Tullock1987; Wintrobe 2000). These leaders could therefore be less likely to provide benefits to the ordinary members of their ethnic groups (Bueno de Mesquita et al. Reference Bueno de Mesquita, Smith, Siverson and Morrow2003).
Finally, the assumptions of the “psychic benefits” model are inconsistent with the possibility of ethnic favoritism. Thus, if many Africans provided unconditional political support to their ethnic leaders, they would be unlikely to receive material benefits from having these leaders in power.
The main conclusion we draw from this theoretical discussion is that the existence of ethnic favoritism in Africa cannot be taken for granted. Different models of ethnic politics produce conflicting predictions, and it is hard to know a priori which of the theoretical assumptions are more realistic in the African political context. Thus, demonstrating the existence of ethnic favoritism in Africa remains an empirical task.
Possible Effects of Ethnic Favoritism on Education and Infant Mortality
If ethnic favoritism is indeed a feature of politics in Africa, there are several mechanisms through which African country leaders can improve the education and health of their coethnics.
First, some policies of ethnic favoritism can directly focus on improving educational and health outcomes. For example, in the case of education, African leaders can reduce school fees or even pay students to attend school in the form of cash grants or subsidized meals and uniforms. They can also increase school quality by hiring new teachers, repairing leaking roofs, or providing blackboards and textbooks (Glewwe and Kremer Reference Glewwe, Kremer, Hanushek and Welch2006). Likewise, in the case of infant mortality, African leaders can expand immunization coverage, increase the availability of vital drugs, and raise the number of skilled birth attendants in their ethnic areas (Jones et al. Reference Jones, Steketee, Black, Bhutta and Morris2003).
Second, African country leaders can pursue more general policies of favoritism that would indirectly improve the education and health of their coethnics. For example, they can give cash transfers or public-sector jobs to members of their own ethnic groups. Both policies would increase the income of parents, who could then afford to send their children to school and pay for health care.
Finally, policies of ethnic favoritism can have an effect on education and infant mortality by changing people's expectations about future economic prospects. For example, the members of the leader's ethnic group may anticipate greater employment opportunities for their children and as a result invest more in their education. The expectations of future economic gains may also affect parental decisions to invest in the care of newborn children, as suggested by the research on “missing women.”Footnote 4
Although in principle it could be interesting to empirically distinguish between these different effects of ethnic favoritism, the limitations of our data will not allow us to do so.Footnote 5 In particular, although we are able to construct the ethnic-level time series for educational and health outcomes (as we explain in the section “Measuring ethnic-level changes in education and health”), the corresponding ethnic-level series for income or public spending on education and health are currently unavailable for most African countries. Therefore, without taking a stand on the relative importance of the specific mechanisms at work, our empirical analysis of ethnic favoritism will focus on the broader and more fundamental question: Do ordinary members of African ethnic groups benefit, in terms of their education and health, from having a coethnic leader in power?
DATA
To study ethnic favoritism in Africa, we need two types of data. First, for each country, we must know which ethnic group held political power at each point in time since independence. Second, we need data showing changes in the economic or social well-being of every ethnic group over the same time period.
Leader Ethnicity as a Measure of Ethnic Political Power
Following Fearon, Kasara, and Laitin (Reference Fearon, Kasara and Laitin2007) and Kasara (Reference Kasara2007), we use the ethnicity of a country's top political leader as an indicator of an ethnic group's control of national politics. This measure is especially relevant in sub-Saharan Africa, where politics tends to be highly centralized around the chief executive (Jackson and Rosberg Reference Jackson and Rosberg1982; Posner Reference Posner2007; van de Walle Reference Van de Walle2003), and where the ethnic group of the country's leader is usually thought to be most favored and politically dominant (Glickman Reference Glickman1995; Posner Reference Posner2005). Furthermore, leader ethnicity varies over time for a large number of African countries, which allows us to study the effects of ethnic political control in a panel data setting.
We use Goemans et al.'s (Reference Goemans, Skrede Gleditsch, Chiozza and Choung2006) list of heads of state and collect information on the ethnicity of leaders of all the countries in sub-Saharan Africa from their independence to 2006.Footnote 6 This information comes from several sources, which include Morrison, Mitchell, and Paden (Reference Morrison, Mitchell and Paden1989), Rake (Reference Rake1992; Reference Rake2001), and Wiseman (Reference Wiseman1991), among others.Footnote 7 However, there are two problems related to the coding of leader ethnicity. First, for some leaders, we must decide whether to use narrower or broader ethnic categories. For instance, Paul Biya of Cameroon was a member of the Bolou-Fang ethnic group, which is itself a part of the broader Beti-Pahouin ethnic cluster. It is therefore unclear whether he should be counted as belonging—and be expected to provide favors—to the former or to the latter. This “grouping problem” (Posner Reference Posner2004) is well known in the ethnic fractionalization literature and does not have a clear solution, because any ethnic partition is somewhat subjective. As a rule, we rely as much as possible on the ethnic categories offered by the influential articles of Alesina et al. (Reference Alesina, Devleeschauwer, Kurlat and Wacziarg2003) and Fearon (Reference Fearon2003).Footnote 8 Second, the ethnicity of some leaders is ambiguous because their parents belong to two different ethnic groups (Londregan, Bienen, and van de Walle Reference Londregan, Bienen and van de Walle1995). For example, Thomas Sankara of Burkina Faso was born to a Mossi father and a Fulani mother. In these rare cases, we code leaders as having both ethnicities, thus assuming that they may provide favors to both ethnic groups.
Measuring Ethnic-level Changes in Education and Health
To measure the impact of ethnic favoritism, we would ideally like to use economic or social variables that would have been collected for every ethnic group over the span of 30–40 years since each country became independent. However, such long ethnic-level time series are currently unavailable for most African countries. We therefore have to rely on indirect methods to construct similar time series using only recent and readily available data sources.
In this article, we use information from the DHS to create two types of time-variant ethnic-level outcome measures. First, we use data on primary education and literacy for Africans of different age cohorts as proxies for their educational achievements in different time periods. Second, we rely on retrospective information provided by African women regarding the death or survival of the children they gave birth to in the past. Before the construction of these education and health variables is described in greater detail, a few words about the DHS surveys are in order.
The DHS surveys are nationally representative household surveys that have been conducted by ORC Macro in a large number of developing countries since the late 1980s. The surveys have a sizable standardized component, allowing us to pool the data for many African countries and to provide comparable estimates of ethnic favoritism for individual countries. Each DHS survey contains three types of files. The main (or “household members”) files contain basic information about the entire sample of surveyed men and women of all ages. The women's and the men's files include additional data for smaller samples of women aged 15–49 and men aged 15–59, respectively. Our data on primary education come from the main files, whereas the information on literacy is only available for the smaller samples of women and men. The retrospective data on child mortality are also part of the women's files.Footnote 9
The DHS surveys for most African countries provide information about the respondents’ ethnicity. As we explain later, this information allows us to link the educational achievements of the respondents and the mortality of their children to the ethnicity of their country's leader in any given year.
Using Age Cohorts to Measure Ethnic-level Changes in Education. Each DHS survey provides information on the educational attainment of its respondents. We use this information to construct our Some Primary Education variable. This dummy variable equals 0 for individuals with “no education” and equals 1 for individuals with at least an “incomplete primary education.” We then assume that most Africans who attended primary school did so between the ages of 6 and 13. This important assumption allows us to construct time series of primary school attendance using the different age cohorts of the DHS respondents.
There is indeed some evidence that this assumption is realistic for the 18 African countries that we study in this article and describe in the section “The sample of countries in sub-Saharan Africa.” First, the ages 6 to 13 tend to coincide with the official primary school age in these countries (World Bank 2008).Footnote 10 Second, the World Bank data for these countries suggest that, on average, about three-fourths of all the students who attended primary school in a given year belonged to the official-age group.Footnote 11 Third, our own DHS data indicate that on average, 82% of all individuals who attended primary school “during the current school year” were between 6 and 13 years old.Footnote 12
The idea behind our use of age cohorts is simple: For each respondent we identify his/her country's leader when he/she was between 6 and 13 years old and determine whether this leader belonged to the respondent's ethnic group. More precisely, we define the Coethnic Leader variable in three steps: (1) we determine the calendar years when the respondent was between 6 and 13; (2) we find the number of those years in which the country's leader was of the same ethnicity as the respondent; (3) we divide the number of years found in the second step by 7, i.e., by the total years of primary school education. Therefore, the Coethnic Leader variable equals 1 for the respondents whose primary school age entirely coincided with the rule of a leader who shared their ethnic background, 0 for the respondents who grew up under a leader from another ethnic group, and a value strictly between 0 and 1 for the respondents whose primary school years only partly coincided with the rule of a leader who shared their ethnicity.
The main advantage of the Some Primary Education variable is that primary school attendance is directly relatable to a particular age group, thus making it an ideal measure of education in our framework. However, it may sometimes be problematic to use this measure. Indeed, some ethnic groups in some African countries have a very large share of people with at least some primary school education, especially in younger age cohorts.Footnote 13 In such circumstances, using school attendance may produce a biased estimate of ethnic favoritism because almost all of the group members already attend primary school.
To address this potential “upper limit” problem, we use two additional measures of education. The Completed Primary Education variable is a dummy equal to 1 for the individuals who have at least a “complete primary education” and equal to 0 for the individuals who have “no education” or an “incomplete primary education.” The Literacy variable is a dummy equal to 1 for the respondents who are able to read “a whole sentence” or “parts of a sentence” and equal to 0 for the respondents who “cannot read at all.”
These two alternative measures allow us to overcome the “upper limit” problem by posing significantly higher educational thresholds. For example, in our sample of sub-Saharan African countries shown in Table A1 and discussed in detail below, about 60% of the men and women aged 15 to 49 have some primary education, but only 54% are literate and only 37% completed their primary education.Footnote 14 An additional advantage of using the Literacy variable is that it measures the quality, and not just the quantity, of education.
The disadvantage of our two alternative educational measures is that their incidence is more loosely related to a particular age cohort of respondents. These variables can only be used if it is assumed that the respondent's probability of completing primary school and of becoming literate was mainly determined by what happened when he or she was 6 to 13 years old. Although these assumptions are not unreasonable, they are admittedly stronger than those made for the Some Primary Education variable.
Retrospective Data on Infant Mortality. To construct the ethnic-level time-series of infant mortality, we follow the methodology developed by Kudamatsu (Reference Kudamatsu2006; Reference Kudamatsu2007). In each DHS survey, women aged 15 to 49 were asked to retrospectively report about all the children they gave birth to in the past. In particular, the women reported their children's dates of birth and dates of death, if a child died before the time of the interview.Footnote 15 Therefore, for each newborn baby, we define the Infant Death dummy variable as equal to 1 if he/she died during the first year of his/her life, and equal to 0 otherwise.Footnote 16
Furthermore, to build the Coethnic Leader variable in the context of infant mortality, we determine whether the country leader when the child was born and the child's mother were of the same ethnicity.Footnote 17 As such, the Coethnic Leader is now a dummy variable equal to 1 for the children who were born when their mother's coethnic leader was in power, and equal to 0 for the children who were born when a country's leader belonged to another ethnic group.
The Sample of Countries in Sub-Saharan Africa
Drawing on our leader ethnicity data, we identify all the countries in sub-Saharan Africa that had at least two leaders from different ethnic groups.Footnote 18 We then focus on the countries that in addition had at least one DHS survey with information on the respondents’ ethnicity. Our final sample consists of 18 countries in sub-Saharan Africa. For each country, we use all the DHS surveys that provide data on education, infant mortality, and the respondents’ ethnicity.
Table A1 shows the list of all the countries in our sample, with the DHS surveys and the time periods covered by our data.Footnote 19 Overall, our main education sample consists of 1,133,245 respondents, while our analysis of infant mortality uses information on 1,173,710 children. Table A2 shows summary statistics for the dependent, independent, and control variables used in the analysis.
EMPIRICAL ANALYSIS
Econometric Methodology
To estimate the average effect of ethnic favoritism on education in our sample of 18 African countries, we run the following regression:

Yiest is the value of one of our education outcomes for individual i from ethnic cluster e in survey s who was born in year t. We define an “ethnic cluster” as being equivalent to an ethnic group for all the groups that had at least one member who became a country leader; in addition, we create for each survey in each country a residual ethnic cluster comprising all the ethnic groups that were never in power. CoethnicLeaderest is our main independent variable: It measures for all the members of ethnic cluster e in survey s born in year t the share of years when they were aged 6 to 13 that coincided with the rule of a leader who belonged to their ethnic cluster. μst and δes denote survey-year-of-birth fixed effects and survey-ethnic-cluster fixed effects, respectively. θest represents a linear time trend specific to ethnic cluster e in survey s. We include these time trends to control for any ethnic-level changes in education that might be unrelated to ethnic favoritism. Xiest is a vector of individual controls that includes male and urban residence dummies. Finally, we cluster standard errors at the survey-ethnic-cluster level.
Notice that regression (1) is estimated not only within countries, but within individual surveys of each country. This is because we want to avoid mixing individuals who were born in the same year t but were observed at different ages in different surveys. In addition, to account for the fact that in our dataset the total number of observations varies considerably by country, when estimating regression (1) we weight each observation by the inverse of the total number of observations in the corresponding country. As a result, each of the 18 countries receives equal weight in the computation of the average effect of ethnic favoritism.
Likewise, to estimate the average impact of ethnic favoritism on infant mortality in the sample of 18 countries, we run

Yiest is a dummy equal to 1 if baby i born to mother from ethnic cluster e in survey s in year t died before reaching the age of one year. CoethnicLeaderest is now a dummy variable equal to 1 for the babies of ethnic cluster e in survey s who were born in year t when their mother's coethnic was their country's leader. μst, δes, and θest are defined as in equation (1). Xiest is a vector of individual controls that now includes dummies for baby girls, mother's urban residence, multiple birth, and short birth spacing, as well as mother's age at birth and its square and baby's birth order and its square.Footnote 20 As before, we weight each observation by the inverse of the total number of observations in a country and cluster standard errors at the survey-ethnic-cluster level.
We are also interested in estimating the effects of ethnic favoritism in individual countries. To do so, we rerun regressions (1) and (2) separately for each country.
In all the regressions, our main parameter of interest is γ. In the regressions for individual countries, γ represents a country-specific difference-in-difference parameter that estimates the difference in the changes in education and infant mortality between the members of ethnic groups that had a fellow coethnic in power and those that did not.Footnote 21 In the regressions that include all the countries in our sample, γ measures the average of these country-specific difference-in-difference estimators. It can therefore be interpreted as measuring the average effect of ethnic favoritism in Africa.
To be more specific, in the education regressions, γ estimates the change in the probability that a respondent attends/completes primary school or becomes literate because his/her years of primary school education coincided with the rule of a coethnic leader. Likewise, in the infant mortality regressions, γ measures the change in the probability that a newborn dies during the first year of his/her life because he/she was born during the rule of a leader who shared his/her mother's ethnicity.Footnote 22
We assume that the transitions between leaders of different ethnicity in our dataset were exogenous to changes in the ethnic groups’ education and health. We therefore interpret γ as measuring the causal effects of ethnic favoritism. Given the importance of the exogeneity assumption, we will examine it more closely in the section “Effects of ethnic favoritism in Africa: Evidence for causality.” In particular, we will discuss possible endogeneity concerns and will show that they are unlikely to be important for our analysis. We will also show in that section that our estimates of ethnic favoritism are not driven by selection effects that may be present in the DHS data.
Our methodology also assumes that ethnic favoritism starts having an impact on education and infant mortality as soon as a new leader comes to power. This is not unrealistic, as many of the policies that African leaders could use to improve the education and health of their coethnics, which we discussed in the section “Possible effects of ethnic favoritism on education and infant mortality,” could be implemented fairly quickly. Still, it is possible that the effects of some policies (e.g., building new schools or improving sanitation infrastructure) related to ethnic favoritism could only be felt with a time lag. To account for this possibility, we also ran education and infant mortality regressions with the Coethnic Leader variable lagged one, two, or three years. In the case of education, the results of these regressions were similar to those of the regressions without lags, whereas in the case of infant mortality, introducing lags weakened the estimates. These findings suggest that there is little importance in analyzing the delayed effects of ethnic favoritism, and we thus focus on the regressions without lags in the rest of the article.
Average Effect of Ethnic Favoritism in Sub-Saharan Africa
In Table 1 we estimate the average effect of ethnic favoritism on primary school attendance [column (1)], primary school completion [column (2)] and infant mortality [column (3)] in our sample of countries in sub-Saharan Africa. We find that ethnic favoritism has a statistically significant impact on all these outcomes. The respondents whose primary school years fully coincided with the rule of a coethnic leader were on average 2.25 percentage points more likely to attend primary school and 1.80 percentage points more likely to complete it than the respondents who grew up under a leader from another ethnic group. Likewise, the children born when their mother's coethnic leader was in power were 0.37 percentage points less likely to die during their first year of life than the children born when their country's leader belonged to another ethnic group.
Ethnic Favoritism in Primary Education and Infant Mortality
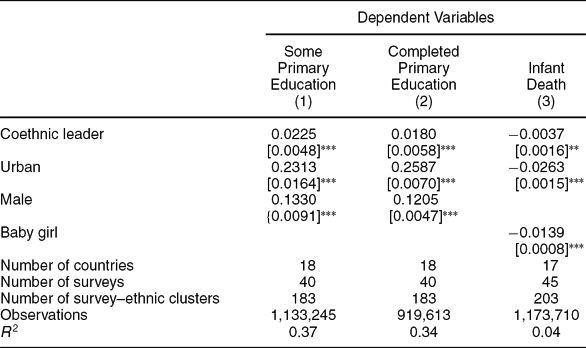
Notes: (1) All the regressions include Survey–Year of Birth FE, Survey–Ethnic Cluster FE, and Survey–Ethnic Cluster specific time trends. The regression in column (3) also includes other individual controls: Multiple Birth, Mother's Age at Birth and its square, Birth Order and its square, and Short Birth Spacing. (2) The Number of Ethnic Clusters in a country refers to the number of ethnic groups whose members became leaders of the country, plus one cluster comprising all the other groups. (3) In all the regressions, each observation is weighted by the inverse of the total number of observations in a country. (4) Standard errors clustered at the Survey–Ethnic Cluster level are shown in brackets. (5) *** denotes significance at the 1% level, ** at the 5% level, * at the 10% level.
It is important to put these results in perspective. As shown in Table A2, 61% of all the respondents above age 6 attended and 32% of them completed primary school, while the average rate of infant mortality in our sample of countries is 10%. Thus, on average country leaders increased the primary school attendance of their ethnic groups from 61% to 63.2%, increased their primary school completion from 32% to 33.8%, and reduced their infant mortality from 10% to 9.6%.
An intuitive way to interpret the magnitude of these effects of ethnic favoritism is to compare them to the average time trends (i.e., the average annual changes) in education and infant mortality in our data. Our estimations, whose details are available upon request, show that in our sample of countries, primary school attendance and completion rose on average by 0.84 and 0.56 percentage points per year, respectively, while the average annual reduction in infant mortality amounted to 0.1 percentage points.Footnote 23 When compared to the coefficients on Coethnic Leader in Table 1, these estimates imply that African leaders improved the education and health of their coethnics by the equivalent of about three years of secular trend. This suggests that the effects of ethnic favoritism that we find are economically quite large.
Another way to appreciate the quantitative importance of our results is by putting them in the context of the empirical literature that estimates the effects of active policy interventions on education and child mortality. Glewwe and Kremer (Reference Glewwe, Kremer, Hanushek and Welch2006) review the literature on education. Although they report mixed evidence on the effectiveness of various programs, the effects of the programs that did work were found to be quantitatively similar to the effects of ethnic favoritism observed in our study. For example, large cash grants paid to the participants in the PROGRESA program in Mexico conditional on their children's school attendance increased primary school enrollment by 3.4 percentage points (Schultz Reference Schultz2004).Footnote 24
Jones et al. (Reference Jones, Steketee, Black, Bhutta and Morris2003) estimate the effects of various medical interventions on reducing under-5 child mortality in developing countries. They calculate that universal availability of antibiotics for pneumonia or dysentery would reduce child mortality by 3% to 6%, and universal availability of a skilled attendant at birth would reduce it by 4%. Again, these estimates are quantitatively similar to the 3.7% reduction in infant mortality (0.37 percentage points down from the mean of 10) due to the presence of a coethnic country leader.Footnote 25
To sum up, the results presented in Table 1 confirm the existence of ethnic favoritism in sub-Saharan Africa. They also suggest that its economic effects on education and health are quite large.
In Table 2 we present a more complete picture of ethnic favoritism in education. In columns (1) and (2), we estimate the effect of ethnic favoritism on literacy, which is a direct measure of the quality of acquired education. These regressions complement our evidence on primary school attendance and completion, the two variables that mainly measure the quantity of education provided. Because the data on literacy are only available for smaller samples of women aged 15 to 49 and men aged 15 to 59, we present separate regression results for these gender groups. To better compare these results with the earlier ones on primary education, in columns (3) to (6) we rerun the original regressions for primary school attendance and completion but now splitting the sample by gender.
Ethnic Favoritism in Literacy and Primary Education for Men and Women

Notes: (1) All the regressions include Survey–Year of Birth FE, Survey–Ethnic Cluster FE, and Survey–Ethnic Cluster specific time trends. (2) The Number of Ethnic Clusters in a country refers to the number of ethnic groups whose members became leaders of the country, plus one cluster comprising all the other groups. (3) In all the regressions, each observation is weighted by the inverse of the total number of observations in a country. (4) Standard errors clustered at the Survey–Ethnic Cluster level are shown in brackets. (5) *** denotes significance at the 1% level, ** at the 5% level, * at the 10% level.
The results in Table 2 convey two points. First, in the case of women, the effect of ethnic favoritism on literacy is similar to its effect on primary education, which confirms that the leader's ethnicity is a major determinant of education in Africa. In particular, women who had a coethnic leader in power during their primary school years were 2.75 percentage points more likely to become literate than those who did not. This is similar to their 2.90-percentage point higher probability of attending and 1.59-percentage point higher probability of completing primary school.
Second, the impact of ethnic favoritism on education in Africa is uneven across genders. Whereas the regressions for women produce large and statistically significant coefficients on Coethnic Leader across all three measures of education, the results for men are only significant for primary school attendance and completion and tend to be quantitatively weaker. Interestingly, this evidence is consistent with the broader literature on education, which finds that active policy interventions in developing countries also tend to benefit girls more than boys (Glewwe and Kremer Reference Glewwe, Kremer, Hanushek and Welch2006; Orazem and King Reference Orazem, King, Schultz and Strauss2008).Footnote 26
Overall, Tables 1 and 2 support the idea that members of the African ethnic groups benefit, in terms of education and health, from having a coethnic politician as their country's leader. Our evidence also suggests that these benefits are economically large, although in the case of education they mostly apply to women rather than men.
Although the average effects of ethnic favoritism in sub-Saharan Africa are quite substantial, they can mask potentially important differences between the countries in our sample. While in some African countries the leader's ethnicity may have a strong impact on the distribution of education and health, in others it may play a more limited role. In the next subsection, we disaggregate the results of Tables 1 and 2 and estimate the effects of ethnic favoritism in each country in our sample.
Effects of Ethnic Favoritism in Africa: A Country-by-Country Analysis
Tables 3 and 4 present the country-by-country estimates of ethnic favoritism in education and health for all the countries in our sample. Table 3 shows the effects of ethnic favoritism on primary school attendance and completion for all the respondents in a country, as well as its effects on literacy for women aged 15 to 49 and men aged 15 to 59. Table 4 shows the impact of ethnic favoritism on infant mortality. We now report two types of standard errors: those clustered at the survey-ethnic-cluster level and those clustered at the survey-ethnic-cluster-year-of-birth level.Footnote 27
Ethnic Favoritism in Primary Education and Literacy: Country by Country

Notes: (1) All the regressions include Survey–Year of Birth FE, Survey–Ethnic Cluster FE, Survey–Ethnic Cluster specific time trends, and Urban control. Primary Education regressions also control for gender. (2) The Number of Ethnic Clusters in a country refers to the number of ethnic groups whose members became leaders of the country, plus one cluster comprising all the other groups. (3) Standard errors clustered at the Survey–Ethnic Cluster level are shown in square brackets. Standard errors clustered at the Survey–Ethnic Cluster–Year of Birth level are shown in curly brackets. (4) *** denotes significance at the 1% level; ** at the 5% level; * at the 10% level.
Ethnic Favoritism in Infant Mortality: Country by Country

Notes: (1) All the regressions include Survey–Year of Birth FE, Survey–Ethnic Cluster FE, Survey–Ethnic Cluster specific time trends, and the following controls: Urban, Baby Girl, Multiple Birth, Mother's Age at Birth and its square, Birth Order and its square, and Short Birth Spacing. (2) The Number of Ethnic Clusters in a country refers to the number of ethnic groups whose members became leaders of the country, plus one cluster comprising all the other groups. (3) Standard errors clustered at the Survey–Ethnic Cluster level are shown in square brackets. Standard errors clustered at the Survey–Ethnic Cluster–Year of Birth level are shown in curly brackets. (4) *** denotes significance at the 1% level, ** at the 5% level, * at the 10% level.
The results in Table 3 indicate that the leaders of many African countries disproportionately improved the education of their own ethnic groups. In fact, in eight countries in our sample, the Coethnic Leader coefficients are consistently positive and large. In some of these countries, such as the Central African Republic, Congo-Brazzaville, Ethiopia, and Gabon, the effects of ethnic favoritism on education are particularly large, exceeding 10 percentage points for some measures of education. In other countries, such as Ghana, Kenya, Niger, and Togo, these effects are more moderate but still substantial, ranging from 1 to 8 percentage points.Footnote 28
Likewise, the results in Table 4 show that in many African countries ethnic favoritism is an important determinant of infant mortality. In seven countries in our sample, the Coethnic Leader coefficient is negative and large (above 0.003 in absolute value).Footnote 29 For example, in Ethiopia and Ghana, ethnic favoritism reduced infant mortality by 0.54 and 0.92 percentage points, respectively. The effects of ethnic favoritism were even larger in Burkina Faso, Cameroon, and Uganda, where they amounted to 1 to 3 percentage points.
Taken together, the results in Tables 3 and 4 indicate that ethnic favoritism had a strong impact on education, infant mortality, or both in a large number of African countries. They confirm the aggregate evidence presented earlier and suggest that in sub-Saharan Africa ethnic favoritism is not only important on average but is also quite widespread.
Yet Tables 3 and 4 also show that the effects of ethnic favoritism vary across countries. Differences in the size of the Coethnic Leader coefficient between countries can be quite substantial; and in a few countries (e.g., Guinea or Mali), we do not find any evidence of ethnic favoritism.Footnote 30 This heterogeneity raises an important question: Why is ethnic favoritism more prevalent in some African countries than in others? We will attempt to shed light on this issue in the section “Explaining cross-country variation in ethnic favoritism in Africa.”
But now we want to illustrate how ethnic favoritism can emerge and be implemented in sub-Saharan Africa by providing a case study of Congo-Brazzaville, one of the countries where we find strong effects of ethnic favoritism on education.
Ethnic Favoritism in Practice: A Case Study of Congo-Brazzaville
In Congo-Brazzaville, the main ethnic division runs along regional lines. The members of the Kongo ethnic group live in the southern part of the country, whereas the members of the Mbochi ethnic group inhabit the north.Footnote 31 Although the rivalry between the Kongo and the Mbochi goes back to the colonial period, it was exacerbated by the leaders who successively ruled the country after independence (Kitsimbou Reference Kitsimbou2001). The first two leaders, Fulbert Youlou (1960–63) and Alphonse Massamba-Debat (1963–68), were both ethnic Kongo from the south. But the three subsequent leaders, Marien Ngouabi (1968–77), Jacques-Joachim Yhombi-Opango (1977–79) and Denis Sassou-Nguesso (1979–92), were all ethnic Mbochi from the north.Footnote 32
Historical evidence suggests that the change in the ethnicity of the Congolese leaders shifted the balance of power between the two groups. Both Youlou and Massamba-Debat had developed a system of patronage which favored their fellow Kongo, but Ngouabi replaced most of the Kongo officeholders with his own Mbochi appointees soon after his 1968 coup against Massamba-Debat. Later on, under the leadership of Yhombi-Opango and Sassou-Nguesso, the Mbochi continued to occupy a disproportionate number of political and administrative positions, and their governments were widely perceived as the rule of northerners over the south of the country (Kitsimbou Reference Kitsimbou2001).
In such a context of intense political rivalry between the Kongo and the Mbochi, it is not surprising that, in Congo-Brazzaville, ethnic favoritism had an impact on education.Footnote 33Figures 1 and 2 illustrate this graphically by showing the time series of primary school attendance and completion for the Kongo, the Mbochi, and the “Other” ethnic groups between 1960 and 1992. To construct these time series, we follow a strategy similar to the one used in our regression analysis. For each calendar year (and for each ethnic category), we consider the DHS respondents who were between 6 and 13 years old during that year and compute the percentage of those respondents who attained the corresponding level of education.
Rates of Primary School Attendance of the Different Ethnic Groups in Congo-Brazzaville, 1960–92.

Rates of Primary School Completion of the Different Ethnic Groups in Congo-Brazzaville, 1960–92.

Figures 1 and 2 show that before 1968, when the Kongo leaders ruled the country, the educational achievements of the Mbochi were significantly lower than those of the Kongo. However, after Ngouabi's coup, the Mbochi quickly closed this gap and eventually achieved higher rates of primary school attendance and completion. The figures also show that the “Other” ethnic groups, whose educational outcomes were similar to those of the Mbochi before 1968, failed to improve them as rapidly afterward and continued to lag behind the Kongo. This provides a counterfactual suggesting that the Mbochi's own improvement in education vis-à-vis the Kongo could not have been possible without their leaders coming to power.
Indeed, the fast change in the relative educational achievements of the Kongo and the Mbochi can be best explained by the policies of ethnic favoritism pursued by the successive Congolese leaders. Both Youlou and Massamba-Debat made larger educational investments in the south than in the north of the country (Kiamba Reference Kiamba2007). They also increased the number of positions in the civil service and allocated most of them to their fellow Kongo (Mbandza Reference Mbandza2004). This latter policy raised the income of many Kongo families and further increased their ability to send their children to school. Overall, the policies of Youlou and Massamba-Debat reinforced the Kongo's educational advantage inherited from the colonial period. However, things changed when Ngouabi came to power.
Ngouabi was particularly concerned with education because of his Marxist–Leninist beliefs (Kitsimbou Reference Kitsimbou2001). His government spent on education almost 6% of GDP in 1970 and nearly 8% of GDP in 1975, more than any other government in sub-Saharan Africa (World Bank 2003). But these funds were not evenly distributed among the Congolese ethnic groups, as it was now the turn of the Mbochi to enjoy the benefits of favoritism.
The intensive recruitment of new teachers in the Mbochi areas was a particularly important channel of ethnic favoritism, as nearly 70% of the country's education budget between 1970 and 1982 was spent on teachers’ salaries (Kiamba Reference Kiamba2007). Furthermore, Ngouabi and his Mbochi successors accelerated the construction of new schools in the north of the country, and distributed the lion's share of financial aid to the Mbochi students (Kiamba Reference Kiamba2007). In addition to pursuing these policies, which directly aimed at improving the education of the Mbochi, Ngouabi and his successors also favored their coethnics when filling the large number of newly created positions in the civil service (Mbandza Reference Mbandza2004). This increased the income of many Mbochi families and further contributed to the fast rise in the rates of schooling of the Mbochi children
Overall, the case of Congo-Brazzaville illustrates the different mechanisms through which African leaders could improve the educational achievements of their coethnics. It also shows that the policies of favoritism can quickly change the relative levels of education of a country's ethnic groups. In addition, the example of Congo-Brazzaville suggests that ethnic favoritism might be especially prevalent in African countries whose leaders have large fiscal resources that they can spend on the provision of public goods. This is one of the hypotheses that we will test in our comparative analysis of ethnic favoritism in the section “Explaining cross-country variation in ethnic favoritism in Africa.” But first, we have to confirm the causal interpretation of our regression results.
EFFECTS OF ETHNIC FAVORITISM IN AFRICA: EVIDENCE FOR CAUSALITY
In the discussion of our regression results in the sections “Average effect of ethnic favoritism in sub-Saharan Africa” and “Effects of ethnic favoritism in Africa: A country-by-country analysis,” we interpreted the effects of ethnic favoritism on education and infant mortality as causal. In this section, we provide some evidence in support of this causal interpretation. First, we run a falsification test and verify that our results are not driven by pre-trends in education and infant mortality. Second, we review the history of the interethnic leadership transitions in our data set and show that only a small number of them could have possibly been endogenous to changes in education and health. We also show that our results are robust to the exclusion of these transitions. Finally, we show that our estimates of ethnic favoritism are not driven by selection effects that may be present in our data.
Falsification Test
It is possible that for reasons unrelated to ethnic favoritism, the ethnic groups in a country had different short-term trends in education and infant mortality around the times of leadership transitions. These short-term trends would not be captured by the linear long-term trends included in our regressions, and could potentially confound our difference-in-difference estimates. To alleviate this concern, we carry out a falsification test that examines the timing of our results. In particular, we want to show that our estimates of ethnic favoritism are not driven by pre-trends, i.e., by changes in education and infant mortality that occurred before the corresponding changes in the country's leadership.
To implement the falsification test in education, we rerun regression (1) using the Coethnic Leader variable forwarded eight years instead of the original Coethnic Leader variable. This regression tests whether the respondents who were aged 14 to 21 (instead of 6 to 13) during the rule of their coethnic country leader have higher rates of primary school attendance, primary school completion, and literacy. Because it is unrealistic to assume that these outcomes are determined between the ages of 14 and 21, a large and significant positive coefficient on the forwarded Coethnic Leader variable would point to the existence of pre-trends in education that could bias our estimates of ethnic favoritism. Conversely, a small and insignificant coefficient on the forwarded Coethnic Leader variable would indicate the absence of such pre-trends.
In the case of infant mortality, we run regression (2) using the Coethnic Leader variable forwarded two years as a substitute for the original one.Footnote 34 This regression tests whether babies whose coethnic country leader was in power two years after their birth were less likely to die during the first year of their lives. Because it is reasonable to assume that the leaders cannot affect infant mortality before coming to power, a large and significant negative coefficient on the forwarded Coethnic Leader variable would point to the existence of pre-trends that could drive our original infant mortality results. In contrast, a small and insignificant coefficient on the forwarded Coethnic Leader variable would alleviate this concern.
Table 5 presents the results of the falsification test for primary school attendance [column (1)], primary school completion [column (2)], female literacy [column (3)], and infant mortality [column (4)].Footnote 35 It shows that, in contrast to the Coethnic Leader coefficients in our original regressions, the coefficients on the forwarded Coethnic Leader variable in the falsification regressions tend to be small and statistically insignificant. This finding suggests that our original regressions capture the changes in education and infant mortality that occur after new leaders come to power, and not before. It is therefore consistent with the causal interpretation of the results in the section “Empirical analysis.”
Ethnic Favoritism in Education and Infant Mortality: Falsification Test

Notes: (1) All the regressions include Survey–Year of Birth FE, Survey–Ethnic Cluster FE, Survey–Ethnic Cluster specific time trends, and the individual controls from Tables 1 and 2. (2) All the regressions in columns (1) to (3) use data from 18 countries, 40 surveys, and 183 survey–ethnic clusters. All the regressions in column (4) use data from 17 countries, 45 surveys, and 203 survey–ethnic clusters. The number of ethnic clusters in a country refers to the number of ethnic groups whose members became leaders of the country, plus one cluster comprising all the other groups. (3) In all the regressions, each observation is weighted by the inverse of the total number of observations in a country. (4) The “original regressions” are reported for easier comparison. They are identical to the regressions in columns (1)–(3) of Table 1 and column (1) of Table 2. In these regressions the Coethnic Leader variable is computed for the period when the respondent is aged 6–13 [in columns (1) to (3)] or for the year in which the baby is born [in column (4)]. (5) In the “falsification regressions,” the original Coethnic Leader variable is forwarded eight years [in columns (1)–(3)] or two years [in column (4)]. (6) Standard errors clustered at the Survey–Ethnic Cluster level are shown in brackets. (7) *** denotes significance at the 1% level, ** at the 5% level, * at the 10% level.
Yet the absence of pre-trends does not rule out the possibility that the interethnic leadership transitions in our dataset were endogenous. We address this issue next.
Are Transitions between Leaders of Different Ethnicity Exogenous?
In the section “Empirical analysis,” we assumed that the transitions between leaders of different ethnicity were exogenous to the changes in education and infant mortality of their ethnic groups. Because this assumption is crucial for the causal interpretation of our difference-in-difference estimates (Besley and Case Reference Besley and Case2000), in this subsection we examine its empirical validity. We also evaluate the robustness of our results to the exclusion of transitions that could have potentially been endogenous.
In general, endogeneity can be caused by either reverse causality or an omitted variable bias (OVB). In this study, reverse causality does not seem to be a concern, because short-term variations in primary education or infant mortality of ethnic groups were unlikely by themselves to cause changes in a country's leadership.Footnote 36 However, an OVB remains a possibility in our regressions: An ethnic group can experience a positive (negative) income shock that helps its leader to come to (be removed from) power and at the same time improves (worsens) the education and health of its members.Footnote 37 In this case, our difference-in-difference regressions would overestimate the true effects of ethnic favoritism (i.e., the coefficients on Coethnic Leader would be biased away from zero).
In what follows, we discuss possible types of such relative income shocks and examine whether they might have influenced the interethnic leadership transitions in our dataset.
Relative Income Shocks and the Possibility of Omitted Variable Bias. Three types of income shocks may create an OVB in our regressions. First, an ethnic group may become richer because it benefits from the recent exploitation of natural resources (e.g., oil) in the region that it inhabits, or from a change in the terms of trade for these natural resources.
Second, and quite similarly, agricultural shocks may also change the relative wealth of ethnic groups in a country. These agricultural shocks may result from extreme weather conditions (e.g., drought or flood) that affect the production of regionally grown crops (Miguel, Satyanath, and Sergenti Reference Miguel, Satyanath and Sergenti2004), or from exogenous changes in the world prices for these crops.
Third, an OVB may be generated by foreign aid. For instance, during the Cold War, the United States and the Soviet Union often provided military assistance to various governments while also supplying economic aid to their countries’ populations. It is possible that such aid benefited some ethnic groups more than others. Notice, however, that there would only be an OVB if the foreign powers directly funded the schools and hospitals of the incumbent leader's ethnic group (in addition to propping him up in power). Conversely, if foreign aid was given to the leader, who then allocated it to his coethnics, this would constitute a case of ethnic favoritism but not of OVB.
To see whether our empirical results could indeed be subject to an OVB, we studied the history of all the interethnic leadership transitions in our sample of countries.Footnote 38 We specifically examined whether the timing of any of these transitions could have been affected by recent changes in groups’ relative incomes due to shocks to the prices of natural resources, agricultural output, or the amount of foreign aid. In the next subsection, we discuss the main findings of this historical review.
The Role of Relative Income Shocks in African Leadership Transitions. In our dataset, we can distinguish between four types of interethnic leadership transitions. The first type can be termed a “peaceful dictatorial transition” in which a dictator appoints his successor and for a while grooms him as his potential heir. In such a situation, an OVB is unlikely to be an issue because the actual leadership change usually results from the incumbent's death or health-related resignation, the timing of which can reasonably be viewed as exogenous (Jones and Olken Reference Jones and Olken2005). For example, the Kalenjin politician Daniel Arap Moi became president of Kenya in 1978, after the death of Jomo Kenyatta, a Kikuyu, whom he had served as vice-president since 1967. Of course, ethnicity could have still played a role in Kenya's transition. In fact, a group of powerful Kikuyu, called the Kiambu Mafia, tried to prevent Kenyatta from designating Moi as his successor. But there is no evidence that Moi eventually prevailed and came to power because the Kalenjin became richer or the Kikuyu poorer (Widner Reference Widner1992).Footnote 39
Coups make up the second type of leadership transitions in our dataset. As documented by McGowan (Reference McGowan2007), two kinds of coups can be distinguished. The first type is “palace revolutions,” which are mainly motivated by personal rivalry between members of the ruling junta. An OVB is therefore unlikely to be an issue, because the timing of these coups usually reflects the weakening of the incumbent leader's personal power. For instance, in the 1971 coup in Uganda, sections of the army led by then Chief of Staff Idi Amin Dada overthrew Milton Obote when he was abroad attending a Commonwealth conference. Amin clearly acted out of personal fear that Obote would sack him and bring him to trial. In fact, during the months preceding the coup, Obote leveled a series of personal accusations against Amin and reorganized the army to weaken Amin's authority (Mutibwa Reference Mutibwa1992). It is also true that the coup was facilitated by the split in the army between officers of Obote's Lango ethnic group (and of the related Acholi group) and those of Amin's Kakwa ethnic group (and of the related West Nile groups). However, there is no indication that the Kakwa's relative income increased before the coup or that such an increase contributed to the coup's success.
In contrast to the “palace revolutions,” the second kind of coups is concomitant with civil unrest and/or an economic crisis. But such coups can only create an OVB if the economic turmoil hurts the incumbent's ethnic group more than the rebel leader's ethnic group. From our reading of various sources, there is very little evidence to suggest that there is such a case in our dataset. For instance, the 1966 coup in Burkina Faso, led by Lieutenant Colonel Sangoule Lamizana against President Maurice Yameogo, occurred in the wake of a general strike and demonstrations by trade unions and radical students, who marched to government headquarters demanding action by the military. Although ethnic conflicts between Mossi politicians in Yameogo's government and Lamizana, a Samo, might have contributed to the coup, it does not seem that the economic crisis hurt the Mossi more than the Samo (Englebert Reference Englebert1998).
The third type of transition between leaders of different ethnicity may result from civil wars. These transitions may entail an OVB if the incumbent leader lost the war because foreign powers stopped financing his military efforts and at the same time cut economic aid to his ethnic group. This could have possibly been the case in Ethiopia, where Mengistu Haile Mariam lost the war to Meles Zenawi's Tigrayan People's Liberation Front in 1991 after the decline in Soviet economic and military assistance to his government (Woodward Reference Woodward1996). Notice that even in Ethiopia the existence of an OVB is far from certain, because it is not clear that the Soviets directly targeted their economic aid at the Amhara population (as opposed to giving money to Mengistu who then transferred it to the Amhara). Nevertheless, we will evaluate, in the section “Robustness to the exclusion of potentially endogenous leadership transitions,” the robustness of our results to the exclusion of Ethiopia's 1991 transition from the regression analysis.Footnote 40
Democratic elections constitute the last type of interethnic leadership transition in our dataset. Most democratic elections in Africa were held as part of the general process of democratization that took place in the 1990s, after the end of the Cold War. In this period, Western powers often pushed for democratization by reducing the amount of foreign aid to the incumbent leaders and forcing them to hold free and fair elections. Thus, France forced democratization on some of its former colonies, such as Benin, Congo-Brazzaville, Mali, and Niger (Clark and Gardinier Reference Clark and Gardinier1997). This led, for instance, to the electoral defeat of Mathieu Kerekou by Nicephore Soglo in the 1991 election in Benin, as well as to the fall of Congo's Denis Sassou-Nguesso and the election of Pascal Lissouba in 1992. Likewise, Western countries cut all but humanitarian aid to Malawi until Hastings Banda, the country's long-time ruler, organized democratic elections in 1994, in which he was defeated by Bakilii Muluzi (Ihonvbere Reference Ihonvbere, Omozuanvbo Ihonvbere and Mbaku2003). Although there is no evidence that Western countries directly reduced their transfers to the incumbent leaders’ ethnic groups or increased their transfers to the new leaders’ ethnic groups, the use of foreign aid for political purposes probably increases the likelihood of an OVB in these democratic transitions. In what follows, we therefore examine what happens if we conservatively exclude these transitions from our regressions.
To sum up, we found no evidence in the historical literature that the interethnic leadership transitions in our dataset were caused by relative income shocks due to changes in natural resources or agricultural output. However, a small number of these transitions might have been affected by an OVB due to the changing patterns of foreign aid after the end of the Cold War. The fall of Mengistu in Ethiopia in 1991 is one transition that could have been endogenous to changes in foreign aid. The democratic transitions in Benin in 1991, the Central African Republic in 1993, Congo-Brazzaville in 1992, Mali in 1991, Malawi in 1994, and Niger in 1993 could have also been biased by the end of the Cold War.
Robustness to the Exclusion of Potentially Endogenous Leadership Transitions. We now evaluate the robustness of our estimates of the average ethnic favoritism in Africa to the possibility of an OVB. Specifically, we rerun regressions (1) and (2), but now drop from our sample the transitions that could have been endogenous. We consider two alternative samples of transitions. In the first sample, we exclude Ethiopia after 1990; in the second sample, where we conservatively view all the post-Cold War transitions as possibly endogenous, we also exclude Benin after 1990, Central African Republic after 1993, Congo-Brazzaville after 1992, Malawi, Mali after 1990, and Niger. In both cases, we compare the results to those obtained for the full sample of transitions.
Table 6 shows that our results are robust to using the alternative samples of transitions. In the case of education, the coefficients on Coethnic Leader become somewhat smaller but remain strongly significant in almost all the regressions. In the case of infant mortality, the coefficient on Coethnic Leader becomes even larger than in the benchmark regression. These findings confirm the existence of important causal effects of ethnic favoritism on education and health in Africa.
Ethnic Favoritism in Education and Infant Mortality: Robustness to the Exclusion of Potentially Endogenous Leadership Transitions

Notes: (1) All the regressions include Survey–Year of Birth FE, Survey–Ethnic Cluster FE, Survey–Ethnic Cluster specific time trends, and the individual controls from Tables 1 and 2. (2) The number of ethnic clusters in a country refers to the number of ethnic groups whose members became leaders of the country, plus one cluster comprising all the other groups. (3) In all the regressions, each observation is weighted by the inverse of the total number of observations in a country. (4) The “main sample” regressions are reported for easier comparison. They are identical to the regressions in columns (1)–(3) of Table 1 and column (1) of Table 2. (5) The regressions excluding the post-Cold War transitions exclude Benin after 1990, the Central African Republic after 1993, Congo-Brazzaville after 1992, Ethiopia after 1990, Malawi, Mali after 1990, and Niger. (6) Standard errors clustered at the Survey–Ethnic Cluster level are shown in brackets. (7) *** denotes significance at the 1% level, ** at the 5% level, * at the 10% level.
Robustness to Selection Effects
Another potential concern regarding our regression results pertains to the existence of selection effects in our data. In particular, richer and more educated individuals (and their children) may be either underrepresented (because they were more likely to emigrate to another country) or overrepresented (because they were more likely to survive) in the DHS surveys. However, it is doubtful that these selection effects can drive our empirical findings. First, to bias our estimates of ethnic favoritism, the selection effects should have systematically varied both across ethnic groups and across cohorts within ethnic groups in a way correlated with the patterns of interethnic leadership transitions. This seems to be quite unlikely. Second, even if the variation in selection effects was correlated with the patterns of interethnic leadership transitions, we would probably be more likely to underestimate (rather than overestimate) the effects of ethnic favoritism. For instance, consider the case of Kenya, where, as discussed earlier, the Kalenjin politician Daniel Arap Moi became the country's leader following the death of Jomo Kenyatta, a Kikuyu. If it were the case that many educated Kikuyu left Kenya when Arap Moi became president, then there would be fewer Kikuyu in the DHS surveys who benefited from ethnic favoritism under Kenyatta. Hence our results would be biased away from finding any evidence of ethnic favoritism. Third, the emigration rates for the 18 African countries in our sample appear to be quite low. For example, Defoort (Reference Defoort2008) estimates that between 1975 and 2000 the average emigration rate for these countries was only 0.6%.Footnote 41 This suggests that, even if present, the selection effects due to emigration are unlikely to be quantitatively important for our study.
Despite these considerations, we directly assess the robustness of our results to selection effects. We do so in two ways. First, the data collected by Docquier and Marfouk (Reference Docquier, Marfouk, Ozden and Schiff2006) indicate that for the 18 countries in our sample, the average emigration rates tend to be considerably higher for individuals with higher education (15.5% in 1990) or secondary education (1.4%) than for individuals with only primary education (0.4%). Therefore, to account for possible selection effects caused by emigration, we rerun regressions (1) and (2) without the respondents who were particularly likely to emigrate, i.e., without the respondents with higher education or without all the respondents who (at least) completed secondary school. Second, the oldest cohorts of respondents were probably less likely to survive and be included in the DHS surveys. Therefore, to account for the possibility that the variation in survival rates across ethnic groups affected our results, we rerun regressions (1) and (2) without the respondents above 59, 49, or 39 years of age.
Table 7 shows that our results are robust to excluding these alternative subgroups of respondents. In the case of education, the coefficients on Coethnic Leader remain large and strongly significant in almost all the regressions. In the case of infant mortality, the coefficient on Coethnic Leader also remains large, although it is imprecisely estimated when we exclude women above 39 years of age from our regression. Overall, these findings confirm that our estimates of ethnic favoritism are not driven by selection effects in our data.
Ethnic Favoritism in Education and Infant Mortality: Robustness to Selection Effects

Notes: (1) All the regressions include Survey–Year of Birth FE, Survey–Ethnic Cluster FE, Survey–Ethnic Cluster specific time trends, and the individual controls from Tables 1 and 2. (2) All the regressions in columns (1) to (3) use data from 18 countries, 40 surveys, and 183 survey–ethnic clusters. All the regressions in column (4) use data from 17 countries, 45 surveys, and 203 survey–ethnic clusters. The number of ethnic clusters in a country refers to the number of ethnic groups whose members became leaders of the country, plus one cluster comprising all the other groups. (3) In all the regressions, each observation is weighted by the inverse of the total number of observations in a country. (4) The “main sample” regressions are reported for easier comparison. They are identical to the regressions in columns (1)–(3) of Table 1 and column (1) of Table 2. These regressions use the respondents of all ages [in columns (1) and (2)] or the respondents above 49 years of age [in columns (3) and (4)]. (5) Standard errors clustered at the Survey–Ethnic Cluster level are shown in brackets. (6) *** denotes significance at the 1% level, ** at the 5% level, * at the 10% level.
We now turn to the comparative analysis of ethnic favoritism across African countries.
EXPLAINING CROSS-COUNTRY VARIATION IN ETHNIC FAVORITISM IN AFRICA
As we saw in Tables 3 and 4, the effects of ethnic favoritism on education and infant mortality differ across African countries. In this section, we evaluate several hypotheses that can explain these differences.
Theoretical Hypotheses
We examine three sets of hypotheses. First, some African leaders may have weaker ability to influence the primary education and infant mortality of their ethnic groups, because of either geographic constraints or inadequate public finance. Second, the incentives of the leaders to cater to the ordinary members of their groups may be affected by the political environments in their countries. Finally, the patterns of ethnic favoritism may depend on the cultural distance between the ethnic groups living in the same country.
Ethnic favoritism may be limited if the country has a large territory or if the members of the leader's ethnic group live far away from the capital city, where most government agencies are located. Under such geographic constraints, the leader may simply be unable to effectively provide benefits to his home area (Herbst Reference Herbst2000). We capture these constraints in two ways. First, we use the (logarithm of the) country's land area. Second, we construct the Distance to Capital for Ethnic Groups in Power variable by computing the average distance between the country's capital and the home areas of the ethnic groups whose leaders were in power.
The leader's inability to provide ethnic favors may also stem from a country's inadequate system of public finance. If the government has low administrative capacity to collect revenues, the leader may not have sufficient funds to spend on the education and health of his coethnics. To capture the fiscal constraints of African leaders, we use several measures of public finance, all expressed as percentages of GDP: the average tax revenue in 1970–2000, the average current revenue (excluding grants) in 1970–2000, the average total public expenditure in 1970–2000, and the average public expenditure on education in 1970–2000 or health in 1990–2000. We expect poor public finance to be correlated with lower levels of ethnic favoritism.
The second set of explanations that we consider pertain to differences in the countries’ political environments. The “quid pro quo” model discussed in the section “Should the leader's ethnicity matter in sub-Saharan Africa?” suggests that ethnic favoritism may be more prevalent in democracies than in autocracies, because democratic leaders need broader political support and may therefore have stronger incentives to cater to their coethnics. We use two measures of democracy: the country's average Polity2 score (Marshall and Jaggers Reference Marshall and Jaggers2005) during the period covered by our ethnic favoritism data and the fraction of years in which the country held multiparty elections in the same time period.
Although there is certainly some variation in the amount of democracy experienced by the African countries in our sample, all of them were predominantly autocratic during the time period of our study. Yet, even the authoritarian regimes may differ along important political dimensions, and these differences might have implications for ethnic favoritism.
At one extreme, we find the leaders who rule countries that are characterized by high political instability. These leaders are heavily preoccupied with their physical security and spend a large share of public funds on personal protection against constant threats of coups. In such circumstances, the leaders may be unlikely to help the ordinary members of their ethnic groups, because their support is nearly irrelevant to the leaders’ political (or even physical) survival. At the other extreme, we find authoritarian leaders who mobilize the masses by creating political parties and organizing single-party elections (Geddes Reference Geddes2005). Because these leaders actively seek broader political support, they are more likely to provide benefits to their coethnics, based on the logic of the “quid pro quo” model.
We account for these features of African politics by using several variables. To measure political instability, we compute the country's average number of successful or attempted (i.e., successful and unsuccessful) coups per year. To capture the leaders’ efforts at mass mobilization, we compute the fraction of years in which the country held single-party elections. We also combine our measures of single-party and multiparty elections and compute the fraction of years in which the country held either type of election.Footnote 42 We expect the coups to be associated with lower ethnic favoritism, and the single-party (or multiparty) elections to be associated with higher ethnic favoritism.
Finally, we examine whether the patterns of ethnic favoritism are related to cultural distance between the ethnic groups living in the same country. We consider three dimensions of ethnic distance.
First, ethnic favoritism may be more prevalent in countries whose groups speak structurally distant languages (Fearon Reference Fearon2003). To evaluate this hypothesis, we use two alternative measures: Fearon's index of cultural fractionalization and the difference between his ethnic and cultural fractionalization indices. The former measure captures not only the linguistic distances between the country's ethnic groups, but also the country's level of ethnic diversity, which might be less relevant for us. The latter measure, on the other hand, focuses solely on linguistic distances and may therefore better suit our purposes. Higher cultural fractionalization or a smaller difference between the ethnic and cultural fractionalization indices would indicate that the country's ethnic groups speak more distant languages, potentially making ethnic favoritism more likely.Footnote 43
Second, ethnic differences may be less important in countries with one dominant religion (Alesina et al. Reference Alesina, Devleeschauwer, Kurlat and Wacziarg2003). Four countries in our sample—Guinea, Mali, Niger, and Senegal—have such a dominant religion, with at least 85% of the population of each of these countries being Muslim (Alesina et al. Reference Alesina, Devleeschauwer, Kurlat and Wacziarg2003). In contrast, all the other fourteen countries that we study have much higher religious fractionalization.Footnote 44 To examine whether a common religion can reduce ethnic favoritism, we compare the average levels of favoritism in the two groups of countries by using the One Dominant Religion dummy variable.
Third, ethnic relations may be especially tense when groups are geographically segregated in a country's territory (Matuszeski and Schneider Reference Matuszeski and Schneider2006). Segregation may reduce cultural contact between the members of different groups and increase the salience of their ethnic differences, potentially leading to more ethnic favoritism. Segregation can also make it easier for leaders to exclude outsiders and target the distribution of public goods to their coethnics (Bates Reference Bates, Rothchild and Olorunsola1983; Caselli and Coleman Reference Caselli and John Coleman2006). We use the Ethnic Clustering index of Matuszeski and Schneider (Reference Matuszeski and Schneider2006) as our measure of the country's ethnic segregation.
To evaluate the hypotheses presented above, we run a series of regressions in which we interact the Coethnic Leader variable with the corresponding country-level variables introduced one at a time. Formally, we add an interaction term to equations (1) and (2) and estimate regressions of the form

Yiest is the value of one of our education or health outcomes for individual i from ethnic cluster e in survey s who was born in year t. CLest is the Coethnic Leader variable as defined in equations (1) and (2). Zc is one of the explanatory variables described in this section in country c.Footnote 45 We continue to include the usual set of fixed effects, ethnic-cluster specific linear time trends, and individual controls.
Whereas γ1 measures the main effect of ethnic favoritism, our primary goal is to estimate the interaction-term parameter γ2 that captures the cross-country relationship between the explanatory variable of interest Zc and the level of ethnic favoritism in education and health. In particular, a positive (negative) γ2 in the education regressions or a negative (positive) γ2 in the infant mortality regressions would indicate that ethnic favoritism is more prevalent in African countries with a higher (lower) level of Zc.
Empirical Results
Tables 8–10 show the results of our comparative analysis of ethnic favoritism. Table 8 evaluates the importance of geographic and fiscal constraints. Table 9 focuses on the role of political environment. Table 10 examines the role of cultural distance between the ethnic groups. Each table displays the regressions for primary school attendance and completion [columns (1) and (2)], female and male literacy [columns (3) and (4)], and infant mortality [column (5)]. Although for each regression we report the estimates and the standard errors (clustered at the survey-ethnic-cluster level) of both γ1 and γ2, our main focus is on γ2, which is emphasized in bold.
Explaining the Cross-country Variation in Ethnic Favoritism: The Role of Geographic and Fiscal Constraints

Notes: (1) The table shows coefficients and standard errors for Coethnic Leader and its interactions with the country-level variables introduced one at a time. Standard errors are clustered at the Survey–Ethnic Cluster level. (2) All the regressions include Survey–Year of Birth FE, Survey–Ethnic Cluster FE, Survey–Ethnic Cluster specific time trends, and the individual controls from Tables 1 and 2. (3) All the regressions in columns (1) to (3) use data from 18 countries, 40 surveys, and 183 survey–ethnic clusters. All the regressions in column (4) use data from 18 countries, 38 surveys, and 174 survey–ethnic clusters. All the regressions in column (5) use data from 17 countries, 45 surveys, and 203 survey–ethnic clusters. The number of ethnic clusters in a country refers to the number of ethnic groups whose members became leaders of the country, plus one cluster comprising all the other groups. (4) In all the regressions, each observation is weighted by the inverse of the total number of observations in a country. (5) The regressions in columns (1) to (5) have 1,133,245, 919,613, 366,346, 122,098 and 1,173,710 observations, respectively. (6) The regressions in columns (1) to (5) have an R 2 of 0.37, 0.34, 0.38, 0.30, and 0.04, respectively. (7) *** denotes significance at the 1% level, ** at the 5% level, * at the 10% level.
Explaining the Cross-country Variation in Ethnic Favoritism: The Role of Political Environment

Notes: (1) The table shows coefficients and standard errors for Coethnic Leader and its interactions with the country-level variables introduced one at a time. Standard errors are clustered at the Survey–Ethnic Cluster level. (2) All the regressions include Survey–Year of Birth FE, Survey–Ethnic Cluster FE, Survey–Ethnic Cluster specific time trends, and the individual controls from Tables 1 and 2. (3) All the regressions in columns (1) to (3) use data from 18 countries, 40 surveys, and 183 survey–ethnic clusters. All the regressions in column (4) use data from 18 countries, 38 surveys, and 174 survey–ethnic clusters. All the regressions in column (5) use data from 17 countries, 45 surveys, and 203 survey–ethnic clusters. The number of ethnic clusters in a country refers to the number of ethnic groups whose members became leaders of the country, plus one cluster comprising all the other groups. (4) In all the regressions, each observation is weighted by the inverse of the total number of observations in a country. (5) The regressions in columns (1) to (5) have 1,133,245, 919,613, 366,346, 122,098 and 1,173,710 observations, respectively. (6) The regressions in columns (1) to (5) have an R 2 of 0.37, 0.34, 0.38, 0.30, and 0.04, respectively. (7) *** denotes significance at the 1% level, ** at the 5% level, * at the 10% level.
Explaining the Cross-country Variation in Ethnic Favoritism: The Role of Cultural Distance

Notes: (1) The table shows coefficients and standard errors for Coethnic Leader and its interactions with the country-level variables introduced one at a time. Standard errors are clustered at the Survey–Ethnic Cluster level. (2) All the regressions include Survey–Year of Birth FE, Survey–Ethnic Cluster FE, Survey–Ethnic Cluster specific time trends, and the individual controls from Tables 1 and 2. (3) All the regressions in columns (1) to (3) use data from 18 countries, 40 surveys, and 183 survey–ethnic clusters. All the regressions in column (4) use data from 18 countries, 38 surveys, and 174 survey–ethnic clusters. All the regressions in column (5) use data from 17 countries, 45 surveys, and 203 survey–ethnic clusters. The number of ethnic clusters in a country refers to the number of ethnic groups whose members became leaders of the country, plus one cluster comprising all the other groups. (4) In all the regressions, each observation is weighted by the inverse of the total number of observations in a country. (5) The regressions in columns (1) to (5) have 1,133,245, 919,613, 366,346, 122,098 and 1,173,710 observations, respectively. (6) The regressions in columns (1) to (5) have an R 2 of 0.37, 0.34, 0.38, 0.30, and 0.04, respectively. (7) *** denotes significance at the 1% level, ** at the 5% level, * at the 10% level.
The results in Table 8 show that geographic constraints are not important in explaining the differences in ethnic favoritism across African countries. Countries that have a large territory or whose leaders come from ethnic groups that live far from the capital city do not display lower levels of ethnic favoritism.
Table 8 also shows that measures of public finance are important predictors of ethnic favoritism, although the nature of the relationship depends on whether we look at primary education or infant mortality. In line with our theoretical expectations, leaders who collect more revenues and have more resources to spend on the provision of public goods appear to have a greater ability to provide educational benefits to their ethnic groups. For example, a one-percentage-point increase in the country's current revenue (as a percentage of GDP) is associated with a 0.4-percentage-point increase in the effects of ethnic favoritism on primary school attendance and female literacy, and a 0.3-percentage-point increase in its effect on male literacy. Likewise, a one-percentage-point increase in the country's public expenditure on education (again as a percentage of GDP) is associated with a 1.5-percentage-point increase in the effect of ethnic favoritism on primary school attendance, a 2.4-percentage-point increase in its effect on female literacy and a 1-percentage-point increase in its effect on male literacy.
Surprisingly, however, countries with a stronger fiscal capacity are also characterized by weaker effects of ethnic favoritism on infant mortality. For example, we find that a one-percentage-point increase in the country's current revenue or total public expenditure (both as percentages of GDP) is associated with a 0.1-percentage-point decrease in the (negative) effect of ethnic favoritism on infant mortality. A priori it is not clear why greater fiscal resources would make it easier for leaders to improve educational outcomes of their coethnics rather than to reduce their infant mortality. Still, this finding is in line with Kramon and Posner (Reference Kramon and Posner2011)'s observation that governmental policies of ethnic favoritism are often not all-encompassing but limited to a few public goods. In any case, we leave it for future research to explain why different country leaders favor their coethnics through different policy channels.
Table 9 suggests that the political environment has little systematic effect on levels of ethnic favoritism in Africa. First, countries that have had longer experience with democracy do not display more ethnic favoritism. If anything, a higher average Polity 2 score and a higher frequency of multiparty elections tend to be associated with less ethnic favoritism, although it is only in the regressions for female literacy that the interaction coefficients are statistically significant on a consistent basis. Second, single-party elections also fail to be a good predictor of ethnic favoritism. Whether we consider them alone or together with the multiparty elections, the interaction coefficients are rarely significant and have inconsistent signs. Third, a higher frequency of successful or attempted coups does not seem to reduce the incentives of the leaders to provide ethnic favors. In the case of education, the interaction coefficients are negative and statistically significant in only two of the eight regressions. And in the case of infant mortality, a higher frequency of coups is actually associated with more rather than less ethnic favoritism.Footnote 46
Table 10 shows that the interactions of Coethnic Leader with the two measures of linguistic distance based on Fearon (Reference Fearon2003) or with the Ethnic Clustering index of Matuszeski and Schneider (Reference Matuszeski and Schneider2006) tend to produce statistically insignificant coefficients. Thus, ethnic favoritism does not appear to be more prevalent in countries whose ethnic groups speak more distant languages or live in geographically segregated areas. In contrast, our evidence suggests that the existence of one dominant religion—in our case Islam—may have limited ethnic favoritism. In particular, we find that in Guinea, Mali, Niger, and Senegal the effects of ethnic favoritism on primary school attendance, primary school completion, and female literacy are between 2 and 3 percentage points smaller, and the effect of ethnic favoritism on infant mortality is 0.7 percentage points smaller, than the corresponding effects in the other, more religiously fragmented, countries in our sample. Thus, the average effects of ethnic favoritism in sub-Saharan Africa that we found in Tables 1 and 2 are entirely driven by the latter group of countries, whereas in the former four countries the leader's ethnicity did not matter much for education or infant mortality.Footnote 47
While we emphasize the existence of one common religion as the main factor behind the low levels of ethnic favoritism in Guinea, Mali, Niger, and Senegal, there are two alternative explanations for this finding. First, it may be that it is not the existence of one common religion but the large number of Muslims per se that reduces ethnic favoritism in these countries. Second, as argued by Dunning and Harrison (Reference Dunning and Harrison2010), the limited impact of ethnic differences in Guinea, Mali, and Senegal can be potentially explained by the cross-ethnic family alliances of “cousinage,” which date back to the Mali empire (1230 to c. 1600).
Although we cannot completely rule out these alternative explanations, there are two reasons why they may be less important in explaining the cross-country patterns of ethnic favoritism identified in Table 10. First, while it is relatively easy to think about mechanisms through which one common religion could reduce ethnic tensions, it is theoretically much less clear why a mere increase in the Muslim population in a country (say, from 40% to 60%) would have the same effect. Second, it appears likely that the creation and persistence of the institution of cousinage were facilitated by the fact that the vast majority of the ethnic groups involved in these alliances held the same religious beliefs (i.e., Islam). Thus, the institution of cousinage can be viewed as one particular channel through which a more fundamental factor, a common religion, could have reduced ethnic favoritism in Guinea, Mali, and Senegal.Footnote 48
To sum up, our cross-country analysis of ethnic favoritism provides several findings. First, we find mixed evidence on the effects of fiscal constraints on ethnic favoritism. While stronger fiscal capacity may have enabled African leaders to provide greater ethnic favors in education, it is associated with less ethnic favoritism in infant mortality. Second, ethnic divisions in Guinea, Mali, Niger, and Senegal may have been attenuated by the existence of one dominant religion, leading to lower ethnic favoritism in these countries. Third, we find surprisingly little correlation between ethnic favoritism and political factors. Finally, geographic constraints, linguistic differences, or patterns of ethnic segregation are also found to be poor predictors of ethnic favoritism.
CONCLUSION
In this article we have reassessed the role of ethnic favoritism in sub-Saharan Africa. Using data on primary education and infant mortality from 18 African countries, we found that the effects of ethnic favoritism are quite large and widespread. These results provide evidence in support of ethnicity-based explanations of Africa's underdevelopment. Although we have discussed several theories that can account for the effects of ethnic favoritism in Africa, further research is needed to find which of them are more important in practice. It would be especially interesting to learn more about the role of ethnic “quid pro quo” in African politics and to identify the specific mechanisms through which it operates.
We also made a step toward a comparative analysis of ethnic favoritism by studying its economic, political and cultural correlates across African countries. Yet the conclusions we reach in the section “Explaining cross-country variation in ethnic favoritism in Africa” are far from definitive. In particular, we need a better understanding of the role of the political environment in shaping the leader's incentives to provide ethnic favors. Indeed, somewhat surprisingly, our results indicate that ethnic favoritism is equally present in African democracies and autocracies, suggesting that democratically elected politicians and autocratic rulers may face quite similar incentives for ethnic redistribution. In future research, it would be interesting to compare the roles of political parties in channeling ethnic pork in democracies and autocracies, as well as to study the relationship between ethnic favoritism and political instability in the two types of regimes.
Future work could also provide more detailed evidence on the specific channels through which African leaders improve the education and health of their coethnics. In this respect, it would be interesting to assess the relative importance of various policies of ethnic favoritism (e.g., building new schools and hospitals, hiring additional teachers and doctors, or increasing the availability of textbooks and drugs) that directly focus on improving educational and health outcomes. It would also be worth analyzing the effects of more general policies of ethnic favoritism (e.g., cash transfers or allocation of public-sector jobs) on education and health. Moreover, it seems important to examine how policies of ethnic favoritism can affect education and infant mortality by changing people's expectations about future economic prospects. Learning more about the specific effects of ethnic favoritism is not only interesting per se, but may also explain why we find that stronger fiscal capacity is associated with more ethnic favoritism in education but with less ethnic favoritism in infant mortality.
Finally, while our study focused on the ethnicity of the country's main political leader, this measure does not capture all the aspects of African ethnic politics. In particular, leaders in both democratic and authoritarian regimes may need to form interethnic ruling coalitions in order to stay in power. Because these coalitions can have important economic consequences for the ethnic groups involved, we hope that their systematic study will also be the subject of future research.
African Countries and DHS Surveys Used in the Analysis
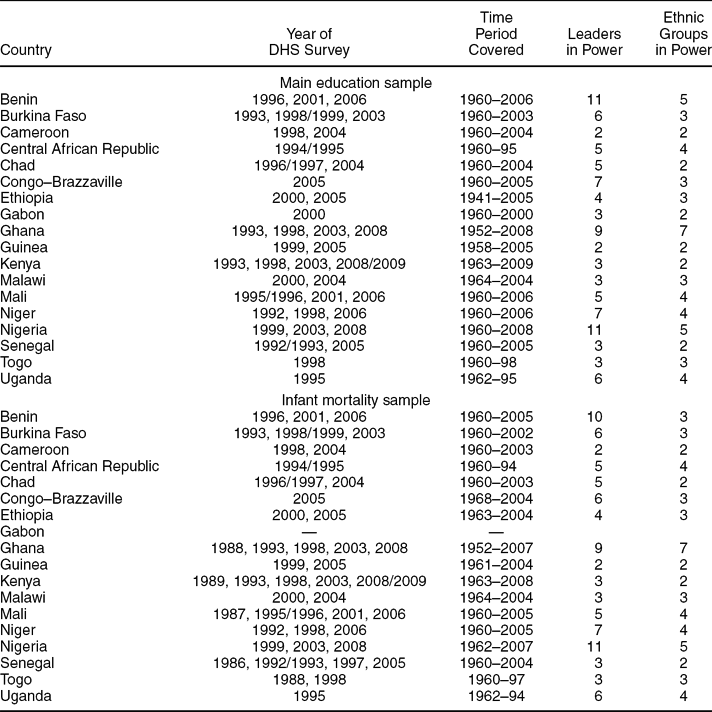
Notes: (1) For the main education sample, the “time period covered” refers to the years in which at least some respondents were between 6 and 13 years old. (2) For the infant mortality sample, the “time period covered” refers to the years in which at least some children of the interviewed mothers were born. (3) “Leaders in power” include all the leaders who stayed in power for the majority of at least one calendar year. A new (nonconsecutive) term in office of the old leader is counted as a new “leader”.
Summary statistics

Notes: (1) In the education and infant mortality samples, each observation is weighted by the inverse of the total number of observations in a country. (2) The country-by-country estimates of the effects of ethnic favoritism are from Tables 3 and 4. These estimates are not used in any of the regressions, but their summary statistics may be helpful in interpreting the results in Tables 8–10.
Explaining Cross-country Variation in Ethnic Favoritism: The Roles of One Dominant Religion, Islam, Cousinage, and French Colonization

Notes: (1) The table shows coefficients and standard errors for Coethnic Leader and its interactions with the country-level variables introduced one or two at a time. Standard errors are clustered at the Survey–Ethnic Cluster level. (2) All the regressions include Survey–Year of Birth FE, Survey–Ethnic Cluster FE, Survey–Ethnic Cluster specific time trends, and the individual controls from Tables 1 and 2. (3) All the regressions in columns (1) to (3) use data from 18 countries, 40 surveys, and 183 survey–ethnic clusters. All the regressions in column (4) use data from 18 countries, 38 surveys, and 174 survey–ethnic clusters. All the regressions in column (5) use data from 17 countries, 45 surveys, and 203 survey–ethnic clusters. The number of ethnic clusters in a country refers to the number of ethnic groups whose members became leaders of the country, plus one cluster comprising all the other groups. (4) In all the regressions, each observation is weighted by the inverse of the total number of observations in a country. (5) The regressions in columns (1) to (5) have 1,133,245, 919,613, 366,346, 122,098, and 1,173,710 observations, respectively. (6) The regressions in columns (1) to (5) have an R 2 of 0.37, 0.34, 0.38, 0.30, and 0.04, respectively. (7) *** denotes significance at the 1% level, ** at the 5% level, * at the 10% level.
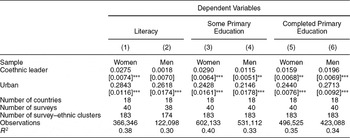
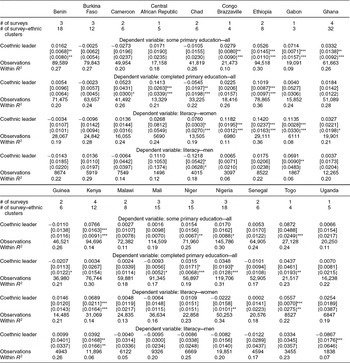
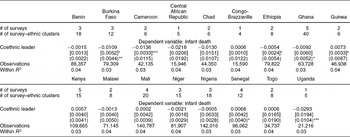
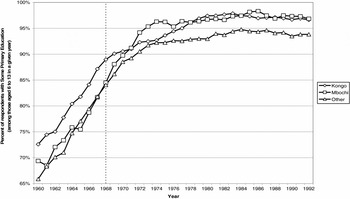
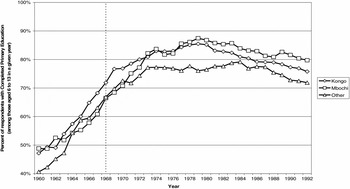
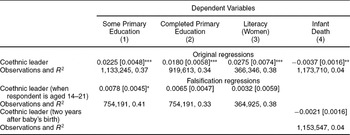
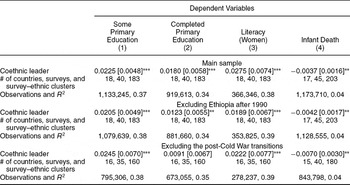
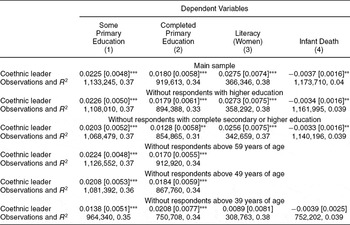
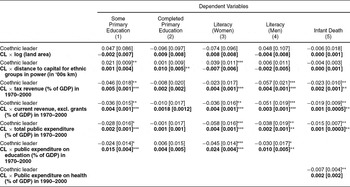
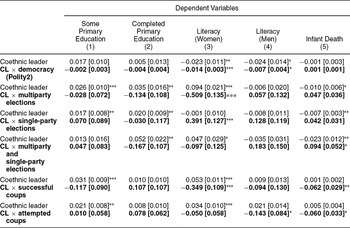
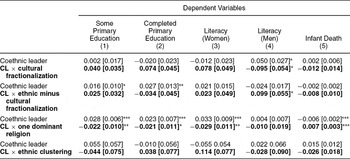
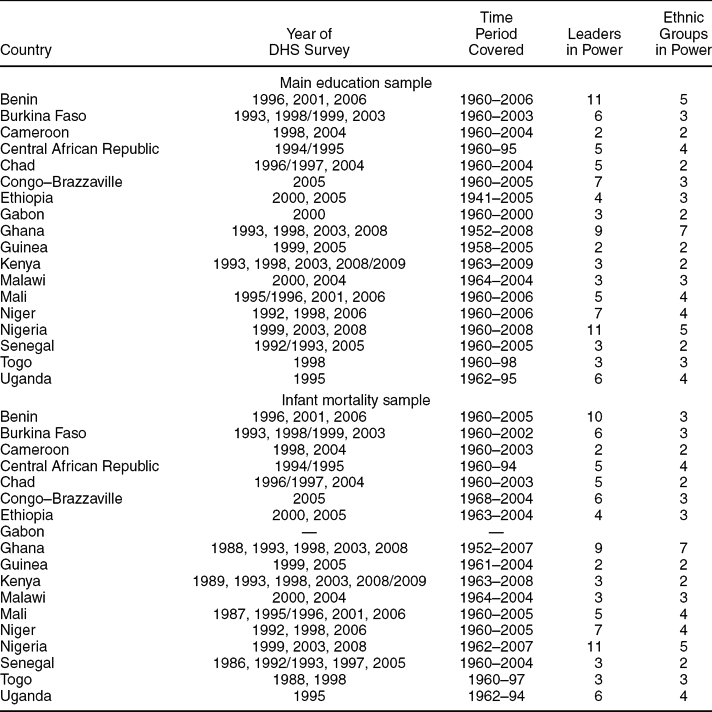
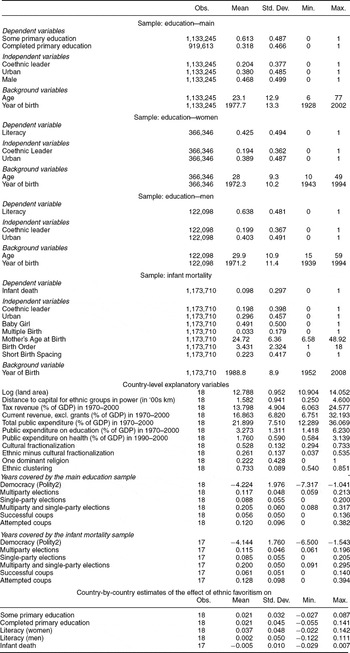
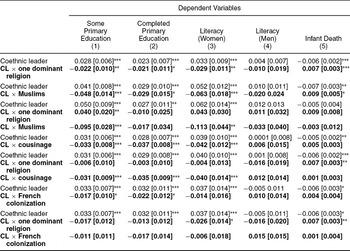



Comments
No Comments have been published for this article.