


Parkinson’s disease (PD) is one of the most common neurodegenerative disorders affecting older individuals. More than 6 million people worldwide suffer from PD, and this number is expected to increase significantly as the population ages (GBD 2016 Parkinson’s Disease Collaborators, 2018). One of the major pathological features of PD is the accumulation of misfolded α-synuclein into Lewy bodies and Lewy neurites (Mahul-Mellier et al., Reference Mahul-Mellier, Burtscher, Maharjan, Weerens, Croisier, Kuttler, Leleu, Knott and Lashuel2020). This pathological hallmark causes motor symptoms, such as tremors, stiffness, and bradykinesia, as well as a range of nonmotor symptoms, including hyposmia, mood disorders, sleep disturbance, and cognitive impairment, which can lead to reduced mobility, function, and quality of life for PD patients (Armstrong & Okun, Reference Armstrong and Okun2020; Mu et al., Reference Mu, Chaudhuri, Bielza, de Pedro-Cuesta, Larrañaga and Martinez-Martin2017).
Over the past decade, an emerging perspective has emphasized the significance of immune dysfunction and the immune system as a potentially pivotal component of PD etiology (Zhu et al., Reference Zhu, Yin, Zhao and Zhang2022). A substantial epidemiological study has revealed the risk of PD in patients with autoimmune diseases is 33% higher, indicating that autoimmune diseases may play a role in promoting or inhibiting the pathogenesis of PD (Li et al., Reference Li, Sundquist and Sundquist2012). Accumulated evidence indicates that both cellular and humoral immune responses are altered in PD patients (Kustrimovic et al., Reference Kustrimovic, Comi, Magistrelli, Rasini, Legnaro, Bombelli, Aleksic, Blandini, Minafra, Riboldazzi, Sturchio, Mauri, Bono, Marino and Cosentino2018; Wijeyekoon et al., Reference Wijeyekoon, Kronenberg-Versteeg, Scott, Hayat, Jones, Clatworthy, Floto, Barker and Williams-Gray2018). Additionally, several PD-related genes, such as leucine-rich repeat kinase 2 (LRRK2) and parkin RBR E3 ubiquitin-protein ligase (PRKN), have been found to play functional roles in immune processes (Matheoud et al., Reference Matheoud, Sugiura, Bellemare-Pelletier, Laplante, Rondeau, Chemali, Fazel, Bergeron, Trudeau, Burelle, Gagnon, McBride and Desjardins2016; Rivas et al., Reference Rivas, Avila, Koskela, Huang, Stevens, Pirinen, Haritunians, Neale, Kurki, Ganna, Graham, Glaser, Peter, Atzmon, Barzilai, Levine, Schiff, Pontikos, Weisburd and Daly2018). However, the mechanisms by which innate or adaptive immune systems regulate immune responses in PD remain poorly understood.
In recent years, high-throughput technology has not only provided more comprehensive genetic characterization for various diseases but has also been able to identify new and more accurate biomarkers (Chowdhary et al., Reference Chowdhary, Khare, Patel, Koppu, Kaluri and Rajput2022). Several diagnostic models for PD have been reported. Zhao et al. (Reference Zhao, Zhang, Ji, Shi, Lai, Chi, Huang and Cheng2022) developed a PD diagnostic model using proptosis-related genes, with an area under the curve (AUC) of 0.752 in the corresponding ROC curve. Similarly, another study constructed a biomarker panel of 85 genes with decreased expression and increased DNA in PD using linear regression analysis, and developed a gene expression classifier with an AUC of 0.74 and two gene methylation classifiers with AUCs of 0.685 and 0.677 based on all or dominant methylation-altered region CpGs (Wang et al., Reference Wang, Chen, Yang, Zhang and Wong2019). All of these models show good predictive power for PD diagnosis. However, the diagnostic performance of these models still needs to be improved. In this study, we aimed to identify the predictive markers and develop a diagnostic model with predictive markers for PD and investigate the roles of immune cells in the disease pathology. Our study may contribute to improving the accuracy of PD diagnosis and elucidating the potential role of immune cells in PD pathology.
Materials and Methods
Data Preparation
We obtained microarray datasets from the public GEO database (https://www.ncbi.nlm.nih.gov/geo). The following were inclusion criteria for the database: (1) each dataset contained the human gene expression profiles of both PD patients and healthy controls; (2) there were at least five PD and control tissue samples in each dataset; and (3) the series matrix file was available. Using these criteria, we downloaded series matrix files from GSE72267 (Calligaris et al., Reference Calligaris, Banica, Roncaglia, Robotti, Finaurini, Vlachouli, Antonutti, Iorio, Carissimo, Cattaruzza, Ceiner, Lazarevic, Cucca, Pangher, Marengo, di Bernardo, Pizzolato and Gustincich2015) containing blood samples of 40 PD patients and 19 healthy controls, and GSE22491 (Mutez et al., Reference Mutez, Larvor, Leprêtre, Mouroux, Hamalek, Kerckaert, Pérez-Tur, Waucquier, Vanbesien-Mailliot, Duflot, Devos, Defebvre, Kreisler, Frigard, Destée and Chartier-Harlin2011) containing blood samples of 10 PD patients and 8 healthy controls from GEO and retrieved the group information and expression data using the ‘GEOquery package’ of R software. All datasets were preprocessed, normalized, and log2-transformed. We observed that GSE72267 (sporadic PD) and GSE22491 (LRRK2-related PD) represent distinct genetic subtypes of PD. This heterogeneity reflects the diversity of PD in etiology and clinical manifestations. Nonetheless, we acknowledge that such heterogeneity may have an impact on the generalization of the model.
DEGs Screening
DEGs between the two groups in GSE72267 were screened by the ‘limma’ package. The genes that met the criterion of ‘p < .05 and |fold-change| > 1.2’ were considered statistically significant. A volcano plot displaying all DEGs was generated using the ‘ggplot2’ package, and we constructed a heatmap of the top 10 DEGs using the ‘pheatmap’ of the R package.
Functional Enrichment Analysis
Gene ontology (GO) enrichment analyses of upregulated and downregulated DEGs were performed using Bioconductor’s ‘clusterProfiler’ package of the R package. For the reference gene set, we chose the ‘h.all.v7.2.symbols’ collection in the Molecular Signatures Database (MsigDB) and executed GSEA on all-gene profiling with the above package. Enrichment results with a nominal p < .05 and false discovery rate (FDR) < 0.25 were considered statistically significant. The leading edges analysis was performed by the ‘Pi’ package.
PPI Network Analysis
To illustrate the potential relation between the DEGs, we conducted a PPI network using STRING (https://string-db.org/), an online database of known and predicted protein interactions. The network was established with a threshold value of a combined score > 0.4 and visualized by Cytoscape (v3.7.2). All proteins or genes were scored by CytoHubba, a Cytoscape plugin, to identify the hub genes in the network (Clustering Coefficient > 0.25 and maximal clique centrality (MCC) > 30).
LASSO Model Construction and Performance Assessment
We employed the LASSO logistic regression to screen the diagnostic markers for PD. The LASSO model was built using the ‘glmnet’ package by utilizing the expression matrix of hub genes. In this study, the dataset was randomly split into training and testing datasets (50% : 50%) with the ‘caret’ of the R package. We evaluated the model by fitting it to the training set and used the fitted model to predict the test set. We further validated the model in an independent validation dataset, GSE22491. Ultimately, we used the ‘pROC’ package to generate ROC curves and the ‘ggplot2’ package to visualize the performance of the model.
Immune Infiltration Analysis
The set of 28 immune cell marker genes used in this study was integrated from the validated marker genes in the TCGA Immunogenomic Program (Danaher et al., Reference Danaher, Warren, Dennis, D’Amico, White, Disis, Geller, Odunsi, Beechem and Fling2017) and the GEO single-cell database (Lu et al., Reference Lu, Li, Suo, Huang, Wang, Han and Cao2022). We then calculated the ssGSEA scores for each sample and created boxplots using the ‘ggplot2’ package to visualize the differences in immune cell abundance. Finally, we generated a correlation matrix and heatmap to illustrate the correlations among the 28 immune cell subpopulations using the ‘corrplot’ R package. Furthermore, the differential expression of those diagnostic markers between the two groups was visualized using boxplots, while the correlation between these genes and immune subtypes in PD patients was represented using lollipop plots. Multiple testing correction was applied when assessing correlations between diagnostic genes and immune cell subtypes.
Results
DEG Screening Between the Control and PD Groups
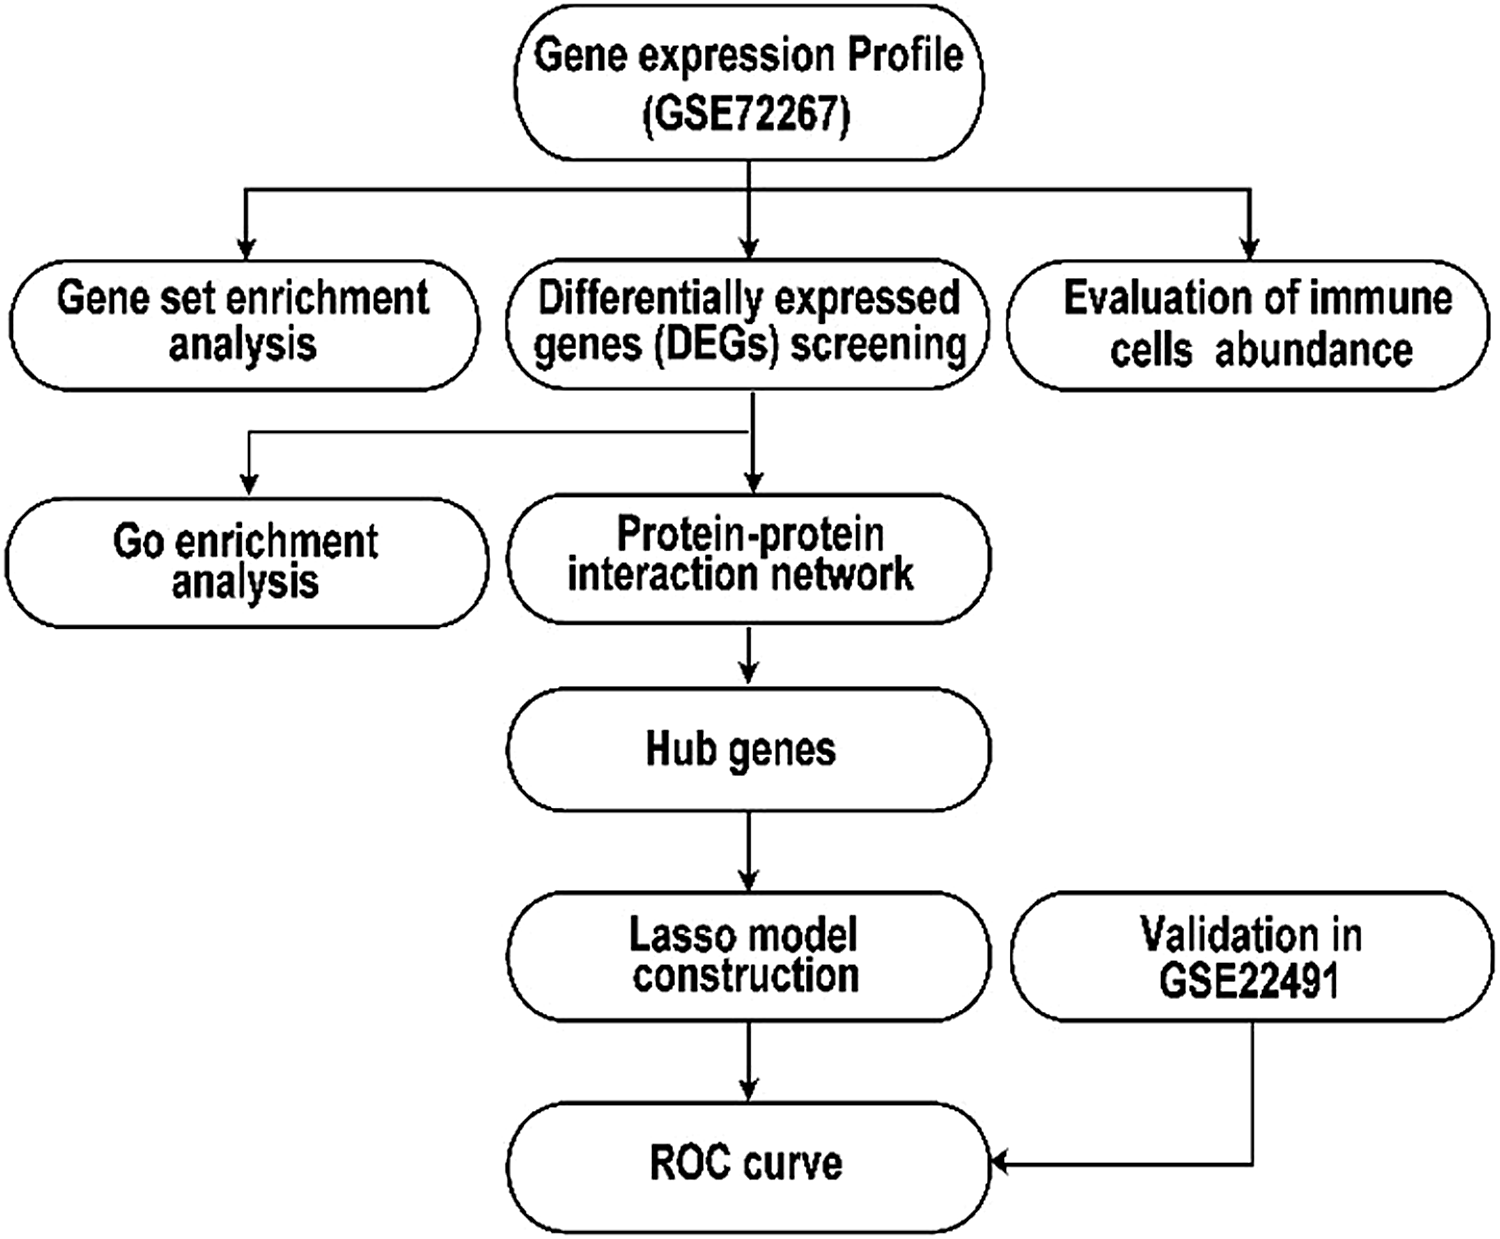
As shown in Figure 1, we identified 264 DEGs in GSE72267 by employing the criteria of ‘p < 0.05 and fold-change >1.2’, with 104 upregulated and 164 downregulated in the PD group in comparison with the control group. The DEGs were visualized in a volcano map (Figure 2A). Furthermore, we visualized the top 10 DEGs in a heatmap (Figure 2B).
Graphical illustration of the workflow.

Differential expression genes (DEGs) visualizing. (A) Volcano plot of DEGs; orange represents upregulated and blue represents downregulated, while genes without differentially expression are indicated in grey. (B) Heatmap for the top 10 DEGs.

Functional Enrichment Analysis of the 264 DEGs
We performed Gene Ontology (GO) enrichment and Gene Set Enrichment Analysis (GSEA) to analyze the biological functions and pathways of those DEGs. GO enrichment indicated that the upregulated genes were primarily associated with the regulations of MAP kinase activity, interleukin-6 (IL-6) production, and response to cAMP terms (Figure 3A). The downregulated genes were mainly enriched for the B cell proliferation, G protein-coupled chemoattractant receptor (GPCR) activity and chemokine receptor activity functions terms (Figure 3B). GSEA revealed that IL6-JAK-STAT3 signaling, the inflammatory response, and P53 signaling were significantly activated in the PD group (Figure 3C). Notably, the leading-edge analysis highlighted the involvement of several key genes, including CD14, CD82, CXCL9, IL7, FAS, and TGFB1, in at least two of the three enriched pathways (Figure 3D). Collectively, our results supported the notion of immune response playing a potentially important role in PD progression.
Functional enrichment analysis. (A) GO enrichment analysis of upregulated genes. (B) GO enrichment analysis of downregulated genes. (C) Gene set enrichment analysis (GSEA) of all genes. (D) Leading edges analysis of the above three pathways.

PPI Network Analysis and Hub Gene Calculation
A PPI network consisting of 173 nodes and 335 edges was successfully constructed. The connectivity degrees of nodes were differentiated by red, orange, and yellow colors, indicating high, high-intermediate, and intermediate connectivity respectively. Based on the scores of all proteins in the PPI network, 30 hub genes were identified using the network centrality algorithm (Figures 4A, 4B). Notably, CD19, CD79B, CD40, CXCR5, CXCR3, CCR9, and SIGLEC were among the hub genes identified.
Hub gene calculation and protein-protein interaction (PPI) network. (A) Hub genes calculation; dark orange represents the MCC algorithm, and blue represents the Clustering Coefficient algorithm. (B) PPI network of 30 hub genes. Each node represents a gene and each edge indicates the interaction between genes. Red, orange, and yellow represent high, high-intermediate, and intermediate connective degrees respectively.

LASSO Model Construction and Performance Assessment
To further investigate the potential diagnostic value of these hub genes, we applied the least absolute shrinkage and selection operator (LASSO) algorithm to the expression profiles of these 30 hub genes using a training dataset. Seven feature genes with nonzero coefficients were obtained in the LASSO regression model when the value of lambda.min was equal to 0.04157 (Figure 5A), including CD79B, CD40, CCR9, ADRA2A, SIGLEC1, FLT3LG, and THBD. A predictive index was then calculated based on the expression levels of these seven genes using a specific formula: index = CD79B × 0.13397380 + CD40 × (-0.52086772) + CCR9 × (-0.29455256) + ADRA2A × (-0.11868577) + SIGLEC1 × 0.09235028 + FLT3LG × (-0.06840066) + THBD × 0.09333945. To evaluate the diagnostic performance of the model, a receiver operating characteristic (ROC) analysis was performed using an internal test set. The diagnostic model had a good diagnostic accuracy, with an AUC of 0.870 (Figure 5B). The diagnostic performance was confirmed in the validation set (GSE22491), and an AUC was 0.825 (Figure 5B). Collectively, our results suggested that the seven-gene model had the potential to serve as a biomarker for PD.
Building and verification of the LASSO diagnostic model. (A) LASSO logistic regression algorithm to screen potential diagnostic markers. There were seven feature genes with nonzero coefficients in the LASSO model when the value of lambda.min = 0.04157 (left dotted line). (B) The ROC (Receiver Operating Characteristic) curve of the diagnostic efficacy in the test dataset and validation dataset.

Immune Infiltration in PD
To further explore the immune infiltration in PD, ssGSEA was performed to estimate the relative proportions of various immune cell subtypes. There were striking differences between the PD and control groups. Specifically, regulatory T cells (Tregs) and natural killer T cells were elevated, while activated B cells were decreased in the PD group in comparison with the control group (Figure 6A).
Immune cells abundance landscape. (A) Boxplot of the differential abundance of 28 immune cell subsets; the red marks indicate statistically significant differences between Parkinson’s disease patients and controls. (B) Heatmap showing the correlation of 28 immune cells. Squares size represents the relative strength of immune cell relationships; blue (red) represents a positive (negative) correlation. A darker color indicates a stronger correlation.

To investigate the correlation among immune subsets, we constructed a correlation heatmap of the 28 immune subpopulations (Figure 6B). It showed that monocytes had a significant positive correlation with activated dendritic cells, central memory CD8 T cells, macrophages, T follicular helper cells, and natural killer cells respectively. Moreover, monocytes had a negative correlation with activated CD4 T cells. Additionally, type 2 T helper cells and effector memory CD4 T cells exhibited a significant positive correlation.
We then compared the diagnostic gene expression differences between the PD and control groups. There were five downregulated genes (CD79B, CD40, CCR9, ADRA2A, and FLT3LG) and two upregulated genes (SIGLEC1 and THBD) in the PD group (Figure 7A-7G). Additionally, we examined the association between diagnostic markers and immune cell subtypes in PD patients, which revealed broad associations between genes and immune cells. Our findings demonstrated that CD79B and CD40 were significantly positively correlated with activated B cells while significantly negatively correlated with memory B cells and CD56 bright natural killer cells (Figure 8A, 8B). Interestingly, CCR9 and ADRA2A were significantly correlated with all immune cells in PD patients (Figure 8C, 8D). SIGLEC1 showed a positive correlation with type 2 T helper cells and a negative correlation with activated CD8 T cells (Figure 8E). FLT3LG was positively correlated with central memory CD4 T cells and negatively correlated with natural killer cells and immature dendritic cells (Figure 8F). THBD was positively correlated with natural killer T cells and neutrophils, while negatively correlated with gamma delta T cells (Figure 8G).
Differential expression of the diagnostic markers between Parkinson’s disease and control groups in GSE72267. (A-G) The expression levels of CD79B (A), CD40 (B), CCR9 (C), ADRA2A (D), SIGLEC1 (E), FLT3LG (F), and THBD (G) between the PD and control groups.

The correlation of the diagnostic markers and immune subtypes in Parkinson’s disease (PD) patients. (A-G) Lollipop plots depicting person correlation between immune subtypes and diagnostic markers of CD79B (A), CD40 (B), CCR9 (C), ADRA2A (D), SIGLEC1 (E), FLT3LG (F), and THBD (G) in PD patients.

Discussion
PD is a neurodegenerative disorder characterized by the progressive loss of dopaminergic neurons in the substantia nigra (Dickson, Reference Dickson2012). PD diagnosis is based on medical history, clinical examinations, neurological scales, response to dopaminergic medications, and the exclusion of other diseases (Marsili et al., Reference Marsili, Rizzo and Colosimo2018). Although PD is a multifactorial disease, both in vitro and in vivo studies have indicated that inflammatory processes and compensatory reactions are involved (Herrero et al., Reference Herrero, Estrada, Maatouk and Vyas2015). Several researches have demonstrated that myeloid and lymphoid populations (T and B cells) in the central nervous system may play a critical role in some neurodegenerative diseases, such as PD (Brochard et al., Reference Brochard, Combadière, Prigent, Laouar, Perrin, Beray-Berthat, Bonduelle, Alvarez-Fischer, Callebert, Launay, Duyckaerts, Flavell, Hirsch and Hunot2009; Doorn et al., Reference Doorn, Moors, Drukarch, van de Berg, Lucassen and van Dam2014; Sommer et al., Reference Sommer, Marxreiter, Krach, Fadler, Grosch, Maroni, Graef, Eberhardt, Riemenschneider, Yeo, Kohl, Xiang, Gage, Winkler, Prots and Winner2018) and Alzheimer’s disease. In this study, we aimed to identify potential biomarkers for PD diagnosis and explore the roles of immune cells in the disease.
Recent advances in high-throughput technologies have enabled the identification of new and more accurate biomarkers for PD and other diseases through detailed genetic characterizations, and the growing availability of computationally intelligent techniques has been beneficial in the development of diagnostic models (Boutet et al., Reference Boutet, Madhavan, Elias, Joel, Gramer, Ranjan, Paramanandam, Xu, Germann, Loh, Kalia, Hodaie, Li, Prasad, Coblentz, Munhoz, Ashe, Kucharczyk, Fasano and Lozano2021; Kumar et al., Reference Kumar, Lalotra, Sasikala, Rajput, Kaluri, Lakshmanna, Shorfuzzaman, Alsufyani and Uddin2022; Selvaraj et al., Reference Selvaraj, Paulraj, Ramadass, Kaluri, Shorfuzzaman, Alsufyani and Uddin2022). In this study, we used LASSO regression analysis to build a simpler and more interpretable prediction model for PD, which can improve the generalizability of the model and reduce overfitting. Additionally, LASSO regression analysis can handle high-dimensional data with a large number of predictors (Tibshirani, Reference Tibshirani1996).
In this study, we obtained the PD-related gene expression datasets from the GEO database and identified 264 DEGs. GO enrichment revealed that these DEGs were significantly associated with the regulation of IL-6 production and the activities of MAP kinases, GPCR, and chemokine receptors. The above results suggest that these DEGs play important roles in immune processes and signal transduction in PD patients. Additionally, we discovered that some pathways, such as IL6-JAK-STAT3, inflammatory response, and P53, were enriched in the PD group by using GSEA. It has been reported that the IL6-JAK-STAT3 signaling pathway widely participates in physiological processes, including cell growth, differentiation, and immune response (Niwa et al., Reference Niwa, Kanda, Shikauchi, Saiura, Matsubara, Kitagawa, Yamamoto, Kubo and Yoshikawa2005). Notably, increased levels of proinflammatory cytokines, including IL-6, have been observed in the brain and cerebrospinal fluid of PD patients, indicating that inflammation is involved in the disease progression (Lin et al., Reference Lin, Chen, Chiang, Liou, Chang, Lu, Chuang, Tai, Cheng, Lin and Wu2019). P53 is involved in diverse biological pathways, and P53 activation has been implicated in PD pathogenesis (Wolfrum et al., Reference Wolfrum, Fietz, Schnichels and Hurst2022). Its selective depletion in dopaminergic neurons improves their survival and behavioral motor deficits in a PD mouse model (Qi et al., Reference Qi, Davis, Chiang, Filichia, Barnett, Greig, Hoffer and Luo2016). Our results are consistent with the above previous studies.
To narrow down the list of candidate genes, we employed the MCC and clustering coefficient algorithms to identify 30 hub genes for model building. The LASSO regression analysis was then used to further shrink seven candidate genes, namely CD79B, CD40, CCR9, ADRA2A, SIGLEC1, FLT3LG, and THBD, as diagnostic markers for PD, with an AUC of 0.870 in test dataset and 0.825 in the validation set. According to our findings, the seven-gene model seems likely to be a biomarker for PD. Our results showed that their expression levels were significantly different in the PD group in comparison with the control group. Interestingly, some of these genes have previously been demonstrated to be associated with PD. For example, CD79B expression was significantly decreased in the peripheral blood of PD patients (Kedmi et al., Reference Kedmi, Bar-Shira, Gurevich, Giladi and Orr-Urtreger2011), and the variant of ADRA2A was associated with the frequency of insomnia in the PD group (Blauwendraat et al., 2019). Stimulation of microglia and astrocytes via CD40 signaling upregulates inducible nitric oxide synthase and cyclooxygenase-2, two known molecules involved in the pathogenesis of PD, causing selective loss of dopaminergic neurons in cell cultures (Okuno et al., Reference Okuno, Nakatsuji, Kumanogoh, Moriya, Ichinose, Sumi, Fujimura, Kikutani and Sakoda2005). Furthermore, SIGLEC1 was related to alpha-synuclein regulation (Sarkar et al., Reference Sarkar, Dammer, Malovic, Olsen, Raza, Gao, Xiao, Oliver, Duong, Joers, Seyfried, Huang, Kukar, Tansey, Kanthasamy and Rangaraju2020). However, the function of other candidates (CCR9, FLT3LG, and THBD) in PD has not been reported and deserves further study.
To evaluate the different patterns of immune cell abundance in PD individuals and healthy controls, ssGSEA was conducted. The results revealed that the increased abundance of natural killer T cells and Tregs accompanied by a decreased abundance of activated B cells may be relevant to the development of PD. Previous studies have shown that the activation of Tregs in the presence of antigen-presenting cells (APCs) can effectively inhibit the inflammatory response and the induction of effector T cells. Tregs can increase the expression level of neurotrophins released by astrocytes, thus effectively driving a neurotoxic environment to an opposite state (Schwab et al., Reference Schwab, Thurston, Machhi, Olson, Namminga, Gendelman and Mosley2020). Given that Tregs processes are often compromised in acute neuronal damage and chronic neurodegenerative diseases due to decreased numbers or dysfunction, Tregs may represent a promising therapeutic target for PD (Álvarez-Luquín et al., Reference Álvarez-Luquín, Arce-Sillas, Leyva-Hernández, Sevilla-Reyes, Boll, Montes-Moratilla, Vivas-Almazán, Pérez-Correa, Rodríguez-Ortiz, Espinoza-Cárdenas, Fragoso, Sciutto and Adalid-Peralta2019). Horvath and Ritz (Reference Horvath and Ritz2015) found that compared to the healthy controls, PD patients display fewer B cells. Similarly, Stevens et al. (Reference Stevens, Rowe, Morel-Kopp, Orr, Russell, Ranola, Ward and Halliday2012) reported a small reduction in the number of CD19+ B cells in the peripheral blood of PD patients. Interestingly, Kedmi et al. (Reference Kedmi, Bar-Shira, Gurevich, Giladi and Orr-Urtreger2011) found a decreased expression of B cell-related genes only in female PD patients. Regrettably, to our knowledge, no previous study has addressed the association between natural killer T cells and PD. Natural killer T cells could have been underestimated due to their small population in peripheral blood. Our findings are largely in keeping with previous studies, illustrating that lymphoid cells may play important roles in PD etiology and should be further explored in later studies.
In addition, we also analyzed the correlations between different immune cell subsets. Our results revealed that activated dendritic cells, central memory CD8 T cells, macrophages, T follicular helper cells, and natural killer cells are closely related to monocytes, and type 2 T helper cells are closely related to effector memory CD4 T cells. Increasedα-synuclein levels were closely linked to reduced or impaired lysosomal function in monocytes (Chu et al., Reference Chu, Dodiya, Aebischer, Olanow and Kordower2009; Stefanis et al., Reference Stefanis, Emmanouilidou, Pantazopoulou, Kirik, Vekrellis and Tofaris2019). This may be due to reduced glucocerebrosidase activity in monocytes, which can lead to the failure of α-synuclein clearance and contribute to PD pathogenesis (Atashrazm et al., Reference Atashrazm, Hammond, Perera, Dobson-Stone, Mueller, Pickford, Kim, Kwok, Lewis, Halliday and Dzamko2018). Furthermore, we found that the correlation between these predictive genes and different immune subgroups was diverse, indicating that they may be involved in immune system regulation and possibly related to the onset and PD progression. The molecular mechanisms underlying these correlations warrant further investigation.
However, there are also some limitations in this study. First, the limited sample size in our model may lead to potential bias and limit the generalizability of our findings. Second, as a secondary analysis of previous data, our study is inherently limited by the quality and completeness of the original dataset. Moreover, there were the limited genetic subtypes covered by the dataset. Previous studies have indicated that LRRK2 mutation-related PD may differ from sporadic PD in pathological processes (such as α-synuclein deposition patterns) and drug responsiveness (Dulski et al., Reference Dulski, Uitti, Ross and Wszolek2022; Vinagre-Aragón et al., Reference Vinagre-Aragón, Campo-Caballero, Mondragón-Rezola, Pardina-Vilella, Hernandez Eguiazu, Gorostidi, Croitoru, Bergareche and Ruiz-Martinez2021). Nevertheless, our stratified analysis revealed that the seven-gene model is effective in both subtypes, which may be attributed to the involvement of these genes in common pathways across subtypes (such as endoplasmic reticulum stress and the ubiquitin-proteasome system). Future validation of the model’s generalization in larger, multi-subtype cohorts is needed.
Conclusion
In conclusion, we identify a seven-gene signature as a candidate biomarker signature for PD. We also highlight the involvement of IL6-JAK-STAT3 signaling, the inflammatory response, and the P53 pathway in PD pathogenesis. Furthermore, our study provides new insights into the role of natural killer T cells, Tregs, and activated B cells in the development and progression of PD. Our findings underscore the importance of further studies on the immune subpopulations in PD, which may lead to the identification of novel therapeutic targets.
Authors’ contributions
Wei C is the gurantor of the entire study. Xue R contributed to the study concept and study design. Wei C and Xu X defined the intellectual content. Wei C., Xue R, Gao Z. and Zhu H. acquired the data. Gao Z. and Zhu H. did the literature research and analyzed the data. Wei C prepared and edited the paper. Xue R, Gao Z and Xu X. reviewed the paper. All authors have read and approved the final paper.
Acknowledgments
This work has benefited from GEO. We thank the GEO network for its generous sharing of large amounts of data.
Data availability
The datasets presented in this study can be found in GEO repositories (accession number: GSE72267, GSE22491).
Funding
This study was supported by Huai’an Municipal Health Commission Project(No. HAWJZ2024004)
Conflicts of interest
All authors declare that they have no conflicts of interest in this work.
Ethics approval
Not applicable.
Informed consent
Not applicable.