Introduction
Older persons have a poorer prognosis of depression, with a more chronic course compared to younger adults (Spijker et al. Reference Spijker, de Graaf, Bijl, Beekman, Ormel and Nolen2002; Licht-Strunk et al. Reference Licht-Strunk, van der Windt, van Marwijk, de Haan and Beekman2007; Penninx et al. Reference Penninx, Nolen, Lamers, Zitman, Smit, Spinhoven, Cuijpers, de Jong, van Marwijk, van der Meer, Verhaak, Laurant, de Graaf, Hoogendijk, van der Wee, Ormel, van Dyck and Beekman2011; Comijs et al. Reference Comijs, Nieuwesteeg, Kok, van Marwijk, van der Mast, Naarding, Voshaar, Verhaak, de Waal and Stek2015). Nearly 50% of a group of older patients with a depressive disorder were still suffering from depression 2 years later and 61% showed a chronic course of the depressive symptoms during the 2-year period (Comijs et al. Reference Comijs, Nieuwesteeg, Kok, van Marwijk, van der Mast, Naarding, Voshaar, Verhaak, de Waal and Stek2015). Ageing-related physiological changes might contribute to these disappointing results, one of which might be metabolic dysregulation.
Depression is associated with the presence of the metabolic syndrome (MS) (Koponen et al. Reference Koponen, Jokelainen, Keinänen-Kiukaanniemi, Kumpusalo and Vanhala2008; Akbaraly et al. Reference Akbaraly, Kivimäki, Brunner, Chandola, Marmot, Singh-Manoux and Ferrie2009 ; Pan et al. Reference Pan, Keum, Okereke, Sun, Kivimaki, Rubin and Hu2012; Marijnissen et al. Reference Marijnissen, Smits, Schoevers, van den Brink, Holewijn, Franke, de Graaf and Oude Voshaar2013), although down-regulation of metabolic processes has also been reported (Giltay et al. Reference Giltay, van Reedt Dortland, Nissinen, Giampaoli, van Veen, Zitman, Bots and Kromhout2009; Marijnissen et al. Reference Marijnissen, Naudé, Comijs, Schoevers and Oude Voshaar2014; Vogelzangs et al. Reference Vogelzangs, Comijs, Oude Voshaar, Stek and Penninx2014a ).
Inconsistencies between studies have been explained by specific characteristics of the depressed population, as metabolic dysregulation is particularly associated with the somatic symptoms of depression (Capuron et al. Reference Capuron, Su, Miller, Bremner, Goldberg, Vogt, Maisano, Jones, Murrah and Vaccarino2008; Marijnissen et al. Reference Marijnissen, Smits, Schoevers, van den Brink, Holewijn, Franke, de Graaf and Oude Voshaar2013) as well as atypical depression (Levitan et al. Reference Levitan, Davis, Kaplan, Arenovich, Phillips and Ravindran2012; Lamers et al. Reference Lamers, Vogelzangs, Merikangas, de Jonge, Beekman and Penninx2013).
Current hypotheses about the pathophysiological mechanisms linking metabolic abnormalities to depression include abnormalities in brain-derived neurotrophic factor signalling (Zhou et al. Reference Zhou, Li, Bai, Chang, Li, Sun and Chen2013; Liu et al. Reference Liu, Carvalho and McIntyre2014), dysregulation of the hypothalamic pituitary adrenal axis (Van Reedt Dortland et al. Reference Van Reedt Dortland, Vreeburg, Giltay, Licht, Vogelzangs, van Veen, de Geus, Penninx and Zitman2013; Liu et al. Reference Liu, Carvalho and McIntyre2014), and inflammatory processes (Milaneschi et al. Reference Milaneschi, Simonsick, Vogelzangs, Strotmeyer, Yaffe, Harris, Tolea, Ferrucci and Panninx2012; Liu et al. Reference Liu, Carvalho and McIntyre2014). Recently adipose-derived hormones have gained more attention putting obesity as the central mechanism (Liu et al Reference Liu, Carvalho and McIntyre2014; Marijnissen et al. Reference Marijnissen, Naudé, Comijs, Schoevers and Oude Voshaar2014). Recently, grey-matter loss in the prefrontal cortex was found to be associated with both body mass index (BMI) and chronicity of depression (Opel et al. Reference Opel, Redlich, Grotegerd, Dohm, Heindel, Kugel, Arolt and Dannlowski2015).
Population-based studies have consistently demonstrated that metabolic dysregulation predicts the onset of clinically relevant depressive symptoms in both younger (Pan et al. Reference Pan, Keum, Okereke, Sun, Kivimaki, Rubin and Hu2012) and older persons (Koponen et al. Reference Koponen, Jokelainen, Keinänen-Kiukaanniemi, Kumpusalo and Vanhala2008; Mast et al. Reference Mast, Miles, Penninx, Yaffe, Rosano, Satterfield, Ayonayon, Harris and Simonsick2008; Akbaraly et al. Reference Akbaraly, Kivimäki, Brunner, Chandola, Marmot, Singh-Manoux and Ferrie2009; Vogelzangs et al. Reference Vogelzangs, Kritchevsky, Beekman, Brenes, Newman, Satterfield, Yaffe, Harris and Penninx2010, Reference Vogelzangs, Beekman, Boelhouwer, Bandinelli, Milaneschi, Ferrucci and Penninx2011; Do Nascimento et al. Reference Do Nascimento, Pereira, Firmo, Lima-Costa, Diniz and Castro-Costa2015). Whether metabolic dysregulation is also associated with a poor course of elevated depressive symptoms in the population is equivocal. An accumulating number of studies have demonstrated that metabolic dysregulation predicts chronicity of depressive symptoms in both younger (Kloiber et al. Reference Kloiber, Ising, Reppermund, Horstmann, Dose, Majer, Zihl, Pfister, Unschuld, Holsboer and Lucae2007; Viinamäki et al. Reference Viinamäki, Heiskanen, Lehto, Niskanen, Koivumaa-Honkanen, Tolmunen, Honkalampi, Saharinen, Haatainen and Hintikka2009; Rethorst et al. Reference Rethorst, Bernstein and Trivedi2014) and older persons (Vogelzangs et al Reference Vogelzangs, Kritchevsky, Beekman, Brenes, Newman, Satterfield, Yaffe, Harris and Penninx2010, Reference Vogelzangs, Beekman, Boelhouwer, Bandinelli, Milaneschi, Ferrucci and Penninx2011). Nonetheless, negative findings have also been reported, primarily in younger age samples (Hasler et al. Reference Hasler, Pine, Gamma, Milos, Ajdacic, Eich, Rossler and Angst2004; Needham et al. Reference Needham, Epel, Adler and Kiefe2010), but also one in a combined sample of middle-aged and older persons) (Remigio et al. Reference Remigio-Baker, Diez Roux, Szklo, Crum, Leoutsakos, Franco, Schreiner, Carnethon, Nettleton, Mujahid, Michos, Gary-Webb and Golden2014). Population-based studies are based on depression severity scales. Especially in the lower score range, these rating scales easily pick up somatic symptoms originating from somatic diseases (Thombs et al. Reference Thombs, Ziegelstein, Pilote, Dozois, Beck, Dobson, Fuss, de Jonge, Grace, Stewart, Ormel and Abbey2010). This may explain why population-based studies in older cohorts are less equivocal compared to younger age cohorts. More importantly, findings from these studies cannot simply be generalized to patients with a depressive disorder according to DSM-IV criteria.
Unfortunately, studies among clinical patients are scarce and limited to younger age groups (<65 years). Two studies showed that metabolic dysregulation is associated with a protracted course of unipolar depressive disorder (Vogelzangs et al. Reference Vogelzangs, Beekman, van Reedt Dortland, Schoevers, Giltay, de Jonge and Penninx2014b ; Opel et al. Reference Opel, Redlich, Grotegerd, Dohm, Heindel, Kugel, Arolt and Dannlowski2015), whereas one study did not (Sagud et al. Reference Sagud, Mihaljevic-Peles, Uzun, Cusa, Kozumplik, Kudlek-Mikulic, Mustapic, Barisic, Muck-Seler and Pivac2013). So to our knowledge, the impact of metabolic dysregulation on the course of depression has not yet been examined among a clinical sample of depressed older patients. This is important as in contrast to younger patients, components of metabolic dysregulation may convert from risk factors to protective factors with advancing age, e.g. low blood pressure appears to worsen cortical grey-matter integrity among older persons (Foster-Dingley et al. Reference Foster-Dingley, Moonen, van den Berg-Huijsmans, de Craan, de Ruijter, van der Grond and van der Mast2015). Previously, we found a positive association between obesity, both BMI and waist circumference, and depressive symptoms in middle-aged and older persons in the general population (Marijnissen et al. Reference Marijnissen, Bus, Holewijn, Franke, Purandare, de Graaf, den Heijer, Buitelaar and Oude Voshaar2011), while in a clinical study we found that depressed older patients are less obese compared to non-depressed controls (Marijnissen et al. Reference Marijnissen, Naudé, Comijs, Schoevers and Oude Voshaar2014).
Moreover, depression is a heterogeneous disorder with different symptom dimensions and different subtypes (Lamers et al. Reference Lamers, de Jonge, Nolen, Smit, Zitman, Beekman and Penninx2010; Hegeman et al. Reference Hegeman, Wardenaar, Comijs, de Waal, Kok and van der Mast2012). Neither population-based studies nor clinical studies did take specific depressive symptom profiles as well as other depressive subtypes into account when studying the impact of metabolic dysregulation on the course of depression. Based on cross-sectional studies, one may hypothesize that metabolic dysregulation specifically worsens the course of somatic-affective symptoms but not the course of the cognitive-affective symptoms of depression (Marijnissen et al. Reference Marijnissen, Smits, Schoevers, van den Brink, Holewijn, Franke, de Graaf and Oude Voshaar2013, Reference Marijnissen, Naudé, Comijs, Schoevers and Oude Voshaar2014) as well as the outcome of patients suffering from an atypical depression (Lamers et al. Reference Lamers, Vogelzangs, Merikangas, de Jonge, Beekman and Penninx2013; Vogelzangs et al. Reference Vogelzangs, Comijs, Oude Voshaar, Stek and Penninx2014a ).
The objective of the present study was to examine the prospective association between metabolic dysregulation, as indexed by MS and its individual components, and the course of late-life depression among clinically depressed older persons. We also assessed whether potential effect will be driven by the atypical phenotype of depression (Levitan et al. Reference Levitan, Davis, Kaplan, Arenovich, Phillips and Ravindran2012; Lamers et al. Reference Lamers, Vogelzangs, Merikangas, de Jonge, Beekman and Penninx2013) and/or the somatic depressive symptoms (Capuron et al. Reference Capuron, Su, Miller, Bremner, Goldberg, Vogt, Maisano, Jones, Murrah and Vaccarino2008; Marijnissen et al. Reference Marijnissen, Smits, Schoevers, van den Brink, Holewijn, Franke, de Graaf and Oude Voshaar2013).
Materials and method
Sample
The present study was performed with data collected for the Netherlands Study of Depression in Older persons (NESDO). NESDO is an ongoing cohort study, designed to examine the (determinants of the) course and consequences of depressive disorder in older persons. A detailed description of the study design can be found elsewhere (Comijs et al. Reference Comijs, van Marwijk, van der Mast, Naarding, Oude Voshaar, Beekman, Boshuisen, Dekker, Kok, de Waal, Penninx, Stek and Smit2011). The cohort consists of 378 depressed and 132 non-depressed comparison subjects aged 60–93, recruited between 2007 and 2010 from mental health institutions and general practitioners. Persons with a primary diagnosis of dementia, a Mini Mental State Examination (MMSE) score of <18 (out of 30 points) (Folstein et al. Reference Folstein, Folstein and McHugh1975), a primary psychotic or bipolar disorder or insufficient command of the Dutch language were excluded. The ethical review boards of the participating institutes approved this study. All participants gave informed consent after oral and written information about the study.
During the study, information was gathered about mental health outcomes, demographic characteristics and psychosocial, biological, cognitive and genetic determinants. Baseline assessments included written questionnaires, a face-to-face interview, medical examination, cognitive tests and collection of fasted blood samples in the morning. All interviews were performed by trained research assistants, and were audiotaped regularly to control for quality. At 2 years follow-up, going on from 2009 until 2012, all measures open to change were evaluated again. Furthermore, the course of depression was followed up by 6-monthly postal questionnaires (Rush et al. Reference Rush, Gullion, Basco, Jarrett and Trivedi1996). During the study, attrition and its reasons were recorded (Comijs et al. Reference Comijs, Nieuwesteeg, Kok, van Marwijk, van der Mast, Naarding, Voshaar, Verhaak, de Waal and Stek2015).
For the present study, we selected the depressed patient group to examine the course of depression. Of the 378 depressed patients at baseline, 285 patients participated in the 2-year follow-up visit.
Variables of interest
Depression
Diagnoses
At baseline and 2-year follow-up, the Composite International Diagnostic Interview (CIDI; WHO version 2.1) was used to assess diagnosis of depression and dysthymia, according to Diagnostic and Statistic Manual of Mental Disorders-IV-R (DSM-IV-R) criteria. The CIDI is a structured clinical interview with high validity for depressive and anxiety disorders and is designed for use in research settings (Wittchen et al. Reference Wittchen, Robins, Cottler, Sartorius, Burke and Regier1991; Kessler et al. Reference Kessler, Birnbaum, Bromet, Hwang, Sampson and Shahly2010). Additional questions were added to diagnose current minor depression according to DSM-IV research criteria (Comijs et al. Reference Comijs, van Marwijk, van der Mast, Naarding, Oude Voshaar, Beekman, Boshuisen, Dekker, Kok, de Waal, Penninx, Stek and Smit2011). The presence of a depression diagnosis was defined as major depressive disorder (MDD, n = 359) or dysthymia in the past 6 months (n = 100) or minor depression in the last month (n = 20). It should be noted that numbers do not add to 378 as some patients suffer from more than one depressive disorder. Past 6 months depression diagnoses at 2-year follow-up as assessed with the CIDI was considered the primary outcome (Comijs et al. Reference Comijs, Nieuwesteeg, Kok, van Marwijk, van der Mast, Naarding, Voshaar, Verhaak, de Waal and Stek2015). Of the 285 patients that were reassessed with the CIDI at 2-year follow-up, 270 suffered from MDD, 75 from dysthymia, and 17 from a minor disorder.
Severity and symptom profile
The severity of depressive symptoms was assessed every 6 months by means of a self-report questionnaire, the Inventory of Depressive Symptoms (IDS-SR; Rush et al. 1996). For 28 symptoms, severity and frequency were rated on a scale from 0 to 3, adding up to total scores ranging from 0 to 84; higher scores indicating more severe depression. Additional scores on mood (nine items, i.e. feeling sad, feeling irritable, feeling anxious or tense, reactivity of mood, quality of mood, interpersonal sensitivity, future pessimism, panic/phobic symptoms, suicidal thoughts), motivational (five items, i.e. self-criticism and blame, psychomotor retardation, sleeping too much, interest in people/activities, energy/fatigability) and somatic (eight items, i.e. aches and pain, sympathetic arousal, early morning awakening, interest in sex, initial insomnia, middle insomnia, appetite disturbance, weight disturbance) subscales were obtained, according to the three symptom dimensions identified for late-life depression assessment with the IDS-SR (Hegeman et al. Reference Hegeman, Wardenaar, Comijs, de Waal, Kok and van der Mast2012).
Subtypes
Atypical symptom profile (mood reactivity and ⩾2 of hyperphagia, hypersomnia, leaden paralysis, and interpersonal rejection sensitivity) was constructed by comparison of items of the IDS with DSM-IV criteria for atypical depression following Novick's algorithm (Novick et al. Reference Novick, Stewart, Wisniewski, Cook, Manev, Nierenberg, Rosenbaum, Shores-Wilson, Balascubramani, Biggs, Zisook and Rush2005). Similarly, melancholic symptom profile (lack of mood reactivity or loss of pleasure and ⩾3 of distinct mood quality, mood worse in morning, early morning awakening, psychomotor retardation or agitation, anorexia/weight loss, and guilt feelings) was constructed based on comparison of IDS items with DSM-IV criteria using the algorithm proposed by Khan (Reference Khan, Carrithers, Preskorn, Lear, Wisniewski, John Rush, Stegman, Kelley, Kreiner, Nierenberg and Fava2006). Depressed persons were categorized as either having ‘normal’ depression, depression with atypical features or depression with melancholic features.
Metabolic syndrome
MS was measured at baseline and defined according to the National Cholesterol Education Programme (NCEP) – Adult Treatment Panel III guidelines (Grundy et al. Reference Grundy, Brewer, Cleeman, Smith and Lenfant2004) as having ⩾3 of the following criteria: (1) abdominal obesity (waist circumference ⩾102 cm in men or ⩾88 cm in women); (2) hypertriglyceridaemia (⩾150 mg/dl); (3) low high-density lipoprotein (HDL) (<40 mg/dl in men and <50 mg/dl in women); (4) hypertension (systolic/diastolic blood pressure ⩾130/85 mmHg and/or on antihypertensive medication) and (5) impaired fasting glucose or diabetes (⩾110 mg/dl or taking insulin or hypoglycaemic medication).
Covariates
We considered three sets of confounders, i.e. (1) socio-demographic variables, (2) lifestyle characteristics, and (3) parameters of mental and physical functioning. The potential confounders were a priori chosen on their relationship with both depression and MS. All potential confounders were assessed at baseline and included in the main analyses as covariates (see statistics).
The first set comprised age, sex and years of education. The second set of confounders comprised lifestyle factors like smoking (yes/no), use of alcohol and physical activity. Alcohol use was assessed with the Alcohol Use Disorders Identification Test (AUDIT; Babor et al. Reference Babor, Kranzler and Lauerman1989); the sum score was used as an index for the severity of problematic alcohol use. Physical activity was measured with the last 7 days short-form (8 items) of the self-administered version of the International Physical Acitivities Questionaire (IPAQ; Craig et al. Reference Craig, Marshall, Sjöström, Bauman, Booth, Ainsworth, Pratt, Elelund, Yngve, Sallis and Oja2003) in Metabolic Equivalent of Task (MET) minutes per week (ratio of energy expenditure during activity compared to rest times the number of minutes performing the activity).
The third set of confounders comprised global cognitive functioning, severity of depression (IDS sum score), the number of chronic diseases and use of medication.
Cognitive functioning was assessed by the MMSE (Folstein et al. Reference Folstein, Folstein and McHugh1975). The number of chronic disease was assessed by means of a self- report questionnaire that has previously been used in The Longitudinal Ageing Study Amsterdam (Kriegsman et al. Reference Kriegsman, Penninx, van Eijk, Boeke and Deeg1996). The participants were asked whether they currently or previously had any of the following chronic diseases or disease events: cardiac disease (including myocardial infarction), peripheral atherosclerosis, stroke, diabetes mellitus, lung disease (asthma, chronic bronchitis or pulmonary emphysema), arthritis (rheumatoid arthritis or osteoarthritis), cancer, ulcer, intestinal problems, liver disease, epilepsy or thyroid gland disease. Compared to general practitioner information, the accuracy of self-reports of these diseases has been shown to be adequate and independent of cognitive impairment (Kriegsman et al. Reference Kriegsman, Penninx, van Eijk, Boeke and Deeg1996).
Antidepressant drugs were classified in three categories, i.e. selective serotonin reuptake inhibitors (SSRIs) (N06AB) (yes/no), tricyclic antidepressants (TCAs) (N06AA) (yes/no), and other antidepressants [serotonin-norepinephrine reuptake inhibitors (SNRI) (N06AX16, N06AX21), tetracyclic antidepressants (TeCAs) (N06AX03, N06AX05, N06AX11)] (yes/no). All antipsychotic drugs (N05A, except N05AN that code for lithium) were lumped together and coded as yes/no, as only a few patients used antipsychotics. Anti-inflammatory drugs (yes/no) included amino salicylic acid and similar agents (A07EC), anti-allergic agents (A07EB), systemically applied corticosteroids (H02A, H02B), as well as anti-inflammatory and anti-rheumatic products (M01). Since the use of antihypertensive drugs, insulin and hypoglycaemic drugs were already taken into account assessing MS; these drugs were not considered as potential confounders.
Statistical methods
Sample characteristics were compared between depressed patients with and without MS at baseline using χ2 tests for categorical variables and t test statistics for continuous variables.
Logistic regression analyses were conducted to test whether MS (yes/no), the number of criteria according to the NCEP and the individual components separately (dichotomous) at baseline predicted non-remission of depression diagnosis at 2-year follow-up, fully adjusted for all covariates described above. Subsequently, the logistic regression analyses were repeated stratified for the subtype of depression (atypical or melancholic).
Random coefficient analyses, a specific type of linear mixed models were performed to analyse the effect of MS, the number of individual components of MS and all individual components separately on the repeated measurements of the total IDS scores, as well as the mood, motivational and somatic subscales as outcome measures. With Linear Mixed Models (LMM) we are able to perform regression analyses with repeated-measures data (Blackwell et al. Reference Blackwell, Mendes de Leon and Miller2006). This method takes into account the dependency of the repeated observations obtained from the same individual over time. An advantage of LMM is that subjects are included regardless of missing values. Thus, subjects who were lost to follow-up were also included in the analyses. This reduces bias that might have arisen from a differential loss to follow-up. We compared models with random coefficients for intercept and/or slope per subject to determine the best fitting model, using the likelihood ratio test. The effect of MS on the linear development of the IDS score over the 2-year follow-up period was tested by the interaction between MS and time, controlling for baseline IDS score and the variables listed above in the covariates paragraph.
Since antidepressants might be associated with metabolic dysregulation, we post-hoc explored whether antidepressant drug use (yes/no, as well as the use of specific subtypes, i.e. no antidepressant, SSRI, TCA, or other antidepressant) interacted with MS (yes/no), number of components, or any of the individual components. These interactions were post-hoc explored in both the logistic regression analyses as well as the linear mixed models.
All analyses were conducted using SPSS v. 20.9 (IBM Corp., USA ); p values <0.05 were considered significant.
Results
Sample
From the 378 depressed patients at baseline, 285 patients [mean (s.d.) age 70.6 (7.5) years; 187 (65.6%) females] were still participating at 2-year follow-up. Reasons for dropout could be classified as follows: 26 persons died, 15 refused the interview, 47 were unable to participate any more (12 due to physical reasons, 35 due to mental reasons), and finally five were lost to follow-up. Neither the prevalence of MS differed between participants (119/285, 41.8%) and dropouts (44/93, 47.3%) (χ2 = 0.9, df = 1, p = 0.347), nor the mean (s.d.) depression symptom severity at baseline [IDS sum score: 29.7 (12.8) v. 31.5 (13.7); t = −1.16, df = 371, p = 0.245].
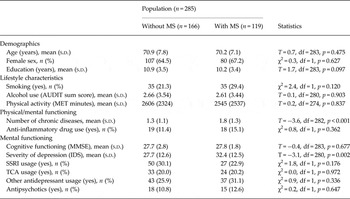
Table 1 presents all baseline characteristics for patients with and without MS. Depressed persons with MS had more chronic diseases and a higher depressive symptoms level compared with depressed persons without MS.
Characteristics of study population

MS, Metabolic syndrome; AUDIT, Alcohol Use Disorders Identification Test; MET, metabolic equivalent of task; MMSE, Mini Mental State Examination; IDS, Inventory of Depressive Symptomatology .
Course of depression
At 2-year follow-up, 138/285 (48.4%) still met DSM-IV-TR criteria for a depressive disorder. Non-remission at 2-year follow-up was significantly more frequent in the group of patients with MS compared to patients without [68/119 (57.1%) v. 70/166 (42.2%), χ2 = 6.2, df = 1, p = 0.013].
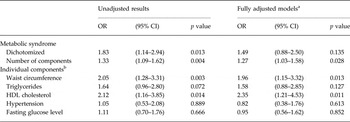
As shown in Table 2, logistic regression showed that after full adjustment for all covariates the number of components of MS (range 0–5) predicted non-remission of a depressive disorder after 2 years. Of the dichotomized components, only a high waist circumference and a low HDL cholesterol level significantly predicted non-remission.
Metabolic syndrome, the number of components and de individual components as predictor of non-remission at 2-year follow-up

OR, Odds ratio; CI, confidence interval; HDL, high-density lipoprotein; IDS, Inventory of Depressive Symptomatology.
a Logistic regression adjusted for age, sex, years of education, depression severity (IDS sum score), smoking, alcohol use, physical activity, somatic co-morbidity, global cognitive functioning and drug use (antidepressants, antipsychotics, anti-inflammatory drugs).
b Individual components are dichotomized according to the National Cholesterol Education Programme ATP-III criteria; each component is coded as 0 in case of normal values (e.g. adequate HDL levels or normal blood pressure) and coded 1 in case of deviant value (e.g. too low HDL levels or hypertension).
Of the 285 patients, a total of 19 met criteria for atypical depression, 30 for melancholic depression, six met criteria for both types of depression and five could not be classified due to a missing item on the IDS. The low numbers of patients meeting the criteria for a specific subtype, especially atypical depression, preclude re-analysis of results among patients suffering atypical depression (as a priori planned). Nonetheless, to be sure results are not driven by one of these subtypes, a sensitivity analyses was conducted on the 225 patients with ‘normal’ depression. The sensitivity analyses in the fully adjusted models revealed significant effects for MS, both dichotomized [odds ratio (OR) 2.05, 95% confidence interval (CI) 1.14–3.71, p = 0.017] and severity (OR 1.40,95% CI 1.10–1.80, p = 0.007). So the association between MS and depression was not driven by atypical depression. These effects were driven by waist circumference (OR 2.32, 95% CI 1.26–4.27, p = 0.0307) and HDL cholesterol (OR 2.49, 95% CI 1.20–5.16, p = 0.014).
Post-hoc we explored 28 interaction terms [seven MS variables, i.e. sum score, presence (yes/on), five individual components, and four antidepressant drug types, i.e. any antidepressant, TCA use, SSRI use, other antidepressant use]. Of these interaction terms, only one was significant (4%). This interaction showed that the impact of HDL cholesterol on non-remission was only found among those patients not using antidepressants (n = 79) and not among antidepressant drugs users (n = 190) independent of the type of antidepressant.
Course of depressive symptoms
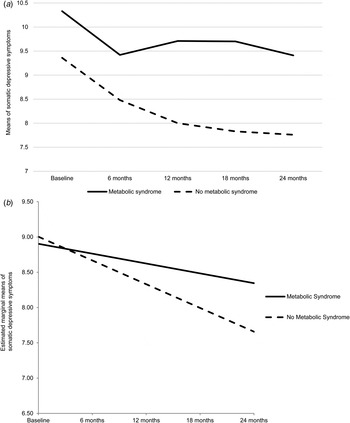
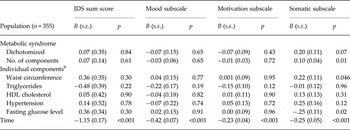
Random coefficient analysis including all depressed patients at baseline showed that neither MS nor the individual components predicted the course of depressive symptoms on any of the IDS scales, except the somatic symptom subscale. The MS, both dichotomized and severity based on the number of components, predicted less improvement of somatic symptom subscale of the IDS (B = 0.20, p = 0.07 and B = 0.10, p = 0.01, respectively) (Fig. 1). Of the individual components, higher waist circumference (B = 0.22, p = 0.046) and elevated fasting glucose level (B = 0.25, p = 0.02) independently predicted a poor course of somatic symptoms of depression over 2 years (Table 3).
(a) Differential development on somatic depressive symptoms between patients with and without metabolic syndrome (MS) (raw data). (b) Differential development on somatic depressive symptoms between patients with and without MS.* Patients without MS: baseline estimate is 9.00 [95% confidence interval (CI) 8.39–9.62] points, and the regression coefficient = −0.34 (95% CI −0.48 to −0.20). Patients with MS: baseline estimate is 8.90 (95% CI 8.26–9.55) points, and regression coefficient = −0.14 (95% CI −0.30 to 0.02). [*Adjusted for age, sex, years of education, depression severity (Inventory of Depressive Symptomatology sum score), smoking, alcohol use, physical activity, somatic co-morbidity, global cognitive functioning and drug use (antidepressants, antipsychotics, anti-inflammatory drugs).]

Random coefficient analysis of effect of metabolic syndrome on linear development of depressive symptoms and depressive symptoms subscales over 2-year follow-up period a

IDS, Inventory of Depressive Symptomatology; HDL, high-density lipoprotein.
a Adjusted for age, sex, years of education, depression severity (IDS sum score), smoking, alcohol use, physical activity, somatic co-morbidity, global cognitive functioning and drug use (antidepressants, antipsychotics, anti-inflammatory drugs).
b Individual components are dichotomised according to the National Cholesterol Education Programme ATP-III criteria; each component is coded as 0 in case of normal values (e.g. adequate HDL levels or normal blood pressure) and coded 1 in case of deviant value (e.g. too low HDL levels or hypertension).
We post-hoc tested 112 interaction terms (seven MS variables, four antidepressants categories, and four types of depressive symptoms, i.e. IDS total sum score, mood symptoms, somatic symptoms, motivational symptoms). Of these 112 interaction terms a total of eight (7%) were significant (p < 0.05). These data consistently showed that hypertension was associated with a worse course among all four IDS measures (total sum score, mood, motivation, somatic symptoms) among patients not using any antidepressant, while this effect was not found among those patients on antidepressants.
Discussion
Main findings
In a large sample of older patients with a diagnosis of depression according to DSM-IV criteria, metabolic dysregulation predicted non-remission of late-life depression at 2 years. Analyses with respect to the influence of MS on the course of depressive symptom revealed that this effect is restricted to a negative effect on the improvement of somatic depressive symptoms. In contrast to our hypothesis, the associations were not restricted to patients with atypical depression as found in adult patients (see Lamers et al. Reference Lamers, Vogelzangs, Merikangas, de Jonge, Beekman and Penninx2013). Due to low patient numbers of patients with atypical depression, data in this subgroup could not be interpreted. Furthermore, post-hoc analyses showed that these effects were not moderated by (type of) antidepressant drug use.
Metabolic dysregulation and course of late-life depression
Collectively, our findings support the concept of a metabolic depression originally based on population-based findings (Vogelzangs et al. Reference Vogelzangs, Beekman, Boelhouwer, Bandinelli, Milaneschi, Ferrucci and Penninx2011; Liu et al Reference Liu, Carvalho and McIntyre2014). Among older persons scoring above a cut-off on a self-report depression severity scale, the presence of MS predicted a protracted course of depression (Vogelzangs et al. Reference Vogelzangs, Beekman, Boelhouwer, Bandinelli, Milaneschi, Ferrucci and Penninx2011). Consistently found associations between metabolic dysfunction and depression-related neuropsychological deficits as well as their corresponding brain abnormalities further ground a ‘metabolic-mood syndrome’ (Mansur et al. Reference Mansur, Brietzke and McIntyre2015). In line with studies among adult patients suffering from MDD (Vogelzangs et al. Reference Vogelzangs, Beekman, van Reedt Dortland, Schoevers, Giltay, de Jonge and Penninx2014b ; Opel et al. Reference Opel, Redlich, Grotegerd, Dohm, Heindel, Kugel, Arolt and Dannlowski2015), our study contributes to the validation of the concept of metabolic depression along the lifespan, being the first including older patients suffering from a depressive disorder.
Previous research in the adult population found that specifically atypical depression (compared to melancholic depression) is associated with metabolic dysregulation (Lamers et al. Reference Lamers, Vogelzangs, Merikangas, de Jonge, Beekman and Penninx2013; Penninx et al. Reference Penninx, Milaneschi, Lamers and Vogelzangs2013; Takeuchi et al. Reference Takeuchi, Nakao, Kachi and Yano2013) and obesity (Sullivan et al. Reference Sullivan, Kessler and Kendler1998; Hasler et al Reference Hasler, Pine, Gamma, Milos, Ajdacic, Eich, Rossler and Angst2004; Lamers et al. Reference Lamers, de Jonge, Nolen, Smit, Zitman, Beekman and Penninx2010, Reference Lamers, Vogelzangs, Merikangas, de Jonge, Beekman and Penninx2013). In our study, however, the association was even strengthened when excluding patients suffering from atypical depression.
Further attempts to disentangle symptom specific effects of metabolic dysregulation showed that metabolic dysregulation only negatively affects the course of somatic depressive symptoms. The negative impact of MS on the somatic symptoms of depression is in line cross-sectional associations between MS and somatic-symptom cluster of depression specifically (Capuron et al. Reference Capuron, Su, Miller, Bremner, Goldberg, Vogt, Maisano, Jones, Murrah and Vaccarino2008; Marijnissen et al. Reference Marijnissen, Smits, Schoevers, van den Brink, Holewijn, Franke, de Graaf and Oude Voshaar2013). Collectively, these findings might point to a specific subtype of late-life depression, with specific underlying aetiological pathways.
Metabolic components driving the impact on depression outcome and course
A higher waist circumference was significantly associated with non-remission as well as a protracted course of the somatic depressive symptoms. The impact of the other components was less clear. Only a low HDL cholesterol level predicted non-remission and only hyperglycaemia a protracted course of somatic depressive symptoms. This contrasts with findings in an older population-based sample showed that all components of MS contributed to the persistence of elevated depressive symptom scores (Vogelzangs et al. Reference Vogelzangs, Beekman, Boelhouwer, Bandinelli, Milaneschi, Ferrucci and Penninx2011).
Previously, we showed that the association between waist circumference and depressive symptoms in population cannot be generalized to a clinical sample of depressed older patients (Marijnissen et al. Reference Marijnissen, Naudé, Comijs, Schoevers and Oude Voshaar2014). In NESDO, depressed patients had a lower waist circumference compared to their non-depressed counterparts, while within the depressed group a higher waist circumference was still associated with a higher depression severity (Marijnissen et al. Reference Marijnissen, Naudé, Comijs, Schoevers and Oude Voshaar2014; Vogelzangs et al. Reference Vogelzangs, Comijs, Oude Voshaar, Stek and Penninx2014a ). This might be explained by the fact that depressed older persons have more often lost weight due to co-morbid physical frailty, which in itself is associated with depression (Andrew & Rockwood, Reference Andrew and Rockwood2007; Collard et al. Reference Collard, Comijs, Naarding and Oude Voshaar2014). Among community-dwelling older people sarcopenic obesity, a co-occurrence of low muscle strength and excess body fat, was associated with new onset of depressive symptoms (Hamer et al. Reference Hamer, Bay and Kivimaki2015).
In addition to abdominal obesity, lipid dysregulation is another important component of MS in relation to depression. Previous studies showed that both lower HDL cholesterol levels as well as elevated triglyceride levels predict non-remission of depression among depressed adults (Vogelzangs et al. Reference Vogelzangs, Beekman, van Reedt Dortland, Schoevers, Giltay, de Jonge and Penninx2014b ) as well as incident depression in the population (Pan et al. Reference Pan, Keum, Okereke, Sun, Kivimaki, Rubin and Hu2012). In our study among depressed older patients, low HDL cholesterol levels indeed predicted non-remission, although the impact of high triglyceride levels did not achieve statistical significance.
Hyperglycaemia did not independently predict non-remission at 2 years, but significantly affected the somatic depressive symptom course. This latter finding is in line with findings in adult samples (Vogelzangs et al. Reference Vogelzangs, Beekman, van Reedt Dortland, Schoevers, Giltay, de Jonge and Penninx2014b ).
Among all components of MS, hypertension seems to act most differently. Our study as well as previous studies among adult samples or population-based samples did not find any impact of hypertension on the course of depression (Pan et al. Reference Pan, Keum, Okereke, Sun, Kivimaki, Rubin and Hu2012; Vogelzangs et al. Reference Vogelzangs, Beekman, van Reedt Dortland, Schoevers, Giltay, de Jonge and Penninx2014b ). Moreover, depression might be more closely related to low blood pressure, as some findings suggest depression and low blood pressure may have a common underlying factor (Licht et al. Reference Licht, de Geus, Seldenrijk, van Hout, Zitman, van Dyck and Penninx2009).
Different mechanisms have been hypothesized to explain the link between MS and depression. Collectively, however, our findings converge around a central role for abdominal obesity. Interestingly, visceral fat is metabolically active resulting in a pro-inflammatory state (Wensveen et al. Reference Wensveen, Valentic, Sestan, Turk Wensveen and Polic2015). The impact of MS might therefore be explained by low-graded inflammatory process. Previously, we found increased Lipocalin-2 levels, an inflammatory marker associated with depression, specifically in depressed patients with abdominal obesity (Marijnissen et al. Reference Marijnissen, Naudé, Comijs, Schoevers and Oude Voshaar2014).
Methodological considerations
Being the first and largest study prospectively examining the association between metabolic dysregulations and late-life depression, some limitations should be acknowledged. First, due to the age of our sample, the dropout is relatively high (93/378, 24.6%). Nonetheless, dropouts neither differed with respect to the presence of MS nor with respect to depression severity. Moreover, linear mixed models take dropouts into account. Second, analyses on the phenomenological subtypes of depression could not be performed due to low patient numbers meeting these specific criteria. This contrasts with studies in depressed adult patients in which a quarter of the patients suffer from atypical depression in clinical practice (Lamers et al. Reference Lamers, Vogelzangs, Merikangas, de Jonge, Beekman and Penninx2013). Third, although formal depression diagnostics is an improvement compared to most other studies in this field that rely on single assessments with self-report depression scales, we had not measures of cumulative depressive illness. MS and depression may be reciprocally related, which implies that results may be confounded by the cumulative depressive illness duration as well as the cumulative duration of metabolic dysregulation. Finally, mediating mechanisms that might explain the associations found, like low-graded inflammation, hypothalamus-pituitary-adrenal axis functioning or neurotropic support have not been addressed directly in the present paper.
Final implications
Late-life depression has a chronic course, arguing for developing better treatment strategies. Our findings support the concept of ‘metabolic depression’, with a further validation among clinically depressed older patients. This is especially important as metabolic dysregulation increases with age. Furthermore, a higher BMI contributes to a poorer response to antidepressant medication (Papakostas et al. Reference Papakostas, Petersen, Iosifescu, Burns, Nierenberg, Alpert, Rosenbaum and Fava2005) as well as a more severe chronic course of depression in adults (Opel et al. Reference Opel, Redlich, Grotegerd, Dohm, Heindel, Kugel, Arolt and Dannlowski2015) although results are mixed (Vogelzangs et al. Reference Vogelzangs, Beekman, van Reedt Dortland, Schoevers, Giltay, de Jonge and Penninx2014b ).
Targeting metabolic health might be a pathway of improving outcome in at least a subgroup of patients. Some studies indeed suggest that such interventions may be effective. Treatment of obesity itself, including biatric surgery, leads to a decrease in depression (Stunkard et al. Reference Stunkard, Faith and Allison2003; Deliopoulou et al. Reference Deliopoulou, Konsta, Penna, Papakostas and Kotzampassi2013; Mitchell et al. Reference Mitchell, King, Chen, Devlin, Flum, Garcia, Inabet, Pender, Kalarchian, Khandelwal, Marcus, Schrope, Strain, Wolfe and Yanovski2014). Furthermore, a physical exercise programme enhancing muscle and skeletal strengths, normalizes metabolic dysregulation (You & Nicklas, Reference You and Nicklas2008) and improves depressive symptoms (Mather et al. Reference Mather, Rodriguez, Guthrie, McHarg, Reid and McMurdo2002; Mead et al. Reference Mead, Morley, Campbell, Greig, McMurdo and Lawlor2009; Rethorst et al. Reference Rethorst, Wipfli and Landers2009; Garcia-Toro et al. Reference Garcia-Toro, Gili, Ibarra, Monzon, Vives and Garcia-Campayo2014). Nonetheless, more and much larger randomized controlled trials are needed to investigate whether treatment programmes with a focus on improving metabolic regulation could improve the prognosis of depression in older persons.
Acknowledgements
The infrastructure for NESDO is funded through the Fonds NutsOhra, Stichting tot Steun VCVGZ, NARSAD The Brain and Behaviour Research Fund, and the participating universities and mental healthcare organizations (VU University Medical Center, Leiden University Medical Center, University Medical Center Groningen, Radboud University Nijmegen Medical Center, and GGZ inGeest, GGNet, GGZ Nijmegen, GGZ Rivierduinen, Lentis, and Parnassia). R. C. Oude Voshaar is research fellow of the Dutch Scientific Organisaton (ZonMW) (research grant 90700231).
The authors maintained full independence in the conduct of this work. The sponsors had no role in design, methods, subject recruitment, data collections, analysis or preparation of the manuscript.
Declaration of Interest
None.