Stroke is a critical global public health issue, especially in China and UK, where the burden is particularly high. Although age-standardised incidence rates declined from approximately 227 to 205 per 100 000 between 1990 and 2021, population ageing has led to an increasing absolute burden(Reference Li, Jin and Bai1). In 2020, the weighted prevalence reached 2·6 %, with an annual incidence of 505·2 per 100 000 – four times higher than the global average(Reference Tu, Zhao and Yin2). As a leading cause of disability and mortality worldwide(Reference Li, Kong and Yang3), stroke imposes a significant economic burden on healthcare systems and societies. For example, the societal cost of stroke is estimated at £26 billion annually in the UK, while Chinese patients aged ≥65 require an average of 1154·4 h of informal care per year(Reference Wang, Cui and Ji4,Reference Joo and Liang5) .
DAO – defined as the confluence of dynapenia, indicated by low grip strength, and abdominal obesity – emerges as an important risk paradigm for stroke. Grip strength is a key indicator of dynapenia and a strong predictor of health outcomes, with studies showing that each 5 kg decrease associates with a 9 % elevated stroke risk(Reference Leong, Teo and Rangarajan6). Similarly, waist circumference, as a measure of abdominal obesity(Reference Ross, Neeland and Yamashita7), demonstrates that each 10-cm increment is associated with a 12 % elevation in stroke incidence(Reference Zhong, Zhong and Xu8). Previous studies have demonstrated that these two indicators independently confer higher risks of cardiovascular and cerebrovascular diseases in Chinese or Asians(Reference Sun, Kovacs and Guiu-Jurado9,Reference Ji, Zhao and Xiao10) .Their coexistence amplifies cardiovascular risk by 197 % v. isolated components(Reference Wang, Jiang and Hu11), potentially through synergistic mechanisms: chronic inflammation, insulin resistance and endothelial dysfunction(Reference Leong, Teo and Rangarajan6,Reference Ouchi, Parker and Lugus12,Reference Kwaifa, Bahari and Yong13) . Moreover, the Chinese population, which is currently undergoing rapid urban–rural transition, may exhibit ethnic differences and unique characteristics in these underlying mechanisms(Reference Tiuganji, Nehme and Marqueze14–Reference Knowles, Pagan and Beausejour16). More recently, a small yet expanding body of literature indicates that DAO constitutes an independent predictor for multiple health outcomes, such as heart disease, cognitive impairment and mortality(Reference Oba, Tamura and Ishikawa17–Reference Lin, Xue and Huang19). However, several critical knowledge gaps persist regarding the combined phenotype of dynapenic abdominal obesity (DAO) and stroke risk. First, prospective investigations specifically examining DAO as a composite exposure in relation to incident stroke events – rather than broader cardiovascular endpoints – remain scarce in the literature. Second, research within populations experiencing rapid demographic and lifestyle transitions, such as contemporary Chinese cohorts, has been insufficient to characterise population-specific risk patterns. Third, cross-population validation studies are notably absent, limiting generalisability of findings across diverse ethnic and socio-economic contexts. Fourth, potential effect modifications by key demographic factors including sex and urbanisation status have received inadequate attention in existing research frameworks. Therefore, the present investigation employed prospective cohort analyses utilising data from the China Health and Retirement Longitudinal Study (CHARLS) and the English Longitudinal Study of Ageing (ELSA) to systematically address these knowledge gaps through comprehensive stroke risk assessment in two demographically distinct populations.
Methods
Study design and participants
In this investigation, we utilised data from two ongoing, nationally representative cohort studies: the CHARLS and the ELSA. CHARLS represents a nationwide prospective cohort study of Chinese adults aged 45 years and older, with particular emphasis on social, economic and health determinants. The sampling methodology employed a multi-stage stratified probability-proportional-to-size framework to ensure adequate population representation. This process involved selecting 150 county-level administrative units across twenty-eight provinces, followed by the identification of three rural villages and urban communities within each county unit, yielding a total of 450 villages/urban communities throughout China(Reference Zhao, Hu and Smith20). ELSA constitutes a comparable nationally representative prospective cohort study focused on older residents in England, with research objectives similar to those of CHARLS. Comprehensive descriptions of both cohort studies have been documented in previous publications(Reference Zhao, Hu and Smith20,Reference Steptoe, Breeze and Banks21) . All procedures strictly adhered to STROBE Statement requirements for transparent sampling methodology (Item 6)(Reference Skrivankova, Richmond and Woolf22). The utilisation of CHARLS and ELSA datasets was approved by the Ethics Committee of Peking University (IRB00001052-11015) and the London Multicenter Research Ethics Committee (MREC/01/2/91), respectively. Written informed consent was obtained from all study participants. Access to these datasets is subject to protection and restrictions as stipulated in the associated data usage agreements.
For the present analysis, CHARLS data were employed as the exploratory dataset while ELSA served as the validation dataset. To maintain methodological consistency, we analysed waves 1 through 4 from CHARLS (baseline 2011: n 25 586; follow-ups 2013/2015/2018) and waves 6 through 9 from ELSA (baseline 2012 with n 19 802; follow-ups in 2015, 2017 and 2019). After excluding 15 433 participants (missing anthropometrics, prior stroke and age <45), 10 153 were included from CHARLS. Similarly, following the exclusion of 14,381participants due to missing anthropometric measurements, documented history of stroke or age below 45 years, the final validation sample consisted of 5421 individuals from ELSA (Figure 1).
Flow chart of analytic samples.

Figure 1. Long description
A table presenting the hazard ratios (HR) and 95% confidence intervals (CI) for the association between obesity phenotypes (ND/AO, D/NAO, D/AO) and incident stroke risk in the CHARLS cohort using Cox proportional hazards regression, with three adjusted models. Model 1 was unadjusted; Model 2 adjusted for age and sex; Model 3 further adjusted for BMI, education level, smoking status, drinking status, and number of chronic conditions. The results are consistent with the primary logistic regression analysis, with D/AO showing a significant association with stroke risk in the fully adjusted model (HR=1.77, 95% CI: 1.25-2.50, p=0.001).
Measures
Assessment of dynapenic abdominal obesity
Grip strength measurement
Grip strength was measured using Yuejian™ WL-1000 dynamometers, which demonstrated excellent equivalence with Jamar devices in CHARLS validation studies (ICC = 0·94, 95 %CI 0·91–0·96; Bland–Altman mean difference −0·23 kg). The measurement process strictly followed the standard operating manual of CHARLS, conducted by trained staff at baseline. All measurements were completed by standardised-trained investigators to ensure accuracy and reliability. To control for measurement errors, calibration of the measuring equipment was performed regularly, and quality control training for investigators was conducted. During measurement, participants were seated with their upper arms relaxed and elbows flexed at 90 degrees. Participants were instructed to squeeze the dynamometer with maximum strength until the needle stopped rising. Grip strength was measured for both hands twice with a 30-second interval to eliminate fatigue effects, and the maximum value from the two measurements was used for analysis(Reference Zhao, Hu and Smith20).
Dynapenia definition: population-specific standards
Dynapenia was operationalised using handgrip strength because this measure is widely available in both CHARLS and ELSA and has been recommended as a simple indicator of muscle strength in ageing studies. However, handgrip strength primarily reflects upper-limb strength and may not fully capture lower-limb strength, muscle power, balance, gait performance or broader neuromuscular function. This is a point we want to clarify precisely here.
According to the 2019 standards from the Asian Working Group for Sarcopenia, muscle weakness was defined as grip strength <28 kg for men and <18 kg for women(Reference Chen, Woo and Assantachai23) in CHARLS, while following the recommendations of the Foundation for the National Institutes of Health Biomarkers Consortium Sarcopenia Project, the thresholds were set at less than 26 kg for men and less than 16 kg for women in ELSA(Reference Alley, Shardell and Peters24).
Waist circumference measurement and abdominal obesity definition
Following WHO-STEPS surveillance standards, waist circumference (WC; unit: cm) was measured as a practical indicator of abdominal obesity, with measurements taken at the midpoint between the lower rib and the iliac crest, while participants were standing and at the end of exhalation, ensuring the measuring tape was level and not compressing the skin(Reference Dietz and Gallagher25). WC was used as a pragmatic anthropometric measure for abdominal obesity. Although it does not directly quantify visceral adipose tissue, WC is a validated and reproducible indicator of central adiposity that is associated with cardiometabolic risk. In epidemiological research where imaging-based assessment is unavailable, waist circumference remains a standard approach for characterising abdominal obesity(Reference Ross, Neeland and Yamashita7). Abdominal obesity was determined based on WC ≥90 cm for men and ≥85 cm for women in CHARLS(Reference Lu, Wang and Li26), while in ELSA, it was defined as WC > 102 cm for men and >88 cm for women(Reference Alley, Shardell and Peters24).
Dynapenic abdominal obesity phenotype definition: functional dynapenia plus central adiposity
Because direct measures of skeletal muscle mass, such as dual-energy X-ray absorptiometry, bioelectrical impedance analysis or imaging-based muscle area, were unavailable in both datasets, DAO in this study was defined by the coexistence of low handgrip strength and abdominal obesity(Reference Ramírez, de Oliveira and de Oliveira Máximo27). Therefore, our exposure definition captures a functional dynapenic phenotype rather than sarcopenia or sarcopenic obesity. This DAO phenotype has been demonstrated associated with adverse outcomes including CVD, cognitive impairment(Reference Oba, Tamura and Ishikawa17–Reference Lin, Xue and Huang19). Based on these standards, combined with grip strength values and WC data, participants were categorised into four groups: no dynapenia and no abdominal obesity (ND/NAO), pure abdominal obesity (ND/AO), pure dynapenia (D/NAO) and dynapenia combined with abdominal obesity (D/AO).
Stroke assessment
Stroke was ascertained based on participant or proxy report of physician diagnosis without independent medical record validation. In CHARLS, stroke status was assessed using standardised questionnaires administered during face-to-face interviews, while ELSA employed a standardised disease inventory card. Both cohorts used identical assessment protocols at baseline and all follow-up waves.
Covariates
Consistent with previous research(Reference Sun, Wang and Wang28), covariates were categorised based on the comparability between the CHARLS and ELSA datasets. The covariates in this study included: (1) demographic characteristics: age, sex, education level (primary school or below/high school and above) and annual income; (2) lifestyle factors: smoking status (never smoked/smoking) and drinking status (never drank/drank but less than once a month/drank more than once a month); (3) health status: BMI (kg/m2) and the number of chronic diseases (about fourteen chronic diseases including hypertension, diabetes, heart disease, cancer or malignant tumors) (none/have one/have two or more).
Statistical analysis and missing data handling
Descriptive statistics were used to analyse the characteristics of the study population. Continuous variables were expressed as mean ± standard deviation, while categorical variables were presented as frequency and percentage. The Kolmogorov–Smirnov test was used to assess the normality of continuous variables. Independent samples t-test was conducted for comparison of continuous variables (age, BMI and annual household expenditure) between sex, while Pearson χ 2 test was used for categorical variables (residence, marital status, education level, smoking status, drinking status, number of chronic diseases, stroke status and grouping distribution).
Logistic regression models were utilised to evaluate the association between DAO and incident stroke, with the ND/NAO group as the reference group, calculating OR and 95 % CI. Three progressive adjustment models were constructed: model 1 was adjusted for age, sex; model 2 further adjusted for BMI, education level, smoking status, drinking status and number of chronic diseases.
Stratified analyses were performed to explore potential effect modifiers by sex, age (middle-aged group (45–60 years) and elderly group (≥60 years) and residence (urban/rural).
Primary analyses employed complete case analysis, including only participants with complete data on the DAO phenotype, stroke outcome and all covariates. To evaluate the robustness of our primary findings, sensitivity analyses were conducted using multiple imputation to handle missing values in covariates. Missing data in the primary exposure (DAO) and outcome (stroke) were not imputed. The same logistic regression models and stratified analyses were applied to each imputed datasets. Additionally, Cox proportional hazards regression was performed as a supplementary analysis to account for time-to-event dynamics, using identical covariate specifications as the primary models.
Results
Baseline characteristics
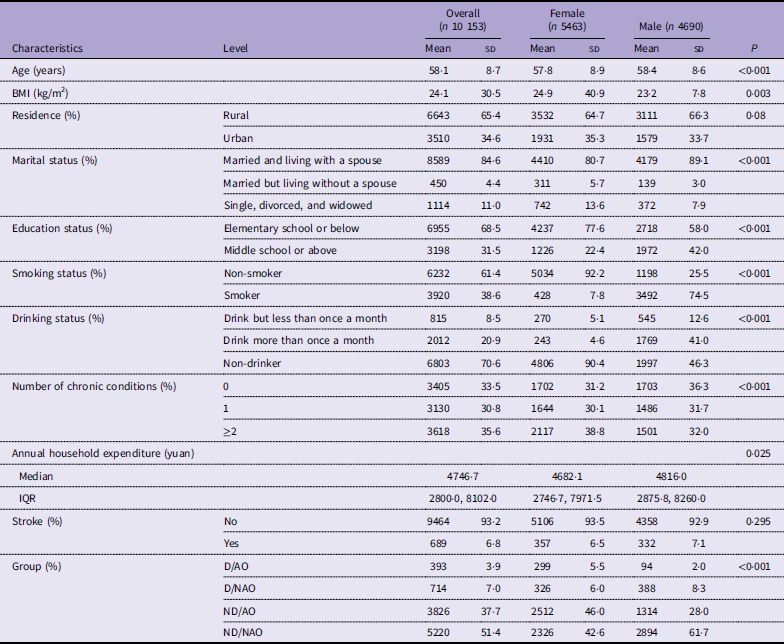
The baseline characteristics of the study populations from CHARLS and ELSA are shown in Table 1 and Supplementary Table S1, respectively. Two longitudinal cohorts provided data with 7-year follow-up periods: CHARLS (n 10 153) and ELSA (n 5421). ELSA participants were older (65·7 (sd 8·3) v. 58·1 (sd 8·7) years, P < 0·001) with higher BMI (28·3 (sd 5·1) v. 24·1 (sd 30·5) kg/m2). Female predominance characterised CHARLS (53·8 %) while males comprised the majority in ELSA (56·1 %). The four-category classification yielded distinct distributions: CHARLS showed predominant ND/NAO (51·4 %) and ND/AO (37·7 %) status, with dynapenia minorities of D/NAO (7·0 %) and D/AO (3·9 %). ELSA demonstrated balanced ND/AO (47·1 %) and ND/NAO (42·6 %) distributions, with D/AO (6·0 %) and D/NAO (4·3 %) representing higher dynapenia prevalence. D/AO prevalence was 1·54-fold higher in ELSA v. CHARLS, potentially reflecting population-specific metabolic-cardiovascular risk clustering. Socio-demographic patterns revealed educational disparities: CHARLS participants showed lower completion rates (31·5 % middle school or above) with male advantages (42·0 % v. 22·4 %, P < 0·001), while ELSA achieved higher overall educational attainment (48·1 %). Behavioural risk factors exhibited paradoxical patterns, with D/AO individuals demonstrating reduced smoking and drinking across both cohorts despite higher metabolic burden. Baseline stroke prevalence differed substantially, with CHARLS demonstrating 2·5-fold higher rates (6·8 % v. 2·7 %, P < 0·01). Chronic disease clustering showed CHARLS participants bearing elevated multimorbidity (35·6 % with ≥2 conditions), establishing differential baseline cardiovascular risk profiles for subsequent incident stroke analysis.
Baseline characteristics of study participants by sex in CHARLS (n 10 153)

Table 1. Long description
A table presenting the baseline characteristics of 10,153 participants from the China Health and Retirement Longitudinal Study (CHARLS), stratified by sex (female: n=5,463; male: n=4,690). The table includes demographic characteristics (age, BMI, residence, marital status, education), lifestyle factors (smoking, drinking), number of chronic conditions, annual household expenditure, baseline stroke status, and distribution of the four obesity phenotype groups (ND/NAO, ND/AO, D/NAO, D/AO). P-values for sex differences are provided for each characteristic.
D/AO, dynapenia with abdominal obesity; D/NAO, dynapenia without abdominal obesity; ND/AO, no dynapenia with abdominal obesity; ND/NAO, neither dynapenia nor abdominal obesity.
Associations of dynapenic abdominal obesity phenotypes with incident stroke
Participants across the ND/AO, D/NAO and D/AO categories exhibited distinct risk profiles for stroke development relative to the ND/NAO reference group in both study populations (Tables 2 and 3). Within the CHARLS dataset, the D/AO phenotype demonstrated the most pronounced association with stroke incidence (adjusted OR: 1·96, 95 % CI: 1·37–2·76, P < 0·001), succeeded by ND/AO (adjusted OR: 1·57, 95 % CI: 1·31–1·88, P < 0·001), whereas D/NAO failed to maintain statistical significance following comprehensive covariate adjustment (adjusted OR: 1·16, 95 % CI: 0·83–1·59, P = 0·377). Analysis of the ELSA population confirmed D/AO as the phenotype associated with the highest risk burden (adjusted OR: 2·38, 95 % CI: 1·11–5·10, P = 0·025), corresponding to a 138 % elevation in relative risk, while neither ND/AO (adjusted OR: 1·38, 95 % CI: 0·83–2·31, P = 0·22) nor D/NAO (adjusted OR: 0·86, 95 % CI: 0·30–2·46, P = 0·78) achieved statistical significance. Dose–response evaluation demonstrated a robust linear relationship within CHARLS (adjusted OR: 1·28, 95 % CI: 1·16–1·42, P < 0·001) and approached significance in ELSA (adjusted OR: 1·24, 95 % CI: 0·98–1·57, P = 0·074), with the D/AO group maintaining the strongest association with Incident stroke occurrence across both cohorts. The results of the trend test reveal a significant positive relationship between DAO and stroke risk across various models, aligning with the findings from the main analysis, irrespective of whether in the CHARLS or ELSA cohorts.
Associations of different obesity phenotypes including DAO with incident stroke risk in CHARLS

Table 2. Long description
A table showing the odds ratios (OR) and 95% confidence intervals (CI) for the association between obesity phenotypes (ND/AO, D/NAO, D/AO) and incident stroke risk in the CHARLS cohort, with two adjusted models. Model 1 adjusted for age and sex; Model 2 further adjusted for BMI, education level, smoking status, drinking status, and number of chronic conditions. The table shows that D/AO was significantly associated with higher stroke risk in both models (fully adjusted OR=1.96, 95% CI: 1.37-2.76, p<0.001), with a significant dose-response trend.
Model 1: Adjusted for age and sex.
CHARLS China Health and Retirement Longitudinal Study, D/AO dynapenia with abdominal obesity, D/NAO dynapenia without abdominal obesity, ND/AO no dynapenia with abdominal obesity.
Associations of different obesity phenotypes including DAO with incident stroke risk in ELSA

Table 3. Long description
A table presenting the odds ratios (OR) and 95% confidence intervals (CI) for the association between obesity phenotypes (ND/AO, D/NAO, D/AO) and incident stroke risk in the English Longitudinal Study of Ageing (ELSA) cohort, with two adjusted models. Model 1 adjusted for age and sex; Model 2 further adjusted for BMI, education level, smoking status, drinking status, and number of chronic conditions. The table shows that only D/AO was significantly associated with higher stroke risk in the fully adjusted model (OR=2.38, 95% CI: 1.11-5.10, p=0.025).
Model 1: Adjusted for age and sex.
Model 2: Adjusted for age, sex, BMI, education level, smoking status, drinking status, education level and number of chronic conditions.
ELSA, English Longitudinal Study of Aging, D/AO dynapenia with abdominal obesity, D/NAO dynapenia without abdominal obesity, ND/AO no dynapenia with abdominal obesity.
Stratified analysis
Overall association pattern
Overall, the association between DAO and stroke risk was consistent across sex, age and residence, with urban middle-aged men showing the highest risk. To investigate whether the impact of different obesity types on the risk of incident stroke differs among subpopulations, we conducted stratified analyses based on population characteristics.
Sex-stratified associations
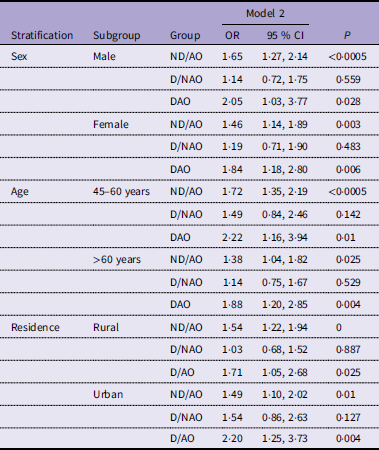
Table 4 shows the associations post stratification by sex. Among the ND/AO group, both men and women exhibited sustained significant associations. After adjusting for confounders, the risk increase was more pronounced in men (OR = 1·65, 95 % CI: 1·27–2·14, P < 0·001) compared with women (OR = 1·46, 95 % CI: 1·14–1·89, P = 0·003). Importantly, the D/AO group exhibited the strongest association intensity in both sexes. After full adjustment, the risk for men increased by about one-fold (OR = 2·05, 95 % CI: 1·03–3·77, P = 0·028), and for women, the risk increased by 84 % (OR = 1·84, 95 % CI: 1·18–2·80, P = 0·006).
Stratified analysis of association between DAO and incident stroke

Table 4. Long description
A table showing the stratified analysis of the association between dynapenic abdominal obesity (DAO) and incident stroke, stratified by sex (male/female), age (45-60 years/>60 years), and residence (rural/urban). The table presents fully adjusted odds ratios (OR) and 95% confidence intervals (CI) for each subgroup, with adjustment for all covariates except the stratifying factor. The results show that DAO was associated with higher stroke risk in all subgroups, with the strongest association observed in urban middle-aged men, though no significant interaction was found for any stratifying factor.
Stratified analyses were performed separately by sex, age and residence.
For each stratum, the regression model was adjusted for all covariates except the corresponding stratifying factor (sex, age or residence): BMI, education level, smoking status, drinking status and number of chronic conditions.
D/AO dynapenia with abdominal obesity, D/NAO dynapenia.
Without abdominal obesity, ND/AO no dynapenia with abdominal obesity.
Age-stratified associations
The age-stratified analysis shown in Table 4 indicates that the association between the DAO phenotype and stroke risk varied across different age groups. Among the ND/AO group, after full adjustment, younger adults (45–60 years) displayed a stronger association (OR = 1·72, 95 % CI: 1·35–2·19, P < 0·001) compared with older adults (>60 years), whose association was relatively weaker (OR = 1·38, 95 % CI: 1·04–1·82, P = 0·025). For the D/NAO group, neither age group exhibited significant associations after controlling for confounders. The D/AO group showed the strongest associations in both age groups, notably more pronounced in the younger adults. Following adjustment for potential confounders, the risk increased by 122 % in the younger group (OR = 2·22, 95 % CI: 1·16–3·94, P = 0·01) and by 88 % in the older group (OR = 1·88, 95 % CI: 1·20–2·85, P = 0·004).
Residence-stratified associations
Table 4 suggests that the association between DAO phenotype and stroke risk varies by residence. In the ND/AO group, both rural (OR = 1·54, 95 % CI: 1·22–1·94, P < 0·001) and urban (OR = 1·49, 95 % CI: 1·10–2·02, P = 0·01) areas showed a similar level of significant association after full adjustment. The D/NAO group displayed interesting changes after adjustment for confounders; the urban area transitioned from an initial significant association (OR = 1·84, 95 % CI: 1·05–3·08, P = 0·025) to non-significance (OR = 1·54, 95 % CI: 0·86–2·63, P = 0·127), while the rural area remained non-significant (adjusted OR = 1·03, 95 % CI: 0·68–1·52, P = 0·887). Notably, the D/AO group exhibited the strongest association intensity in both areas, with urban areas exhibiting a greater association (OR = 2·20, 95 % CI: 1·25–3·73, P = 0·004), compared with a weaker association in rural areas (OR = 1·71, 95 % CI: 1·05–2·68, P = 0·025).
Tests for interaction
Table S9 presents effect modification analyses to examine whether the association between DAO and the risk of stroke varied by sex, age and residence. The results indicated no significant effect modification by sex (P for interaction = 0·9073), age (P for interaction = 0·7073) or residence (P for interaction = 0·5712). This consistency suggests that the association between DAO and the risk of stroke is universal and not significantly influenced by demographic characteristics. This provides important insights for the formulation of prevention strategies: while the intensity of risk may vary among different populations, preventive measures should encompass all groups.
Other stratified associations and tests for interaction
In addition to analysing by sex, age and residence location, we investigated the association between four subtypes of obesity and geriatric stroke across different strata: BMI (<25, ≥25), marital status (married cohabiting, married non-cohabiting and never/formerly married), education (elementary or below middle or above), drinking status (non-drinker, moderate drinker and heavy drinker), smoking status (smoker and non-smoker), household expenditure (low and high) and number of chronic conditions (0, 1 and ≥2). Figure 2 shows fully adjusted OR and their 95 % CI for the association between three subtypes of obesity and incident geriatric stroke in all subgroups examined. We observed that the association between DAO and stroke risk was consistent across all subgroups, with no significant effect modification observed (all P interaction > 0·05).
Association between obesity subtypes and incident geriatric stroke in all subgroups.

Figure 2. Long description
Forest plot with three columns of odds ratios (ND/AO, D/NAO, D/AO), reference group ND/NAO. Stratification subgroups include overall (crude and adjusted), sex (male/female), age (45-60, >60), rural/urban residence, BMI (<25, ≥25), marital status (married cohabiting, married non-cohabiting, never/formerly married), education (elementary or below, middle or above), drinking status (non-drinker, drink less, drink more), smoking status (smoker/non-smoker), household expenditure (low/high), and chronic conditions. All interaction P-values exceed 0.05, indicating no significant effect modification. D/AO shows highest stroke risk estimate in nearly all subgroups. X-axis shows effect size on logarithmic scale.
Sensitivity analysis
Multiple imputation analyses for missing data confirmed our primary findings (Supplementary Table S2–S6). After adjustment for confounders, both isolated abdominal obesity (OR = 1·58, 95 % CI: 1·32–1·88, P < 0·001) and DAO (OR = 1·83, 95 % CI: 1·30–2·59, P < 0·001) remained significantly associated with stroke risk. No significant interactions were observed by sex, age or residential status (all P interaction > 0·05), suggesting consistent associations across demographic subgroups. Cox proportional hazards models yielded results broadly consistent with the logistic analyses (Supplementary Tables S7–S8). In CHARLS, associations remained significant after full adjustment, whereas ELSA showed similar point estimates that did not reach statistical significance.
Discussion
This investigation employed prospective cohort methodologies utilising the CHARLS and ELSA databases, encompassing 10 153 Chinese middle-aged and elderly participants followed over seven years and 5421 British counterparts, to examine the relationship between DAO and incident cerebrovascular events. Within the CHARLS population, both isolated abdominal obesity (ND/AO) and the combined DAO phenotype (D/AO) demonstrated significant elevation in stroke risk relative to controls, with the DAO category exhibiting the most substantial association magnitude, approaching a two-fold risk increment. In the ELSA cohort, exclusively the DAO phenotype manifested statistically significant stroke risk amplification, corresponding to a 138 % hazard elevation. These findings highlight DAO as a clinically meaningful nutritional-metabolic phenotype, consistently emerging as the highest-risk category across both populations. This phenotype represents a practical marker for nutritionists and clinicians to identify individuals warranting targeted intervention.
Our findings establish novel connections with prior research while addressing critical knowledge gaps. Confirming observations by Zhang et al. in European cohorts(Reference Leong, Teo and Rangarajan6,Reference Kim, Hwang and Sharp29,Reference Powell-Wiley, Poirier and Burke30) , we similarly identified grip strength can elevate stroke risk in the D/NAO group. Meanwhile, our ND/AO group findings directly corroborate the American Heart Association Scientific Statement(Reference Ramírez, de Oliveira and de Oliveira Máximo27) that elevated WC independently predicts stroke risk, while advancing prior work through precise phenotype quantification. Although the studies by Ramírez et al. found that DAO significantly impacted health outcomes among older adults, particularly concerning cardiovascular mortality(Reference Wang, Jiang and Hu11,Reference Ramírez, de Oliveira and de Oliveira Máximo27,Reference Veronese, Koyanagi and Soysal31) . The association between DAO and stroke remains unexplored. Our study is the first to uniquely quantify the combined impact through grip strength and waist, finding the strongest association with incident stroke risk when both conditions coexisted, significantly surpassing previous reports focused on single obesity or grip strength types. Qi et al. demonstrated that the combined low grip strength and obesity phenotype (including BMI with metabolic indicators) could further raise the risk of stroke(Reference Qi, Li and Lu32). Our findings align with their conclusions. In contrast to the approach by Qi KJ et al. (Reference Qi, Li and Lu32), our study innovatively employs WC as the primary metric for assessing metabolic abdominal obesity, which significantly enhance screening feasibility through reduced equipment costs and simplified operational protocols. The associations between DAO and an elevated risk of stroke suggest that, in order to prevent stroke in the middle-aged and older Chinese and UK population, multicomponent intervention techniques should involve both grip strength enhancement and WC management.
Our study reveals the profound implications of DAO as a distinct phenotype in nutritional science. The biological interaction between declining muscle strength and abdominal obesity significantly amplifies stroke risk beyond the additive effects of each condition alone. The underlying mechanisms may include: On one hand, decreased muscle strength leads to reduced secretion of myokines, while abdominal obesity promotes increased secretion of adipokines, jointly resulting in elevated levels of pro-inflammatory factors such as IL-6 and TNF-α(Reference Ouchi, Parker and Lugus12,Reference Kwaifa, Bahari and Yong13) . On the other hand, this inflammatory state further exacerbates endothelial dysfunction and insulin resistance through activation of signalling pathways including p38αMAPK, forming a vicious cycle that ultimately increases stroke risk(Reference Leong, Teo and Rangarajan6). In addition, previous studies have shown that both low grip strength and abdominal obesity independently confer higher cardiovascular and cerebrovascular risks in Chinese populations compared to international averages(Reference Leong, Teo and Rangarajan6,Reference Sun, Kovacs and Guiu-Jurado9,Reference Lv, Ji and Xu33,Reference Zhao, Gu and Qian34) . Building on these findings, our analysis reveals that, whether in Chinese or British populations, the combined impact of these factors on the risk of incident stroke is more pronounced than when considered in isolation. Moreover, our results indicate that while the risk of new stroke in the Chinese group with isolated abdominal obesity is lower than that in the DAO group, it is significantly higher than in other groups, including the non-DAO group in the UK. This population-specific risk pattern may be attributed to the unique muscle-to-fat distribution characteristics observed in Asian individuals. As reported by Sun et al., Asians tend to have lower muscle mass at similar BMI levels and are more prone to central obesity compared to Europeans(Reference Qin, Song and Nassis35).
Our investigation confirmed the initial hypothesis that DAO phenotype would demonstrate the strongest association with incident stroke across both populations. Nevertheless, the magnitude and significance patterns of stroke risk associations varied considerably between the dynapenic obesity categories in CHARLS and ELSA cohorts. Several factors may account for these observed disparities. First, despite both representing nationally representative ageing studies, fundamental demographic and environmental differences distinguish these populations. The Chinese cohort exhibited younger baseline age profiles (58·1 v. 65·7 years), substantially higher baseline stroke prevalence (6·8 % v. 2·7 %) and distinct lifestyle patterns, potentially reflecting different stages of epidemiological transition and healthcare accessibility between developing and developed nations. Second, phenotypic distribution heterogeneity contributed meaningfully to the divergent findings. CHARLS demonstrated predominant ND/NAO representation (51·4 %) with relatively lower D/AO prevalence (3·9 %), whereas ELSA showed more balanced ND/NAO (42·6 %) and ND/AO (47·1 %) distributions alongside elevated D/AO occurrence (6·0 %). These baseline compositional differences may have influenced statistical power and effect size detection across phenotypic categories. Third, the differential significance of isolated abdominal obesity (ND/AO) between cohorts warrants consideration. While ND/AO effects differed between cohorts – robust in CHARLS (OR: 1·57) but attenuated in ELSA (OR: 1·38, P = 0·22) – this variation may reflect ethnic and socio-economic differences. We employed harmonised procedures with population-specific diagnostic cutoffs [Methods]. Differences between CHARLS and ELSA may partly explain variable effect estimates. Nevertheless, D/AO consistently emerged as the highest-risk phenotype, demonstrating external validity at the phenotype level rather than identical biological effects across populations. Subgroup analyses revealed that the DAO–stroke relationship persisted across all demographic strata, including gender, age and residential location (interaction P values >0·05). Although risk estimates were numerically higher in males and urban residents, these differences were not statistically significant. This variation likely stems from distinct biological and environmental factors: men’s hormonal characteristics and metabolic profiles may increase cardiovascular vulnerability(Reference Alexander, Abbott and Aisbett36,Reference Qiao, Luo and Pei37) , while unmeasured factors including urbanisation-related dietary changes, environmental pollution exposure, differential healthcare access patterns and lifestyle transitions among urban populations might explain the observed trends. These findings support a population-wide prevention approach while acknowledging risk variations across different demographic characteristics. Subgroup analyses revealed that the DAO–stroke relationship persisted across all demographic strata, including urban and rural areas (interaction P = 0·5712). While risk estimates were numerically higher in urban Chinese men, these differences were not statistically significant. The urban environment may be associated with elevated DAO-stroke risk. However, unmeasured factors including urbanisation-related dietary changes, environmental pollution exposure, differential healthcare access patterns and lifestyle transitions warrant careful consideration when interpreting these findings.
Our study’s strengths include the use of two nationally representative prospective cohorts, the innovative integration of grip strength and WC to define DAO in accordance with Asian Working Group for Sarcopenia-2019 standards and the provision of clinically actionable indicators. This represents the first exploration of the relationship between DAO and incident stroke in middle-aged and older adults, identifying high-risk populations. Methodologically, we enhanced statistical rigour through multivariate adjustments, sensitivity analyses and assessment of effect modification across stratified groups. This study has several limitations. First, exclusion of participants with baseline stroke or missing anthropometric data may have introduced selection bias. Second, dynapenia assessment relied on grip strength only; lower-limb muscle strength and balance were not evaluated. Third, WC does not distinguish visceral from subcutaneous adiposity, potentially introducing measurement error across ethnic groups. Fourth, stroke diagnosis relied on self-report or proxy report, introducing potential for recall bias and underascertainment of minor strokes. Furthermore, stroke subtypes were unavailable, limiting mechanistic analysis. Fifth, DAO was assessed only at baseline; longitudinal changes in grip strength and WC could not be captured, potentially introducing exposure misclassification. Sixth, although we adjusted for key socio-demographic, lifestyle and health-status covariates, residual confounding cannot be excluded. Detailed diet quality, objectively measured physical activity, inflammatory biomarkers, medication use and healthcare access were either unavailable or not fully harmonised across CHARLS and ELSA. Finally, although this prospective design establishes temporal sequence, reverse causality remains possible as early subclinical vascular disease could affect physical activity and body composition independent of measured DAO status. We partially addressed this through baseline CVD exclusion, though undetectable subclinical pathology cannot be ruled out.
Conclusions
In conclusion, this prospective cohort study demonstrates that DAO is independently associated with a twofold increased risk of incident stroke among middle-aged and older adults in both China and the UK. These findings highlight the importance of integrating DAO assessment into routine clinical practice to identify individuals at high stroke risk, especially in UK and among Chinese men experiencing rapid urbanisation and lifestyle transitions. Future research should focus on further investigating the potential mechanisms of myokine–adipokine interactions in these high-risk groups, evaluating targeted multicomponent interventions and developing translational biomarkers to enhance risk prediction and reduce stroke burden in ageing populations.
Supplementary material
For supplementary material/s referred to in this article, please visit https://doi.org/10.1017/S0007114526108253
Data availability statement
This study utilised data from two cohorts. CHARLS data are publicly available at https://charls.pku.edu.cn/ with free registration for academic researchers. ELSA data are accessible through the ELSA website (https://www.elsa-project.ac.uk/). Both datasets are available upon request subject to data use agreements and ethical approvals as stipulated by the respective study administrators.
Acknowledgements
We gratefully acknowledge the China Health and Retirement Longitudinal Study (CHARLS) research team and Peking University’s national team for providing access to high-quality data. We also acknowledge the English Longitudinal Study of Ageing (ELSA) team for data access and support. We thank all field investigators, data center staff and study participants for their invaluable contributions.
M.H.S. contributed to conceptualisation, methodology, formal analysis, data curation and manuscript preparation. C.T. and H.B.L. assisted with methodology, software and formal analysis. H.Y.G. and T.Y. provided conceptualisation, methodology, validation and supervision.
This study received no specific grant from any public, commercial or not-for-profit agency.
The authors declare no conflicts of interest.