A growing body of evidence indicates that high and stable levels of physical aggression and related externalizing behavior problems in childhood are associated with a range of negative outcomes in adolescence (e.g., Broidy et al., Reference Broidy, Nagin, Tremblay, Bates, Brame and Dodge2003; Fergusson, Lynskey, & Horwood, Reference Fergusson, Lynskey and Horwood1996; Moffitt, Caspi, Dickson, Silva, & Stanton, Reference Moffitt, Caspi, Dickson, Silva and Stanton1996), including poor emotion regulation, school failure, peer problems, and adolescent delinquency (Fergusson et al., Reference Fergusson, Lynskey and Horwood1996; Loeber, Farrington, Stouthamer-Loeber, Moffitt, & Caspi, Reference Loeber, Farrington, Stouthamer-Loeber, Moffitt and Caspi1998; Moffitt et al., Reference Moffitt, Caspi, Dickson, Silva and Stanton1996). Interpretation of this work, however, is complicated by different definitions of aggression and related problems ranging from potentially normative aggression in young children's peer groups (e.g., Hay, Castle, & Davies, Reference Hay, Castle and Davies2000), to combinations of aggressive and noncompliant behavior (e.g., Côté, Tremblay, Nagin, Zoccolillo, & Vitaro, Reference Côté, Tremblay, Nagin, Zoccolillo and Vitaro2002; Schaeffer et al., Reference Schaeffer, Petras, Ialongo, Masyn, Hubbard and Poduska2006), to more serious aggression that occurs in the context of high levels of disruptive and antisocial behavior (e.g., Moffitt et al., Reference Moffitt, Caspi, Dickson, Silva and Stanton1996; Odgers et al., Reference Odgers, Moffitt, Broadbent, Dickson, Hancox and Harrington2008). Furthermore, not all children who show early aggressive and disruptive behavior continue to have difficulties, raising important questions about the best way to identify the subgroup of children who are truly at risk, both to better delineate the pathways and processes leading to serious long-term difficulties and to inform prevention efforts.
Earlier studies of aggression and disruptive behavior relied on cutoff scores to identify longitudinal patterns (e.g., Aguilar, Sroufe, Egeland, & Carlson, Reference Aguilar, Sroufe, Egeland and Carlson2000; Moffitt et al., Reference Moffitt, Caspi, Dickson, Silva and Stanton1996), whereas more recent research has used trajectory analysis or other statistical techniques that identify subgroups of children following relatively distinct developmental pathways (e.g., Broidy et al., Reference Broidy, Nagin, Tremblay, Bates, Brame and Dodge2003; Odgers et al., Reference Odgers, Moffitt, Broadbent, Dickson, Hancox and Harrington2008; Schaeffer et al., Reference Schaeffer, Petras, Ialongo, Masyn, Hubbard and Poduska2006). Although most studies delineating developmental trajectories have specifically modeled ratings of physical aggression (Broidy et al., Reference Broidy, Nagin, Tremblay, Bates, Brame and Dodge2003), others have used more inclusive definitions that also encompass other disruptive or predelinquent behaviors (Odgers et al., Reference Odgers, Moffitt, Broadbent, Dickson, Hancox and Harrington2008; Schaeffer et al., Reference Schaeffer, Petras, Ialongo, Masyn, Hubbard and Poduska2006; Shaw, Gilliom, Ingoldsby, & Nagin, Reference Shaw, Gilliom, Ingoldsby and Nagin2003). In the current report, we focus specifically on teacher ratings of physical aggression, but our work is informed by studies that include broader definitions of disruptive behavior. Interest has also moved beyond the description of developmental trajectories per se to concerns about both the antecedents and sequelae of different longitudinal patterns of physical aggression. The risk of negative outcomes is clearly greatest for children showing high levels of stable aggression from childhood to adolescence, which in turn, is most evident in the context of family adversity, but research nevertheless also indicates that such outcomes are not foreordained (Moffitt, Reference Moffitt, Lahey, Moffitt and Caspi2003; Odgers et al., Reference Odgers, Moffitt, Broadbent, Dickson, Hancox and Harrington2008; Rutter, Reference Rutter, Lahey, Moffitt and Caspi2003). Much of the research on predictors and consequences of physical aggression trajectories has focused on boys, although consideration of physical aggression in girls is also warranted, given questions about the age of onset and developmental course of aggression and conduct problems in girls (Crick & Zahn-Waxler, Reference Crick and Zahn-Waxler2003; Hay, Reference Hay2007; Moffitt, Caspi, Rutter, & Silva, Reference Moffitt, Caspi, Rutter and Silva2001; Silverthorn & Frick, Reference Silverthorn and Frick1999).
In this paper we use data from the NICHD Study of Early Child Care and Youth Development to describe trajectories of physical aggression in school as rated by teachers, looking separately at patterns of aggression in boys and girls from first to sixth grade. We chose to model trajectories separately by child sex to address concerns about the lack of attention to differential patterns and processes in the emergence of problem behavior in girls (Crick & Zahn-Waxler, Reference Crick and Zahn-Waxler2003) and the possibility that physical aggression would be relatively rare and less predictive in girls (Silverthorn & Frick, Reference Silverthorn and Frick1999). We appreciate, however, the arguments of Moffitt et al. (2001) that developmental processes are more similar than different with respect to antisocial behavior in males and females, even if levels remain different. After modeling trajectories, we then utilize earlier child and maternal parenting measures, obtained when children were preschool age and selected because of their theoretical importance, to predict trajectory group membership; these include children's language development and ability to delay gratification, and observed maternal sensitivity and self-reported harsh control. Consideration of these child and parenting measures improves upon prior research on precursors of aggression trajectories, which primarily has emphasized sociodemographic indicators of risk (e.g., Côté, Vaillancourt, Barker, Nagin, & Tremblay, Reference Côté, Vaillancourt, Barker, Nagin and Tremblay2007; Nagin & Tremblay, Reference Nagin and Tremblay2001) or has relied on teacher or parent report measures of child characteristics that are concurrent with the initial assessment of aggression and often obtained from the same reporter (Côté et al., Reference Côté, Tremblay, Nagin, Zoccolillo and Vitaro2002; Schaeffer et al., Reference Schaeffer, Petras, Ialongo, Masyn, Hubbard and Poduska2006). Next, we examine a broad range of adjustment outcomes in early adolescence as a function of aggression trajectories including mother, teacher, and self-report measures of social adjustment, school functioning, and relationship quality. This is in contrast to most research on the sequelae of physical aggression trajectories, which has tended to focus on more serious antisocial and delinquent outcomes, rather than on more subtle adjustment problems that may still confer risk in early adolescence and that may also be associated with low to moderate levels of aggression. In addition, given the relatively low prevalence of conduct problems in girls in middle childhood and early adolescence (e.g., Messer, Goodman, Rowe, Meltzer, & Maughan, Reference Messer, Goodman, Rowe, Meltzer and Maughan2006), examination of a wider range of outcomes may provide more insight into the sequelae of physical aggression in girls.
Trajectories of Aggression
Research on early-emerging physical aggression indicates that persistent aggression, rather than more age-related (Hartup, Reference Hartup1974; Tremblay, Reference Tremblay2000) or time-limited aggression (Moffitt, Reference Moffitt1993, Reference Moffitt, Lahey, Moffitt and Caspi2003), predicts more problematic outcomes (Broidy et al., Reference Broidy, Nagin, Tremblay, Bates, Brame and Dodge2003; Moffitt et al., Reference Moffitt, Caspi, Dickson, Silva and Stanton1996; Patterson, Forgatch, Yoerger, & Stoolmiller, Reference Patterson, Forgatch, Yoerger and Stoolmiller1998). A particularly promising research strategy involves the identification of subgroups of children following different pathways or trajectories of physical aggression who theoretically should also vary in long-term risk. As already noted, much of the early research on physical aggression trajectories focused on boys, given their elevated levels of physical aggression relative to girls (in contrast to relational or social aggression, which is equally elevated or higher in girls; Crick & Grotpeter, Reference Crick and Grotpeter1995; Murray-Close, Ostrov, & Crick, Reference Murray-Close, Ostrov and Crick2007). Boys' physical aggression trajectories are generally described by three or four patterns, when modeled using teacher ratings obtained from school entry to early adolescence. Broidy et al. (Reference Broidy, Nagin, Tremblay, Bates, Brame and Dodge2003) ran parallel analyses on six cohorts of boys and reported that across samples, two each from the United States, Canada, and New Zealand, most boys evinced either low or moderate levels of aggression. Small groups of boys showing either high increasing or high stable aggression also were identified consistently. A fourth moderate decreasing trajectory was also identified in the two Canadian samples. In these analyses, low to moderate levels of aggression appeared to be normative, whereas only 4–11% of boys were on a high aggression trajectory.
Despite the emphasis on trajectories of aggression in boys, Broidy et al. (Reference Broidy, Nagin, Tremblay, Bates, Brame and Dodge2003) also presented data on longitudinal patterns of physical aggression in girls. Teacher-rated physical aggression was generally much lower in girls, but stable aggression groups also emerged. The vast majority of girls showed either no physical aggression or very low aggression, but even when aggression was stable and elevated relative to other girls, it was still much lower than the level of aggression reported for boys. Across four samples of girls, from two to four trajectories of physical aggression were identified, with over 80% in no aggression or very low aggression groups. In three samples, at most 10% of girls were in a higher aggression group and in one sample, no girls were actually elevated. More recently, Schaeffer et al. (Reference Schaeffer, Petras, Ialongo, Masyn, Hubbard and Poduska2006) used growth mixture modeling instead of trajectory analysis to identify developmental patterns of aggressive and disruptive behaviors in a sample of inner city, mostly African American children studied from first to fifth grade. Two fairly similar patterns of aggressive/disruptive behavior emerged for boys and girls (chronic high and low), but boys also showed an increasing trajectory in contrast to a moderate stable pattern for girls; on average, girls were also lower in aggression and disruptive behavior than boys.
These studies are important for several reasons. From a developmental psychopathology perspective, it is important to identify pathways and risk markers for later adjustment difficulties as well as for diagnosable disorders. The availability of large longitudinal data sets allows for the examination of different developmental pathways that facilitates the identification of subgroups of children who are truly at risk in contrast to those showing only age-related behavior problems (e.g., NICHD Early Child Care Research Network [ECCRN], 2004). Furthermore, there are continuing debates about the nature of aggression in girls and boys (e.g., Crick & Zahn-Waxler, Reference Crick and Zahn-Waxler2003; Hay, Reference Hay2007), calls for studies that model developmental trajectories separately by gender (Crick & Zahn-Waxler, Reference Crick and Zahn-Waxler2003), and concerns about whether the thresholds for problematic aggression and disruptive behavior are comparable across gender (e.g., Côté et al., Reference Côté, Tremblay, Nagin, Zoccolillo and Vitaro2002). For example, it has been argued that early onset and stable physical aggression is more difficult to identify in girls than in boys, and that more subtle indicators may be precursors of later behavior problems in girls (e.g., Côté, Zoccolillo, Tremblay, Nagin, & Vitaro, Reference Côté, Zoccolillo, Tremblay, Nagin and Vitaro2001). However, the findings of Broidy et al. (Reference Broidy, Nagin, Tremblay, Bates, Brame and Dodge2003) suggest that stable physical aggression is both less common in girls and is less clearly a predictor of serious antisocial behavior in adolescence, in contrast to the findings for boys.
The NICHD ECCRN (2004) examined mother reports of physical aggression from ages 2 to 9 in a large sample of children not considered to be at risk. Data for boys and girls were considered together. Five aggression trajectories were identified: very low, low stable, moderate stable, moderate decreasing, and chronic. In general, a linear relationship was found between the level of aggression and the proportion of boys in the group, with the chronic aggression trajectory group comprised almost entirely of boys (72%), thereby possibly obscuring unique patterns of physical aggression in girls. Indeed, when boys' and girls' aggression trajectories were modeled together in the same analysis, only 8 out of 585 girls (1.4%) were in the high and stable aggression group, precluding a clear evaluation of the meaning or sequelae of aggression in girls. In a recent paper, Joussemet et al. (Reference Joussemet, Vitaro, Barker, Côté, Nagin and Zoccolillo2008) also reported that very few girls were represented in higher aggression trajectory groups and that when both boys' and girls' trajectories were modeled together, child sex was one of the main predictors of group assignment. Thus, it is prudent to examine trajectories separately, as some trajectories of physical aggression, although lower than in boys, may be nonnormative in girls, thereby placing them at risk for adjustment difficulties both at home and in the peer group (Côté et al., Reference Côté, Vaillancourt, Barker, Nagin and Tremblay2007; Murray-Close et al., Reference Murray-Close, Ostrov and Crick2007).
In the current study, we seek to follow up on this work by identifying trajectories of physical aggression during the elementary school years, separately for boys and girls, as rated by teachers. Our large sample includes children recruited from 10 locations across the United States and from urban, suburban, and rural areas, thereby providing a broader sample than utilized in prior studies of aggression trajectories. We utilize teacher ratings of aggression, rather than mother reports, partly because aggression that is obvious in school may be more indicative of adjustment problems than aggression identified by parents. Whereas strong peer group and social norms are likely to regulate (in either direction) the expression of aggression in the school setting, aggression toward siblings may be more normative.
Precursors of Aggression Trajectories
As is clear from the literature, high-stable aggression in boys is associated with sociodemographic and family risk (Nagin & Tremblay, Reference Nagin and Tremblay2001). This is not surprising in view of the wealth of data linking early-emerging conduct problems and delinquency to lower parental education and income and single-parent status (Campbell, Shaw, & Gilliom, Reference Campbell, Shaw and Gilliom2000; Fergusson et al., Reference Fergusson, Lynskey and Horwood1996; Moffitt et al., Reference Moffitt, Caspi, Dickson, Silva and Stanton1996; Patterson et al., Reference Patterson, Forgatch, Yoerger and Stoolmiller1998). Although more proximal child characteristics and parenting processes may have dynamic explanatory value, illuminating how problem behavior develops, they have been examined only rarely in studies of trajectories of physical aggression. Shaw et al. (Reference Shaw, Gilliom, Ingoldsby and Nagin2003) reported that child fearlessness in toddlerhood distinguished higher from lower trajectory groups of conduct problem behaviors assessed by maternal report from ages 2 to 9 in a high risk sample of inner city boys. In the NICHD Study of Early Child Care and Youth Development (SECCYD), membership in the five trajectory groups was predicted by sociodemographic risk, being a boy, and maternal stimulation and involvement observed at home (NICHD ECCRN, 2004). Taken together, these findings suggest that child characteristics, maternal parenting behavior, and sociodemographic risk predict trajectories of disruptive and aggressive behavior, as assessed primarily in boys. Clearly, then, there is reason, both theoretical (e.g., social learning theory, attachment theory) and empirical for including more process-oriented predictors in studies of the origins of trajectories of physical aggression in both boys and girls of elementary school age.
Toward this end, we examine two child characteristics and two aspects of maternal parenting that should predict differential levels of physical aggression. Moffitt (Reference Moffitt1993) and others (e.g., Lahey, Waldman, & McBurnett, Reference Lahey, Waldman and McBurnett1999; Tremblay, Reference Tremblay2000) implicate cognitive delays, especially in emergent language skills, as a possible risk factor for persistent aggressive behavior, particularly in boys. Early language development is examined in this inquiry as a potential predictor of aggression over time (Dionne, Tremblay, Boivin, Laplante, & Pérusse, Reference Dionne, Tremblay, Boivin, Laplante and Pérusse2003; Tremblay, Reference Tremblay2000). Tremblay (Reference Tremblay2000) hypothesized that children's physical aggression should decline as more sophisticated language and social cognitive skills emerge, thereby providing preschool children with alternative strategies such as negotiation and sharing to resolve disputes over toys. Empirical evidence confirms a link between poor language development and aggressive and disruptive behavior in young children (Cantwell & Baker, Reference Cantwell and Baker1987; Dionne et al., Reference Dionne, Tremblay, Boivin, Laplante and Pérusse2003; Stevenson, Richman, & Graham, Reference Stevenson, Richman and Graham1985). Thus, we expect that children showing poorer language development in the preschool period will be on a higher aggression trajectory.
During the preschool period, children also become more skilled at regulating their own behavior (Campbell, Reference Campbell2002; Kopp, Reference Kopp1989) and individual differences in the ability to delay gratification, an indicator of self-regulation, should also be linked to the ability to control aggression. Children with better self-regulatory strategies that are reflected in the ability to wait for a desired goal and that help them to regulate their impulses should be less likely to behave aggressively in school. Thus, we expect that more difficulty delaying gratification will predict a higher trajectory of physical aggression over the elementary school years.
Links between delayed language and poor regulation and trajectories of physical aggression also may be stronger in boys, given their higher levels of language difficulties (e.g., Baker & Cantwell, Reference Baker, Cantwell, Chess and Thomas1983) and problems with impulse control relative to girls during the preschool period (e.g., Bongers, Koot, van der Ende, & Verhulst, Reference Bongers, Koot, van der Ende and Verhulst2003; Maccoby, Reference Maccoby1998). In support of this possibility, Messer et al. (Reference Messer, Goodman, Rowe, Meltzer and Maughan2006) recently reported that boys who later developed conduct problems were exposed to more “neurodevelopmental” risks in early childhood, and Côté et al. (Reference Côté, Tremblay, Nagin, Zoccolillo and Vitaro2002) found that the combination of hyperactivity and fearlessness in kindergarten, which may be construed as indicators of poor impulse control, predicted adolescent conduct disorder in boys, but not girls. Hay (Reference Hay2007) has also suggested, in a recent review, that the combination of language delays and regulatory difficulties may partly account for the observed sex differences in aggression that emerge by preschool age. However, it is also possible that both boys and girls with less proficient language and poorer ability to regulate impulses will evince more physical aggression in elementary school. That is, a similar process may be operative across sexes even though the levels of problem behavior may appear to be different (Moffitt et al., 2001).
Warm, supportive, and proactive parenting as well as limited use of physical punishment and negative, coercive child-rearing strategies should likewise be associated with less physical aggression in children (Campbell et al., Reference Campbell, Shaw and Gilliom2000; Coie & Dodge, Reference Coie, Dodge and Damon1998; Kochanska, Reference Kochanska2002; Patterson et al., Reference Patterson, Forgatch, Yoerger and Stoolmiller1998; Snyder, Reid, & Patterson, Reference Snyder, Reid, Patterson, Lahey, Moffitt and Caspi2003). When parents are warm and supportive, they provide a basis for confidence in self and trust in others (Bowlby, Reference Bowlby1969), model positive interaction strategies likely to carry over to interactions with peers (Snyder et al., Reference Snyder, Reid, Patterson, Lahey, Moffitt and Caspi2003), and foster a willingness to comply with adult expectations (Kochanska, Reference Kochanska2002). In contrast, negative, coercive exchanges are likely to foster anger, resentment, and insecurity in children as well as model power assertive and coercive ways of interacting with age mates (Miller & Sperry, Reference Miller and Sperry1987; Snyder et al., Reference Snyder, Reid, Patterson, Lahey, Moffitt and Caspi2003). Thus, in addition to examining sociodemographic risk and child characteristics, in the current report we include a maternal report measure of harsh parenting and an observed measure of maternal sensitive responsiveness.
It is expected that higher levels of harsh control and lower levels of observed maternal sensitivity in early childhood will predict higher levels of physical aggression as observed by teachers in elementary school. There also is suggestive evidence that boys may be more vulnerable than girls to less positive parenting and associated risk factors (Cole, Teti, & Zahn-Waxler, Reference Cole, Teti and Zahn-Waxler2003; McFadyen-Ketchum, Bates, Dodge, & Pettit, Reference McFadyen-Ketchum, Bates, Dodge and Pettit1996). For example, McFadyen-Ketchum et al. (Reference McFadyen-Ketchum, Bates, Dodge and Pettit1996) reported that coercive responses to child misbehavior in the home and low warmth predicted increases in externalizing problems in boys, but decreases in girls, followed from kindergarten to third grade. These gender differentiated findings suggested to them that boys were more likely to escalate negative behavior in the face of negative maternal control, whereas girls were more likely to comply. Cole et al. (Reference Cole, Teti and Zahn-Waxler2003) suggest that the dynamics of the mother–child relationship and mutual regulation of both positive and angry exchanges, along with girls' better self-regulation skills, may explain why they found more stable behavior problems in preschool boys in the context of angry interactions. These findings, paired with the general assumption that boys are more vulnerable to a range of early environmental stressors (Hay, Reference Hay2007), may support an argument in favor of boys being more vulnerable to harsh control and low sensitivity. Nevertheless, only limited theory or data are available to support expectations that girls' and boys' trajectories of aggression will be differentially predicted by parenting measures. In summary, we propose that indicators of early language development, self-regulation, and maternal parenting assessed during the infancy and preschool years will differentially predict teacher-rated trajectories of physical aggression, and that the links between these early measures and children's aggression may be especially strong for boys.
Sequelae of Aggression Trajectories
Based on the theoretical perspectives of Moffitt (Reference Moffitt1993) and Patterson et al. (Reference Patterson, Forgatch, Yoerger and Stoolmiller1998), early and persistent aggression, especially in the context of family adversity, should forecast a variety of negative outcomes, including not only more antisocial behavior, but also more family and peer relationship problems and academic difficulties. Research linking trajectory group membership with later outcomes has emphasized delinquency and antisocial behavior almost exclusively. In general, boys rated by teachers as more physically aggressive in elementary school were more likely to acknowledge engaging in delinquent behavior in adolescence, but girls, even relatively aggressive girls, did not report engaging in delinquent activities in adolescence (Broidy et al., Reference Broidy, Nagin, Tremblay, Bates, Brame and Dodge2003).
Of importance, however, more subtle adjustment problems were not examined in the multisample analyses reported by Broidy et al. (Reference Broidy, Nagin, Tremblay, Bates, Brame and Dodge2003), although moderate aggression in both boys and girls may well have some negative sequelae. In earlier work using the NICHD SECCYD data set, we argued that aggression in early childhood may predict not only later aggression and antisocial behavior, but a range of social and academic outcomes, partly as a function of the level and stability of early aggression (Campbell et al., Reference Campbell, Spieker, Burchinal and Poe2006; NICHD ECCRN, 2004), a point also made recently by Fergusson, Horwood, and Ridder (Reference Fergusson, Horwood and Ridder2005). In fact, we found that outcomes varied by trajectory group, with those on the moderate decreasing trajectory (i.e., those showing only transient and age-related aggression) showing good adjustment at age 9 (NICHD ECCRN, 2004) and across the transition to adolescence (Campbell et al., Reference Campbell, Spieker, Burchinal and Poe2006). In contrast, children in the moderate stable group appeared to be showing signs of inattention and poor behavioral regulation, whereas those on the chronic aggression trajectory appeared to be showing early signs of conduct problems and worsening peer relations (Campbell et al., Reference Campbell, Spieker, Burchinal and Poe2006; NICHD ECCRN, 2004). In addition, children in the low, stable aggression trajectory group (in contrast to the very low group) also showed signs of emerging peer problems in elementary school, and this was especially so for girls who reported higher levels of loneliness in third and fifth grade (Campbell et al., Reference Campbell, Spieker, Burchinal and Poe2006), perhaps because levels of physical aggression, even quite low levels, are nonnormative in school-age girls (Maccoby, Reference Maccoby1998; Moffitt, Reference Moffitt, Lahey, Moffitt and Caspi2003).
Based on the foregoing literature review, we expect to find that boys and girls on both high and moderate trajectories of aggression in school will show poorer adjustment outcomes on measures of internalizing and externalizing problems, academic competence, and social relationships, as reported by mothers, teachers, and the children themselves, relative to those who are on a very low aggression trajectory across middle childhood. We do not make explicit predictions about different patterns of outcome by child sex, although it is likely that girls on both higher and more moderate aggression trajectories will show a mix of internalizing, externalizing, and social problems at the transition to adolescence, whereas boys will show predominantly externalizing problems (Crick & Zahn-Waxler, Reference Crick and Zahn-Waxler2003).
Method
Participants
Families were recruited during hospital visits to mothers shortly after the birth of a child in 1991 at 10 locations in the United States (Little Rock, AR; Irvine, CA; Lawrence, KS; Boston, MA; Philadelphia, PA; Pittsburgh, PA; Charlottesville, VA; Morganton, NC; Seattle, WA; Madison, WI). Recruitment and selection procedures are described in detail in several publications (see NICHD ECCRN, 1997, 2002) and on our Web sites (http://secc.rti.org or www.nichd.nih.gov/crmc/secc). During selected 24-hr intervals, all women giving birth in study hospitals were screened for eligibility and willingness to be contacted again. Of the 8,986 mothers who gave birth during the sampling period, 5,416 (60%) agreed to be telephoned in 2 weeks and met the eligibility requirements (healthy mother over 18 who spoke English, singleton birth, live within an hour of research site, neighborhood not deemed too dangerous by police to visit). Of that group, a conditionally random sample of 3,015 was selected (56%) for a 2-week phone call. The conditioning assured adequate representation (at least 10%) of single mothers, mothers without a high school degree, and ethnic minority mothers. At the 2-week call, families were excluded if the baby had been hospitalized for more than 7 days, they expected to move in the next 3 years, or they could not be reached in at least three attempts. A total of 1,525 families were selected for the call as eligible and agreed to an interview. Of these, 1,364 completed a home interview when the infant was 1 month old and became study participants.
The resulting sample was diverse: 24% were minority, 11% of the mothers had not completed high school, and 14% were single. Mothers had an average of 14.4 years of education. Average family income was 3.6 times the poverty threshold. The participating families were similar to the eligible hospital sample in terms of maternal education, percentage in different ethnic groups, and presence of a husband/partner in the household.
The trajectory analyses conducted for the current report are based on 1,081 children (533 girls, 548 boys, 79% of initial sample) who had at least two out of a possible six teacher reports of aggressive behavior between first grade and sixth grade (see below). These children were compared with those not included in this analysis (n = 283) on demographic indicators at 1 month and on one observational variable assessed at 6 months. Included and excluded children did not differ on child sex. However, included children and families were more likely to be White (82% included vs. 75% not included) and to have a higher income to needs ratio (Ms = 2.91 vs. 2.10): F (1, 1272) = 20.96, p < .001. Mothers included in these analyses had a higher level of education (Ms = 14.43 vs. 13.5 years), F (1, 1361) = 31.32, p < .001, and were more likely to be living with a partner at 1 month (87% vs. 79.5%). Mothers included in these analyses were also higher in sensitivity when observed with their infants at 6 months (M = 9.28) than were mothers who were not included (M = 8.87), F (1, 1270) = 9.80, p < .01. Because the NICHD SECCYD sample excluded children of adolescent mothers, mothers who did not speak English, and children who were hospitalized at birth or who had a diagnosed disability, children experiencing the full range of potentially high risk conditions are not represented in the data set.
Overview of Data Collection
Children were followed from birth to sixth grade. Mothers were interviewed in person during home visits when infants were 1 month old. Detailed measures of the family and parenting behavior were obtained via interviews and observations when children were 6, 15, 24, 36, and 54 months old during home and laboratory visits. Children's language development was assessed at 36 and 54 months and children's academic achievement was assessed at fifth grade. Teachers also completed questionnaires on study children yearly from first through sixth grade. Mothers and children also provided data during home and laboratory visits across the elementary school years. The following sections describe the specific variables used in this paper and how they functioned in the analyses. Additional details about all data collection procedures, psychometric properties of the instruments, and descriptions of how composites were derived and constructed are documented in Manuals of Operation of the study (http://secc.rti.org).
Measures
Teacher reports of aggressive behavior
At each assessment from first grade through sixth grade, teachers completed the Teacher Report Form of the Achenbach Child Behavior Checklist (TRF; Achenbach, Reference Achenbach1991a). The TRF includes 113 items that describe typical, but potentially problematic child behaviors. Teachers rated how descriptive each item was of the child's usual behavior in school over the last 2 months as 0 = not true, 1 = somewhat or sometimes true, or 2 = very true or often true.
For the current trajectory analyses, six items reflecting overt physical aggression to people and objects were selected: destroys own things, destroys others' things, gets in many fights, threatens others, physically attacks people, and cruelty, bullying, or meanness to others. Raw scores for these items were summed at each age and could range from 0 to 12. This scale showed adequate internal consistency across age with coefficient alphas ranging from 0.81 to 0.86. Scores were moderately correlated over time (range = 0.24–0.55 for boys, mean = 0.38; range = 0.26–0.62 for girls, mean = 0.38). Mean scores for boys on this scale ranged from a high of 0.76 (SD = 1.67) at second grade to a low of 0.64 (SD = 1.54) at sixth grade; the average mean score for boys on the physical aggression composite was 0.68. Mean scores for girls were consistently lower ranging from a high of 0.34 at third grade (SD = 1.21) to a low of 0.19 (SD = 0.74) at sixth grade; the average aggression score across grades for girls was 0.295.
Predictors of trajectory group membership
Demographic characteristics
During home interviews at 1 month, mothers reported their own education (in years) and the study children's race/ethnicity. The presence of a husband or partner in the home was assessed during telephone and in-person interviews at regular intervals between 1 month and 54 months and was scored as “yes” or “no” at each assessment from 1 month to 54 months. Mothers also reported their family income at 1, 6, 15, 24, 36, and 54 months. The income/needs ratios were calculated from US Census Bureau tables as the ratio of family income to the appropriate poverty threshold for each household size and these ratios were averaged from 1 to 54 months.
A sociodemographic risk factor score was derived to reduce the number of variables in the analyses and because demographic indicators were quite highly correlated. Maternal education, mean income/needs, child ethnicity, and whether the mother was partnered were included as early (birth to 54 months) demographic predictors. We first constructed a risk index based on four variables (0 or 1), with a 1 scored for the following: minority status; family with an average income/needs ratio of 2 or less (i.e., twice the poverty level or lower); child's mother had only a high school education or less; child's mother was unmarried at any time from the child's birth through 54 months. The entire data set (n = 1,364) was used in this analysis. These four variables were then entered into a categorical confirmatory factor analysis to determine whether they formed a single factor. The model fit the data well (Tucker–Lewis index = 0.98; comparative fit index = 0.99, root mean square area of approximation = 0.06), so the factor score estimate of risk was used as a covariate in subsequent analyses. Factor loadings ranged from .94 for income to .59 for ethnicity.
Child characteristics
Language at 36 and 54 months
At 36 months, children were administered the Reynell Developmental Language Scale (Reynell, Reference Reynell1991). The scale is composed of 67 items and yields two scores, a verbal comprehension score and an expressive language score. Both scales have adequate internal consistency (α = 0.93 and 0.86, respectively). At 54 months the Preschool Language Scale (PLS, α = 0.87; Zimmerman, Steiner, & Pond, Reference Zimmerman, Steiner and Pond1992) was administered and standard scores on the auditory comprehension and expressive communication scales were composited. Scores on the Reynell and PLS were then composited to create a measure of early language development (α = 0.83). Examiners went through a rigorous training and certification procedure before collecting data.
Delay of gratification
At 54 months, children were observed in a standard delay of gratification task. In the middle of a laboratory visit, the child was offered a small immediate reward of candy (m and m's or other preferred food, if the parent objected to candy) or a larger reward later. The child was taught to ring a bell to summon the experimenter who needed to leave the room and then was left to play the “waiting game.” The child was given two plates: one with a small amount of food that could be eaten right away (but only after the experimenter was summoned back by a ring of the bell), and another with a larger amount that could only be eaten at the end of the waiting game. Latency or length of time waited was used in the analysis.
Maternal parenting
Maternal sensitivity
Mother–child interactions were videotaped in semistructured 15-min observations at 6, 15, 24, 36, and 54 months. The tasks provided a context for assessing age-appropriate qualities of maternal behavior. The tasks at all ages are described in the Manuals of Operation and involved a free play session at 6 months and developmentally appropriate play and problem-solving tasks at subsequent assessments.
Data were collected across the 10 sites by research assistants who attended centralized training sessions at each age and passed certification tests prior to data collection. Videotapes of mother–child interactions were sent to a central nondata collection site for coding. Coders were blind to other information about study families. At 6, 15, and 24 months, composite maternal sensitivity scores were created from the sums of three 4-point ratings (maternal sensitivity to child nondistress, intrusiveness [reversed], and positive regard). At 36 and 54 months, the maternal sensitivity composite was the sum of three 7-point ratings of supportive presence, respect for autonomy, and hostility (reversed). Cronbach alphas for the sensitivity composites ranged from 0.70 to 0.84. Intercoder reliability was determined by assigning two coders to 19–20% of the tapes drawn randomly at each assessment period. Intercoder reliability was calculated as the intraclass correlation coefficient. Intercoder reliability coefficients for the composite maternal sensitivity scores used in the current report ranged from 0.83 to 0.87. For the current analyses, sensitivity scores were averaged from 6 months to 54 months to form a composite indicator of maternal sensitivity during infancy and early childhood. The coefficient alpha for this overall maternal sensitivity composite was 0.77.
Maternal reports of harsh discipline
At 54 months, mothers completed a revised version of the Raising Children Checklist (Greenberger & Goldberg, Reference Greenberger and Goldberg1989) that was modified specifically for use in the NICHD SECCYD. The current analyses focused on the eight-item harsh control scale. Mothers were asked to rate their attitudes and expectations about child behavior on a 4-point scale (definitely no to definitely yes). Higher scores reflect stronger agreement with items assessing expectations for immediate compliance and respect for authority, as well as approval of the use of physical punishment (α = 0.71).
Child outcomes
Maternal reports of adjustment
At sixth grade mothers completed standardized questionnaires to describe children's behavior at home and with peers: the Social Skills Rating System (SSRS; Gresham & Elliott, Reference Gresham and Elliott1990), the Child Behavior Checklist (CBCL; Achenbach, Reference Achenbach1991b), and the Adult–Child Relationship Scale (Pianta, Reference Pianta2001). The 38 social competence items from the SSRS assessed social skills with peers and adults (α = 0.90). Scores on the two broadband scales of the CBCL, Internalizing Problems (e.g., too fearful and anxious, 31 items, α = 0.87) and Externalizing Problems (e.g., argues a lot, 33 items, α = 0.89), were used to index behavior problems. Finally, mothers rated the degree of conflict they experienced with the study child on the 7-item conflict scale of the Adult–Child Relationship Scale (Pianta, Reference Pianta2001; α = 0.85).
Measures of academic competence
Children were administered the Woodcock–Johnson Psychoeducational Battery (Woodcock & Johnson, Reference Woodcock and Johnson1989, Reference Woodcock and Johnson1990) during laboratory visits at fifth grade. The achievement score was the composite of four subtests: letter–word identification, passage comprehension, calculation, and applied problems. Because this measure is known to be quite stable and was available at fifth rather than sixth grade, it was deemed appropriate to include as an outcome measure.
Teachers also rated children's academic achievement in sixth grade. The composite rating of children's current school performance was based on accomplishments in six subjects (reading, oral language, written language, math, social studies, and science) that were rated on a 5-point scale (1 = very poor to 5 = very good; six items, α = 0.95). Six items, rated on the same 5-point scale, were used to assess work habits (e.g., follows classroom procedures, works independently, α = 0.96).
Child self-reports of adjustment and relationships
Children completed three self-report measures at the sixth grade visit assessing relationships with mothers and friends as well as risk-taking behavior. The Friendship Quality Questionnaire (Parker & Asher, Reference Parker and Asher1993), a 28-item scale, assesses children's views of their relationship with their best friend. Items are rated on a 5-point scale (1 = not at all true to 5 = really true). Twenty items make up the total friendship quality score (α = 0.87) with higher scores reflecting a more positive (validation, companionship, disclosure) and less negative (conflict) relationship. Children were also asked how often they and their friends engaged in a number of moderately to highly risky behaviors (e.g., skipped school, gotten into a gang fight, smoked cigarettes, stolen something worth a lot), using a measure derived from the Fast Track project (Kaplow, Curran, Dodge, & The Conduct Problems Prevention Research Group, Reference Kaplow, Curran and Dodge2002). Total risk taking scores for self (α = 0.73) and friend (α = 0.82) were moderately correlated (r = .72). Scores were composited because we reasoned that study children might more easily acknowledge that their friends engaged in risky behaviors than admit that they themselves did. Finally, children reported on their perceptions of maternal hostility. Children rated the frequency of negative interaction (eight items rated 1 = not at all to 4 = a lot; α = 0.75). For example, items assessed perceptions of maternal anger, yelling, and criticism.
Results
Overview of data analysis
First trajectories of physical aggression were described separately for boys and girls. We next used multinomial logistic regression to examine whether theoretically meaningful precursors predicted trajectory group membership. Two sets of models were fit separately for boys and girls. The first included the social risk index and two proximal child factors (early language and delay of gratification); the second included social risk and the two maternal parenting measures (observed sensitivity and mother-reported harsh control). When significant associations between early childhood predictors and trajectory group membership were detected, pairwise comparisons were conducted to identify which trajectory groups differed on that predictor. Effect sizes were computed as odds ratios. A value greater than 1 implies that that predictor is more strongly related to the first group and a value less than 1 implies that it is more strongly related to the second group. In the final set of analyses, trajectory group membership served as the independent variable in analyses of covariance that compared trajectory groups on maternal, teacher, and child reports of adjustment outcomes at sixth grade and a direct assessment of academic achievement at fifth grade, controlling for sociodemographic risk. Pairwise comparisons were conducted when significant differences emerged in the overall comparison of the trajectory groups and effect sizes were computed as the difference between the means divided by the standard deviation under the model (i.e., the root mean squared error). The Benjamini–Hochberg (Reference Benjamini and Hochberg1995) technique was used to adjust for multiple tests, keeping the nominal α at 0.05.
Missing data
We estimated the aggression trajectories using only observed data, including cases with at least two teacher ratings (Nagin, Reference Nagin2005), but we conducted multiple imputations using all individuals included in the trajectory analyses for subsequent analyses on predictors and outcomes. Thus, the sample sizes for all analyses were constant. Thus, for the semiparametric group-based models, full information maximum likelihood was used, thereby including every case with at least two teacher ratings (Schafer & Graham, Reference Schafer and Graham2002). For the analyses involving groups, multiple imputation using PROC MI in SAS v9.1 was used. There were 20 imputations and all parameters were collapsed across the data sets in accordance with Rubin (Reference Rubin1987, Reference Rubin1996). Both of these approaches to missing data are considered to be state of the art for use with the respective types of models (Schafer & Graham, Reference Schafer and Graham2002).
Trajectories of physical aggression
Nagin's (1999, 2005) semiparametric, group-based modeling was used to describe boys' and girls' trajectories of physical aggression separately based on teacher ratings from Grades 1 through 6. As noted, children with at least two out of a possible six teacher ratings were included through the use of full information maximum likelihood estimations (Jones, Nagin, & Roeder, Reference Jones, Nagin and Roeder2001; Schafer & Graham, Reference Schafer and Graham2002). Teacher ratings were available at least four out of six times for 89% of the analysis sample; only 4% of the sample had ratings only twice.
The analytic model assumes that the population of children is composed of distinct groups of individuals who show different developmental trajectories and individuals within each group are homogeneous in terms of their developmental patterns of aggression relative to those in other trajectory groups. Growth curves for each individual are estimated and then prototypic group curves are identified from these individual curves (Nagin, Reference Nagin1999, Reference Nagin2005). The degree to which each individual's growth curve resembles each of the group curves is estimated, and individuals are typically classified into clusters accordingly. Each analysis specifies a distribution for the dependent variable over time, a polynomial of order k (e.g., linear, quadratic), and the number of groups to be extracted. Recommended practice involves fitting a series of analyses specifying different numbers of groups and selecting the solution that accounts for the most information in the data as indicated by the Bayesian information criterion (BIC).
A zero-inflated Poisson distribution was used because the dependent variable could be viewed as a count of the number of aggressive problem behaviors, weighted by frequency of occurrence and there was an overdispersion of zero scores. A cubic growth curve model was specified to describe the pattern of change over time. As recommended by Nagin (Reference Nagin1999, Reference Nagin2005), we examined the BIC, the posterior probability score, and the trajectories themselves to decide which model best fit the data. It should be noted that semiparametric, group-based modeling, by forcing discrete group membership without allowing variability around those classifications, may compensate for the lack of variability by extracting more classes as noted in Bauer and Curran (Reference Bauer and Curran2003).
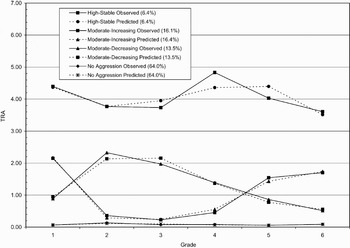
For teacher ratings of aggression in boys, the BIC score for the four-group model (−2821.23) was better than for the three-group model (−2872.51) or the five-group model (−2941.20). The mean posterior probability scores, indexing the degree to which each child fit his assigned trajectory, ranged from .87 to .96 for the four-group model, with a mean of .91, indicating that most boys fit their assigned trajectory well. Predicted and observed trajectories are depicted in Figure 1. Most boys (62.2%, n = 351) were assigned to the no-aggression group (posterior probability: mean = .95, median = .99, min = .40, max = .99); they received consistently low ratings of aggression across elementary school. Another 16.7% (n = 88) showed a moderate-decreasing pattern of aggression according to teacher ratings, reflected in moderate aggression at first grade that increased from first to second grade and then gradually declined from third through sixth grade (posterior probability: mean = .875, median = .96, min = .46, max = 1.00). In contrast, boys on the moderate-increasing aggression trajectory (14.5%, n = 74) were rated as moderately aggressive in first grade, with a decline at second grade, and then an increase to moderate aggression from fourth to sixth grade (posterior probability: mean = .87, median = .94, min = .44, max = 1.00). Finally, another 6.6% (35 boys) were assigned to the high-stable trajectory group, described by the highest and most stable level of aggression, with scores elevated above the other three trajectories at each assessment from first to sixth grade (posterior probability: mean = .95, median = .99, min = .59, max = 1.00).
Predicted and actual trajectory groups for males.

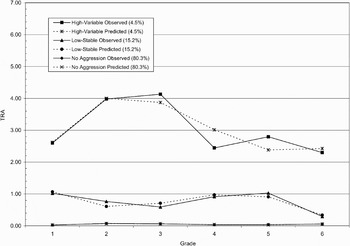
The trajectory analysis of girls' aggression ratings indicated that a three-group model best fit the data (BIC for two-group model = −1703.93; for three-group model = −1638.82; for four-group model = −1692.31), as displayed in Figure 2. Posterior probabilities for the three-group model were high (range = .91–.96, mean = .94). The vast majority of girls (428 or 78%) were seen by teachers as not at all aggressive (no aggression; posterior probability: mean = .96, median = .996, min = .516, max = .997). Another 81 girls or 17.3% showed a low-stable level of aggression (posterior probability: mean = .91, median = .97, min = .50, max = 1.00). Finally, a small group of girls (n = 24; 4.7%) showed a high-variable pattern of aggressive behavior that rose somewhat from first grade to third grade and then declined slightly, still remaining quite elevated relative to peers (posterior probability: mean = .956, median = .99, min = .53, max = 1.00).
Predicted and actual trajectory groups for females.

Earlier predictors of aggression trajectories
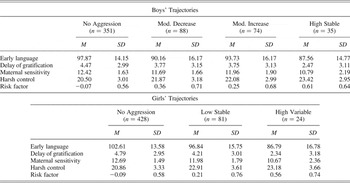
Multinomial logistic regression analyses were used to examine predictors of aggression trajectories. Two sets of analyses were conducted. The first set considered only the risk index and proximal child characteristics (early language and delay of gratification). Trajectory group membership was predicted by the social risk index, but neither early language nor delay of gratification was a significant predictor. For both boys (Wald χ2 = 3.34, p = .001) and girls (Wald χ2 = 2.11, p = .035) greater social risk was associated with higher teacher ratings of aggression. Boys who experienced higher levels of social risk in early childhood were more likely to be in the high (odds ratio [OR] = 4.13, 95% confidence interval [CI] = 2.15–7.93, p < .000), moderate-increasing (OR = 2.44, 95% CI = 1.60–3.73, p < .000), and moderate-decreasing (OR = 2.11, 95% CI = 1.35–3.30, p = .001) groups relative to the no-aggression group. Similarly, girls who experienced higher levels of social risk were more likely to be in the high-variable (OR = 2.12, 95% CI = 1.05–4.27, p = .037) or low-stable (OR = 1.66, 95% CI = 1.09–2.53, p = .017) aggression group relative to the no-aggression group. Descriptive statistics on predictor variables by sex and trajectory group are summarized in Table 1.
Descriptive statistics on predictor variables by sex and trajectory group

Note: Early language was assessed at 36 and 54 months; delay of gratification and harsh control were assessed at 54 months; maternal sensitivity was observed at 6, 15, 24, 36, and 54 months. Risk factor scores were based on a categorical confirmatory factor analysis that included maternal education at 1 month; child ethnicity; and income and partner status assessed at 1, 6, 15, 24, 36, and 54 months.
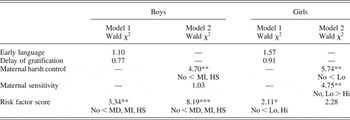
The second model included the social risk index and the two proximal parenting measures, observed maternal sensitivity from 6 to 54 months and maternal reports of harsh control at 54 months (Table 2). Over and above social risk, higher levels of harsh control (Wald χ2 = 4.70, p = .003) differentially predicted boys' membership in trajectory groups. Boys whose mothers reported using more harsh control at 54 months were more likely to be in either the high-stable (OR = 1.23, 95% CI = 1.06–1.44, p = .01) or moderate-increasing (OR = 1.15, 95% CI = 1.04–1.26, p = .01) trajectory groups, relative to the no-aggression group. Maternal sensitivity did not add to the prediction of trajectory group membership.
Multinomial regressions predicting trajectory group membership from earlier measures separately by gender

Note: Model 1 includes early language, delay of gratification, and risk index; Model 2 includes maternal harsh control, maternal sensitivity, and risk index. Results from pairwise comparisons are shown under chi-square values. For boys, No, no aggression trajectory group (n = 351); MI, moderate increasing (n = 74); HS, high stable (n = 35); MD, moderate decreasing (n = 88). For girls, No, no aggression trajectory group (n = 428); Lo, low stable (n = 81); Hi, high variable (n = 24).
*p < .05. **p < .01. ***p < .001.
In contrast, both maternal sensitivity (Wald χ2 = 4.75, p = .009) and harsh control (Wald χ2 = 5.74, p = .003) differentially predicted trajectory group membership for girls, whereas social risk was not a significant predictor with early maternal parenting measures in the model. Specifically, girls whose mothers were relatively lower in sensitivity were more likely to be in the high-variable trajectory group relative to either the low-stable (OR = 0.73, 95% CI = 0.55–0.97, p = .031) or no-aggression (OR = 0.67, 95% CI = 0.52–0.87, p = .002) trajectories. In addition, higher harsh control predicted membership in the low-stable relative to the no-aggression trajectory group (OR = 1.15, CI = 1.06–1.26, p = .001).
Outcomes of trajectory group membership at sixth grade
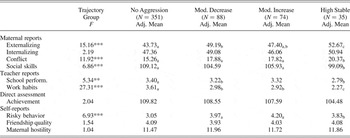
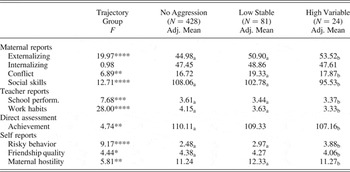
The final set of analyses focused on sixth grade outcomes. Analyses of variance, using social risk as the covariate and trajectory group as the independent variable, were conducted. Outcome measures were collected in sixth grade, except for academic achievement, which was assessed in fifth grade. Overall group comparisons and adjusted means that show the results of pairwise differences are presented in Table 3 for boys and Table 4 for girls. The outcomes included maternal reports of externalizing problems, internalizing problems, mother–child conflict, and social skills; teacher reports of overall school performance and school work habits; Woodcock–Johnson academic achievement scores; and child reports of friendship quality, engagement in risky behavior, and maternal hostility.
Comparison of sixth grade outcomes by trajectory group for boys adjusting for social risk

Note: Analysis of covariance with social risk as covariate. The Benjamini–Hochberg adjusted p values were used to determine significance. Means with different subscripts are statistically different (p < .05).
**p < .01. ***p < .001.
Comparison of sixth grade outcomes by trajectory group for girls adjusting for social risk

Note: Analysis of covariance with social risk as covariate. The Benjamini–Hochberg adjusted p values were used to determine significance. Means with different subscripts are statistically different (p < .05).
*p < .05. **p < .01. ***p < .001. ****p < .0001.
Boys
Trajectory group main effects
Controlling for sociodemographic risk, the trajectory groups differed significantly on six of 10 outcome measures: maternal reports of externalizing problems, F (3, 543) = 15.16, p < .001, social skills, F (3, 543) = 6.86, p < .001, and mother–child conflict, F (3, 543) = 11.92, p < .001; child reports of risky behavior, F (3, 543) = 6.93, p < .001; and teacher reports of overall school performance, F (3, 543) = 5.34, p = .001, and work habits, F (3, 543) = 27.31, p < .001. Boys in the four trajectory groups did not differ significantly on maternal ratings of internalizing problems, F (3, 543) = 2.19, p = .09, on the Woodcock–Johnson, F (3, 543) = 2.04, p = .11, or on self-reports of friendship quality, F (3, 543) = 1.54, ns, or maternal hostility, F (3, 543) = 1.04, ns. In general, as would be expected, the no-aggression group showed the fewest problems and the best social skills relative to the other trajectory groups. Boys in the two moderate aggression trajectory groups did not differ from one another on any outcome measure, despite their different patterns of aggression over time, and they showed fewer differences from the no-aggression group than expected. Specific pairwise comparisons are discussed below with effect sizes included when differences are statistically significant.
High-stable versus moderate-decreasing and moderate-increasing aggression trajectories
Boys in the high-stable aggression trajectory group were rated as showing more externalizing problems than those in the moderate-decreasing (d = 0.35) and moderate-increasing (d = 0.54) trajectory groups. Mothers also indicated that they had more conflict-laden relationships with boys in the high-stable trajectory group than with boys in either the moderate-decreasing (d = 0.41) or moderate-increasing (d = 0.42) aggression groups. Finally, mothers rated boys in the high-stable group as significantly less socially skilled than boys in the moderate-increasing group (d = 0.46). Teachers likewise rated boys in the high-stable trajectory group as showing poorer work habits than boys in either the moderate-decreasing (d = 0.62) or moderate-increasing trajectory (d = 0.57) groups. Boys in the two moderate aggression groups, however, reported that they and their peers engaged in more risk-taking behavior than did boys in the high-stable trajectory group (d = 0.06 for moderate-decreasing; d = 0.15 for moderate-increasing), albeit with small effect sizes.
Moderate-increasing versus no-aggression trajectories
Boys in the moderate-increasing aggression trajectory group differed significantly from boys in the no-aggression group on only one outcome: teachers rated boys showing increasing aggression as having poorer work habits in school than their nonaggressive peers (d = 0.61).
Moderate-decreasing versus no-aggression trajectories
Boys showing decreasing aggression differed from the boys in the no-aggression group on three adult report measures. They received higher ratings from their mothers on externalizing problems (d = 0.55), and teachers rated them as performing more poorly in school (d = 0.18) and as having poorer work habits (d = 0.56).
High-stable versus no-aggression trajectories
Not surprisingly, mothers rated boys in the high-stable group as showing significantly higher levels of externalizing problems (d = 0.91) and poorer social skills (d = 0.67), and as engaging in more mother–child conflict (d = 0.84) than boys showing no aggression. Teachers also rated boys in the high-stable aggression group as poorer in overall school performance (d = 0.63) and work habits (d = 1.18) in comparison to boys in the no-aggression trajectory group.
Girls
Trajectory group main effects
Trajectory group differences were evident across 9 of the 10 outcome measures: maternal reports of externalizing problems, F (2, 529) = 19.97, p < .001, mother–child conflict, F (2, 529) = 6.89, p < .001, and social skills, F (2, 529) = 12.71, p < .001; teacher reports of overall school performance, F (2, 529) = 7.68, p < .001, and work habits, F (2, 529) = 28.00, p < .001; child reports of maternal hostility, F (2, 529) = 5.81, p < .01, risky behavior, F (2, 529) = 9.17, p < .001, and friendship quality, F (2, 529) = 4.44, p = .012; and tested achievement on the Woodcock–Johnson assessment, F (2, 529) = 4.74, p < .01. Only maternal reports of internalizing problems did not show a significant group main effect.
High-variable aggression versus low-stable aggression trajectories
Seven variables differentiated between the two groups of girls showing relatively higher levels of aggression. Girls in the high-variable aggression group were rated by their mothers as having more externalizing problems (d = 0.25) and poorer social skills (d = 0.43) than were girls showing low-stable aggression. Teachers also rated girls in the high-variable aggression group as poorer in both overall school performance (d = 0.08) and work habits (d = 0.31) than their low-stable counterparts. Girls in the high-variable aggression group also reported engaging in more risk-taking behavior with their peers (d = 0.44). However, girls exhibiting low-stable levels of aggression were rated by their mothers as engaging in more conflict with them (d = 0.40), and the girls likewise perceived their mothers as more angry and hostile (d = 0.39) in comparison to girls in the high-variable aggression group.
Low-stable aggression versus no-aggression trajectories
Girls showing low-stable aggression did not differ from their no-aggression counterparts on any outcome measures.
High-variable aggression versus no-aggression trajectories
As would be expected, girls in the high-variable aggression trajectory group were rated by their mothers as showing more externalizing problems (d = 0.81) and poorer social skills (d = 0.74) than no-aggression girls. The high-variable aggression girls also reported engaging in more risky behavior (d = 0.69) and having poorer quality friendships (d = 0.61) than their no aggression counterparts. They were also rated by their teachers as showing poorer overall school performance (d = 0.26) and work habits (d = 0.85); this was confirmed by their poorer performance on the Woodcock–Johnson achievement measure (d = 0.21).
Discussion
We examined trajectories of physical aggression as rated by teachers from first to sixth grade separately by child sex in a large, although not nationally representative sample of children from across the United States. We also examined a small set of antecedents of the trajectories and their developmental sequelae. The observed patterns of change in aggression over time were broadly consistent with those identified by Broidy et al. (Reference Broidy, Nagin, Tremblay, Bates, Brame and Dodge2003) in their multistudy analysis. New empirical ground was broken, however, in two ways: by our consideration of child characteristics and parenting as antecedents of trajectory group membership and by our assessment of a broad range of child outcome measures in early adolescence. The former was accomplished by including measures of early language development and delay of gratification in the preschool period that are likely precursors of aggression. In terms of maternal parenting measures, in addition to the assessment of harsh and coercive parenting (e.g., Patterson et al., Reference Patterson, Forgatch, Yoerger and Stoolmiller1998; Snyder et al., Reference Snyder, Reid, Patterson, Lahey, Moffitt and Caspi2003), we included a measure of positive supportive parenting derived from observations of maternal sensitivity across infancy and early childhood. Further, a range of adjustment outcomes in sixth grade, obtained from different sources, including tested academic achievement, parent- and teacher-reported social adjustment, and child-reported friendship quality were examined, thereby moving beyond the antisocial and delinquent outcomes emphasized in most prior studies of aggression trajectories.
Trajectories of aggression
Using a six-item aggression scale derived from the TRF to model trajectories of aggression, we identified four trajectories in boys and three in girls. The data show good convergence with the patterns of aggression described by Broidy et al. (Reference Broidy, Nagin, Tremblay, Bates, Brame and Dodge2003), who reported on six samples of boys rated by teachers on aggression scales composed of from two to five items. Boys in these samples ranged in age from 6 to 15, and they varied in their degree of demographic risk as well as their country of origin (United States, Canada, New Zealand). The majority of boys in the Broidy et al. (Reference Broidy, Nagin, Tremblay, Bates, Brame and Dodge2003) analyses showed low levels of aggression whereas from 4% to 10% showed high levels of aggression that were either relatively stable or slightly increasing. Likewise, we found that 62% of the boys in NICHD Study sample were consistently very low in aggression and 6.6% were stably high. The boys studied by Broidy et al. (Reference Broidy, Nagin, Tremblay, Bates, Brame and Dodge2003) varied in whether one or two intermediate groups were identified. Like the two Quebec samples, four trajectories that included two moderately aggressive groups emerged in the current inquiry, but unlike those described by Broidy et al. (Reference Broidy, Nagin, Tremblay, Bates, Brame and Dodge2003), who identified primarily decreasing trajectories, both moderate increasing and moderate decreasing aggression trajectories emerged in this study. Differences in measurement and sample composition likely account for these slight discrepancies in the results across investigations. Similarities clearly outweigh differences between trajectory patterns detected here and in the Broidy et al. (Reference Broidy, Nagin, Tremblay, Bates, Brame and Dodge2003) multistudy analysis.
The three trajectories of physical aggression we identified in girls also converge with patterns of aggression described by Broidy et al. (Reference Broidy, Nagin, Tremblay, Bates, Brame and Dodge2003). Most girls in the NICHD SECC sample were very low in aggression (78%); 17% of the girls showed a somewhat stable level of low aggression, a pattern similar to one identified in three of the four female samples studied by Broidy et al. (Reference Broidy, Nagin, Tremblay, Bates, Brame and Dodge2003). Finally, a small proportion (4.7%), while elevated relative to the other girls in the sample, was still generally lower in aggression overall than boys. These girls, however, showed a variable pattern of aggression that appeared to peak at Grades 2 and 3 and then decline somewhat, while still remaining elevated relative to same-sex peers. Taken together, these results, when considered along with those of others, indicate that most children do not show elevated aggression, but that both high and low to moderate levels can be identified in both boys and girls. Further, higher proportions of girls show low to no aggression, and even the most aggressive girls have generally lower scores than the most aggressive boys.
Predictors of aggression trajectories
Although research indicates that trajectories of aggression are predicted by high levels of family adversity (Joussemet et al., Reference Joussemet, Vitaro, Barker, Côté, Nagin and Zoccolillo2008; Nagin & Tremblay, Reference Nagin and Tremblay2001; NICHD ECCRN, 2004; Shaw et al., Reference Shaw, Gilliom, Ingoldsby and Nagin2003), to our knowledge, this is the first study to examine both early child characteristics and maternal parenting as predictors of aggression trajectories identified from teacher reports, and also to examine these separately by child sex. Although we hypothesized, and found, that greater sociodemographic risk was associated with higher levels of aggression, our primary interest was in more proximal child characteristics that might predict poorer control of aggression in school and in aspects of maternal parenting that might also be associated with lower self-regulation and more problems controlling aggression at school. Recall that tests of these hypotheses were conducted after accounting for effects of sociodemographic risk.
Contrary to expectation, early child language skills at 36 and 54 months and delay of gratification at 54 months did not predict membership in higher aggression trajectory groups in either boys or girls. This null finding was surprising, especially for boys, as the combination of poorer self-regulation and language development have been posited to account for the higher levels of aggression observed in boys relative to girls at preschool age (Hay, Reference Hay2007) and have been implicated in the emergence of stable aggression in other theoretical models of aggression and antisocial behavior (Moffitt, Reference Moffitt1993). One possible explanation for these null findings is that these measures of language ability and self-regulation may prove to be better predictors of later academic achievement and impulse control and not specifically predictors of high levels of physical aggression. Alternatively, the explanatory power potentially attributable to these factors could have been accounted for by the sociodemographic risk variables that functioned as covariates in the analyses.
In both sexes, harsh control by mothers at 54 months predicted later teacher ratings of higher and more stable aggression in elementary school. Although this finding is consistent with the work of Patterson and colleagues (e.g., Patterson et al., Reference Patterson, Forgatch, Yoerger and Stoolmiller1998; Snyder et al., Reference Snyder, Reid, Patterson, Lahey, Moffitt and Caspi2003) linking coercive control to later aggression and externalizing problems, to our knowledge this is among the first studies to link early harsh control with later trajectories of aggression as assessed by teachers, providing a confirmation of this link over time and across settings and informants. Joussemet et al. (Reference Joussemet, Vitaro, Barker, Côté, Nagin and Zoccolillo2008) recently reported that controlling parenting predicted higher aggression in a sample of children in Quebec, although differential effects by child sex could not be determined. In the current analyses, maternal harsh control was a significant precursor of aggression trajectory for both boys and girls, with sociodemographic risk controlled, underscoring the robustness of this association. Mothers who endorsed more harsh and strict disciplinary practices, including approval of physical punishment and expectations for immediate compliance at 54 months, had children who teachers rated as elevated in aggression across middle childhood. Most studies linking coercive parenting during the preschool period to concurrent and later disruptive behavior have focused on boys (e.g., Belsky, Woodworth, & Crnic, Reference Belsky, Woodworth and Crnic1996; Campbell, Pierce, Moore, Marakovitz, & Newby, Reference Campbell, Pierce, Moore, Marakovitz and Newby1996; Shaw et al., Reference Shaw, Winslow, Owens, Vondra, Cohn and Bell1998). The association between early harsh maternal control and low, but stable and nonnormative, physical aggression in girls across the elementary school years has implications for understanding social development in girls.
These findings on maternal harsh control are consistent with the argument that some young boys and girls may model their parents' use of physically coercive behaviors in their interactions with peers and teachers. An alternative interpretation is that mothers use more harsh control with more aggressive and coercive children who also show these behaviors in school. Among other possibilities, the negative quality of the mother–child interaction may breed anger and resentment that is expressed in interactions outside the home or children who rely on external controls from power assertive adults may not learn to use internalized regulatory strategies in the school setting (Joussemet et al., Reference Joussemet, Vitaro, Barker, Côté, Nagin and Zoccolillo2008; Kochanska, Reference Kochanska2002). These formulations all suggest the importance of modeling and other social learning and emotional development mechanisms that may play a role in the transmission of negative affect and angry engagement with teachers and peers (Chang, Schwartz, Dodge, & McBride-Chang, Reference Chang, Schwartz, Dodge and McBride-Chang2003; Lynch et al., Reference Lynch, Turkheimer, D'Onofrio, Mendle, Emery and Slutske2006; Morris, Silk, Steinberg, Myers, & Robinson, Reference Morris, Silk, Steinberg, Myers and Robinson2007). Not to be discounted, of course, is the prospect that genetic factors may be operative also. In the context of early harsh control, it is interesting that girls in the low-aggression trajectory group also perceived their mothers as more hostile when they were in sixth grade relative to girls who showed high-variable aggression, and their mothers likewise rated them as engaging in more mother–child conflict, suggesting that long-standing mother–child conflict may play a role in the emergence and stability of low, but nonnormative, physical aggression in girls. This underscores the salient role the mother–child relationship may play in the emergence and stability of aggression in school-age girls.
For girls, the quality of the mother–child relationship as reflected in maternal sensitive responding from 6 to 54 months also predicted trajectory group membership above and beyond both sociodemographic risk and harsh control. When mothers were low in sensitivity, their daughters were more likely to display high-variable aggression in school, suggesting the importance of positive maternal engagement for girls. This finding is not surprising, given the importance of the quality of the mother–child relationship for children's adjustment (e.g., Kochanska, Reference Kochanska2002; Thompson, Reference Thompson and Eisenberg1998). It is surprising, however, that the effect of maternal sensitivity emerged for girls, but not for boys, as other data suggest that boys may be especially vulnerable to the effects of insensitive parenting (McFadyen-Ketchum et al., Reference McFadyen-Ketchum, Bates, Dodge and Pettit1996). This link between lower maternal sensitivity and higher aggression in girls is consistent with attachment theory, in that the quality of the earlier mother–child relationship is deemed important for the development of children's self-regulatory skills and control of negative affect (Thompson, Reference Thompson and Eisenberg1998). We are at a loss, however, to explain why this effect was found for girls, but not for boys.
Outcomes of trajectory groups in early adolescence
Fundamental to a developmental analysis of different longitudinal patterns of aggression, and complementing inquiry into their potential determinants, is the issue of their developmental sequelae. Do these trajectories matter for adjustment? With the exception of the earlier report on this sample focused on maternal rather than teacher reports of aggression, prior research on aggression trajectories has emphasized almost exclusively links between high levels of chronic aggression and later delinquent behavior. The focus in the present report was thus purposefully on a broader range of adjustment outcomes at sixth grade. In addition, in the prior work on this sample, trajectories and outcomes were examined with boys and girls combined (Campbell et al., Reference Campbell, Spieker, Burchinal and Poe2006). The earlier work indicated that mothers' reports of low, moderate, and high levels of persistent aggression predicted poorer school adjustment in sixth grade. For example, low but stable aggression predicted more self-reported peer problems and sad mood, whereas moderate and high stable aggression predicted more externalizing problems as rated by teachers (Campbell et al., Reference Campbell, Spieker, Burchinal and Poe2006).
The current analyses support and extend these earlier findings. Of particular importance, even low to moderate levels of teacher-rated aggression proved to be associated with a few adjustment difficulties. In general, however, as expected, both boys and girls on the highest aggression trajectory differed from their same sex counterparts on the no-aggression trajectory in the expected direction on several maternal and teacher report measures, including externalizing problems, social skills, work habits, and overall school performance. Maternal reports of internalizing problems did not differentiate among trajectory groups, although we had raised the possibility that more aggressive girls would evidence some signs of internalizing problems. However, internalizing problems may be overlooked by adults who are often more aware of externalizing difficulties or they may appear later in development, well after the transition to adolescence.
Girls on the high-variable aggression trajectory, however, did acknowledge engaging in more risky behavior and reported lower quality friendships than their no-aggression counterparts, suggesting that girls showing a relatively higher level of aggression are at risk for a range of negative outcomes across settings and relationships. These results contrast with the more equivocal findings of Broidy et al. (Reference Broidy, Nagin, Tremblay, Bates, Brame and Dodge2003) pertaining to delinquent behavior, but are consistent with those from the Dunedin and Christchurch studies suggesting that adolescent girls who show nonnormative levels of aggression are likely to continue to have social and educational difficulties later on. In particular, concerns about substance use, early promiscuous sexuality, and potentially early pregnancy and childbearing merit attention, as aggressive girls are at greater risk for these outcomes (Bardone, Moffitt, Caspi, Dickson, & Silva, Reference Bardone, Moffitt, Caspi, Dickson and Silva1996; Miller-Johnson et al., Reference Miller-Johnson, Winn, Coie, Maumary-Gremaud, Hyman and Terry1999; Serbin, Peters, McAffer, & Schwartzman, Reference Serbin, Peters, McAffer and Schwartzman1991; Underwood, Kupersmidt, & Coie, Reference Underwood, Kupersmidt and Coie1996; Woodward & Fergusson, Reference Woodward and Fergusson1999). Perhaps of note in this regard is recent evidence from the NICHD Study indicating that early harsh maternal control predicts earlier age of menarche and, thereby, greater sexual and other risk taking at age 15 (Belsky, Steinberg, Houts, Halpern-Felsher, & The NICHD Early Child Care Research Network, in press), findings in accord with Belsky, Steinberg and Draper's (Reference Belsky, Steinberg and Draper1991) evolutionary theory of socialization.
Lower perceived friendship quality during the transition to adolescence may be an especially important indicator of adjustment problems in girls, given the importance of close same-sex friendships for girls at this age (Maccoby, Reference Maccoby1998); this particular finding is also intriguing in view of the fact that lower maternal sensitivity, potentially another indicator of relationship quality, predicted being in this high-variable trajectory group. Further research will be needed to clarify links among early experiences with parents and later friendship quality in the context of aggression, which in girls at the transition to adolescence is likely to consist not only of some physical aggression, but also relational aggression (Crick & Zahn-Waxler, Reference Crick and Zahn-Waxler2003; Murray-Close et al., Reference Murray-Close, Ostrov and Crick2007). In contrast, however, it is noteworthy that mother–child conflict as perceived by both mothers and the girls themselves was not elevated in this group relative to no-aggression girls, possibly providing some degree of protection from more serious problems in middle adolescence.
Although girls in the low-stable aggression group did not differ from the no-aggression girls, it is noteworthy that they and their mothers acknowledged more mother–child conflict relative to the high-variable aggression girls, suggesting that these girls also may be at risk for additional adjustment difficulties later on as they move through adolescence. Alternatively, given adequate school performance and social skills, these girls may fare well as they become more independent from family and more invested in peers. Boys in the moderate-decreasing and increasing aggression trajectory groups appear to be showing some school adjustment problems, as reflected in poor work habits in school, and they report engaging with peers in more risky behavior than boys in the highest aggression group. Taken together, these subtle indicators of problem behavior in the moderately aggressive boys may become more salient as they move through puberty and the temptations of the peer group become more difficult to resist; alternatively, these may prove to be of limited predictive validity, given the apparently positive relationships these boys have with mothers and with peers.
However, even if these youngsters are not showing high levels of problem behavior or school failure at sixth grade, it is likely that some of them will manifest more social problems by middle adolescence in contrast to children who were not at all aggressive. For example, at least a few of these low to moderately aggressive youngsters may seek out a more antisocial peer group and/or evidence lower academic achievement as they move through middle school to high school. The poorer work habits and higher levels of risky behavior of the moderately aggressive boys and low aggressive girls especially bear watching. It will be important to follow this sample into adolescence and adulthood, given the intriguing findings from the Dunedin study of male and female antisocial trajectories to age 32 in adulthood. Odgers et al. (Reference Odgers, Moffitt, Broadbent, Dickson, Hancox and Harrington2008) reported adverse adjustment in adulthood for males, but not females with childhood limited antisocial behavior, and for both males and females with adolescent onset anti-social behavior. Boys on the two moderate trajectories and girls on the low-stable trajectory may continue on a relatively elevated trajectory or even show an increase in aggression by middle adolescence.
In summary, the results of this inquiry suggest that qualities of the mother–child relationship predict longitudinal patterns of aggressive behavior in boys and girls as assessed by teachers in school. Moreover, these aggression trajectories have implications for children's social functioning at home, at school, and in the peer group at sixth grade, as well as their academic achievement. Data from the current study also highlight the importance of even moderate to low levels of stable or variable aggression in elementary school as possibly forecasting adjustment difficulties in early adolescence, thereby suggesting that school personnel and guidance counsellors should pay serious attention to children who as early as first or second grade are showing somewhat elevated levels of physically aggressive behavior. Preventive interventions at home and school could potentially be warranted, even in such obviously nonclinical cases.
Despite the use of a rich longitudinal data set, the direction of effects cannot be determined in these analyses, nor does this design permit the disentangling of genetic predispositions toward aggressive behavior in children and parents from influences that may emerge from coercive and insensitive parent–child interactions (Lynch et al., Reference Lynch, Turkheimer, D'Onofrio, Mendle, Emery and Slutske2006; Rutter, Reference Rutter, Lahey, Moffitt and Caspi2003; Snyder et al., Reference Snyder, Reid, Patterson, Lahey, Moffitt and Caspi2003). In fact, because observations did not focus on coercive processes per se, these can only be inferred from maternal and child reports of harshness, conflict, and hostility. Furthermore, we did not include data on fathers' parenting behaviors in these analyses, thereby overlooking an important aspect of socialization and family functioning. The use of teacher reports of aggressive behavior is both a strength of this study, in that teachers are independent informants in an important context, and a limitation, because teachers may be more likely to observe aggression in boys than in girls. Girls are more likely to use physical aggression in close relationships (Moffitt et al., 2001), with siblings (Martin & Ross, Reference Martin and Ross2005), and on the far side of the playground (Pepler & Craig, Reference Pepler and Craig1995), all situations that are not observable by teachers. Ideally, it would have been beneficial to have obtained peer reports of aggression. Interpersonal aggression by women and girls may be less salient than male aggression but have adverse consequences just the same (Hay, Reference Hay2007). Nevertheless, converging evidence across time, reporters, measures, and settings, coupled with long-standing developmental theory, adds credence to the conclusion that relationship quality is an important contributor to the emergence of problematic, albeit low levels of physical aggression in middle childhood. Future work will examine how well these trajectories predict adjustment outcomes in midadolescence, as well as whether some girls and boys showing low to moderate levels of aggression evidence escalating difficulties including drug use, sexual promiscuity, and school failure by age 15.