

But while the uses of liberty are many, liberty is one. Liberties appear only when liberty is lacking: they are the special privileges and exemptions that groups and individuals may acquire while the rest are more or less unfree. Historically, the path to liberty has led through the achievement of particular liberties . . . The difference between liberty and liberties is that which exists between a condition in which all is permitted that is not prohibited by general rules and one in which all is prohibited that is not explicitly permittedFootnote 1 (emphasis added).
F. A. Hayek – The Constitution of Liberty
I. Introduction
Political economists from Adam Smith to Vernon Smith have seen the human propensity to “truck, barter and exchange” as the prime mover of economic progress. They understood that a political-legal framework of private property and the rule of law channels this human propensity into wealth creation. Moreover, they also acknowledged that this framework requires a complementary “moral constitution,” which consists of norms, such as tolerance, mutual respect, and reciprocal regard.Footnote 2 Taken together, these formal and informal institutions,Footnote 3 and their enforcement, enable the transition from subsistence to exchange, corresponding with the explosion of economic growth experienced since the early nineteenth century. What “ignited” this virtuous cycle in trading and wealth creation?
In an effort to explain this virtuous cycle, we explore the relationship between liberties, liberty, and material progress. F. A. Hayek and Milton Friedman in The Road to Serfdom and Capitalism and Freedom, respectively, argued that the loss of economic freedom necessarily entails the loss of liberty. As Hayek concisely summarized this point, “[e]conomic control is not merely control of a sector of human life which can be separated from the rest; it is the control of the means for all our ends.”Footnote 4 And, Hayek added, “whoever has sole control of the means must also determine which ends are to be served, which values are to be rated higher and which lower, in short, what men should believe and strive for.”Footnote 5 Our argument explores this causal relationship in the opposite direction. We argue that expanding the scope of mutually beneficial exchange gives rise to the further accumulation of liberties. These liberties include the right to private property, freedom of contract, and freedom from legal discrimination. However, liberty itself is not directly reducible to its composite liberties. As a whole, liberty yields greater potential for economic progress than merely the sum of its composite liberties. Conversely, the absence of one of these liberties reduces the potential exercise of the others. For example, two individuals may have ownership over goods they wish to exchange, but if contractual exchange requires political sanction, the potential gains from trade will be limited. When liberty, rather than liberties, is fully realized, private property does not simply include the right of use and exchange, but must also include freedom from the use of political discretion to prevent mutually beneficial exchange. Liberty exists when no one is exempt from the right to private property and freedom of contract under the rule of law, regardless of race, sex, creed, or social status.
Under an institutional framework of liberty, individuals are free to engage in trade and innovation without express political permission. Without the rule of law, the rights to exchange property and engage in commercial activity exist as particular liberties dependent on political discretion. Historically, however, the cumulative and gradual accumulation of liberties by individuals within society has historically been the path to liberty. This historical path to liberty in turn eroded political privileges based on social status, race, or creed, allowing ever-greater numbers of individuals to participate in social cooperation under the division of labor. Expanding the scope of specialization under the division of labor is the source of generalized increasing returns, from which human progress emerges.
In making this argument, we are offering a slight twist on Adam Smith’s famous dictum that “The Division of Labour Is Limited by the Extent of the Market.”Footnote 6 Most reflections on Smith’s theorem follow economist George Stigler, who focuses on resolving the technical difficulties of incorporating Smith’s famous dictum into models of static equilibrium.Footnote 7 In such models, institutions are implicitly assumed to be fixed and given. The alternative interpretation of Smith’s theorem is focused on the process by which institutional change generates economic progress.Footnote 8 Following James Buchanan, our focus will be on the generalized increasing returns associated with adopting particular institutions of governance.
In this essay, we argue that human progress follows from the generalized increasing returns to commercial activity. These increasing returns follow from the gradual, cumulative process of institutionalizing the right to private property and freedom of contract under the rule of law. This path to liberty, and the generalized increasing returns that follow from it, generates a positive feedback loop. Through this feedback loop, additional norms emerge to reinforce the formal institutional framework of liberty. Once this cumulative process via generalized increasing returns reaches a critical tipping point, a “combustible combination” of Bourgeois commercial ideas, institutions, and commercial practices emerges. The emergence of this combustible combination in the early nineteenth century is what caused the explosive wealth creation and human flourishing that has taken place since then. The causal link between the path to liberty, as mentioned by Hayek above, and human progress that follows from it, is what Buchanan referred to as generalized increasing returns. This causal mechanism can be understood as follows:
Accumulation of Liberties → Institutionalization of Liberty →
Generalized Increasing Returns → Human Progress
Political economists, Buchanan argued, must stress the technical principles of economics that enable them to assess how alternative institutional arrangements either promote, or hinder, productive specialization and peaceful social cooperation among diverse peoples.Footnote 9 In fact, as Armen Alchian stressed, “this is what economics is all about — the discerning of the effects of alternative social arrangements or rules.”Footnote 10 To accomplish this, the political economist engages in two levels of analysis: the rule-level of analysis, and the analysis of economic interaction within the rules. The Stiglerian reading of Smith’s famous dictum makes sense when the analysis takes the institutional framework as given, and commercial activity is analyzed within a given set of rules. Buchanan’s reading draws our attention to how changes in that institutional framework itself have consequences for economic performance within a set of rules. In doing so, Buchanan provides additional analytical force to Hayek’s claim that institutions of law should be understood “as a kind of instrument of production.”Footnote 11 In short, any narrative of economic performance through time should recognize that there are both increasing returns to refinements in specialization within a set of rules, and generalized increasing returns of particular institutions, such as private property and freedom of contract, that give greater scope for productive specialization and social cooperation.
The accumulation of liberties is a precondition of human progress. Through the accumulation of liberties, an institutional framework of liberty is gradually established. When private property and the rule of law are secure, individuals are liberated from predation. As a result, individuals are freed from expending vast resources on protecting their persons and property, enabling a generalized extension of the limits of the market, and allowing wealth creation to take place. Increasing returns from productive specialization and social cooperation under a division of labor can then be realized. The liberation of man from poverty, servitude, and exploitation in such massive numbers, beginning in the early nineteenth century, cannot be explained without the presence of liberty. The institutional precondition of liberty supports the extension of the market, productive specialization, and wealth creation on a grand scale.
Understood another way, British jurist Sir Henry Maine referred to this process of accumulating liberties as “a movement from Status to Contract.”Footnote 12 This process entails a gradual evolution from an institutional framework of established privileges to one based on the rule of law. This institutional evolution yields generalized increasing returns by harnessing the creative talent and skills of individuals previously excluded from an extended market order. The cumulative process not only entails freedom from predation, but also freedom from prejudicial discrimination against productive commercial practices and tolerance of bourgeois values.Footnote 13 Of course, this evolution was “imperfect.” Predation by public and private parties was never completely eliminated, nor were discriminatory practices. However, predation, political privilege, and discrimination were curtailed enough that pursuing mutually beneficial exchange was unleashed to a greater extent than had previously been permitted. The accumulation of liberties contributed to the build-up of the institutional framework of liberty, reaching a critical threshold from which an explosion of human progress followed. In emphasizing this threshold, we hope to resolve the empirical timing puzzle that Deirdre McCloskeyFootnote 14 has raised about ideas, institutions, and economic performance. It is only when this cumulative threshold of liberties is met that human societies are able to experience the Great Enrichment.
This essay proceeds as follows. In Section II, we begin our inquiry by discussing the relationship between increasing returns and economic progress. Here we highlight the nonlinear nature of modern economic growth. In Section III, we discuss the relationship between the institutional framework and entrepreneurial activity. In Section IV, we discuss how entrepreneurial action under liberty gives rise to complementary social norms that facilitate social progress and reinforce an institutional framework of liberty. Section V explores the historical path to liberty as a consequence of the accumulation of liberties. The critical point that we want to stress in the essay is that once this critical threshold was met, productive entrepreneurial activity was unleashed, and wealth creation and human progress followed. Section VI concludes.
II. Economic Progress and Increasing Returns to Liberty
A. Economic progress: Allocation or exchange?
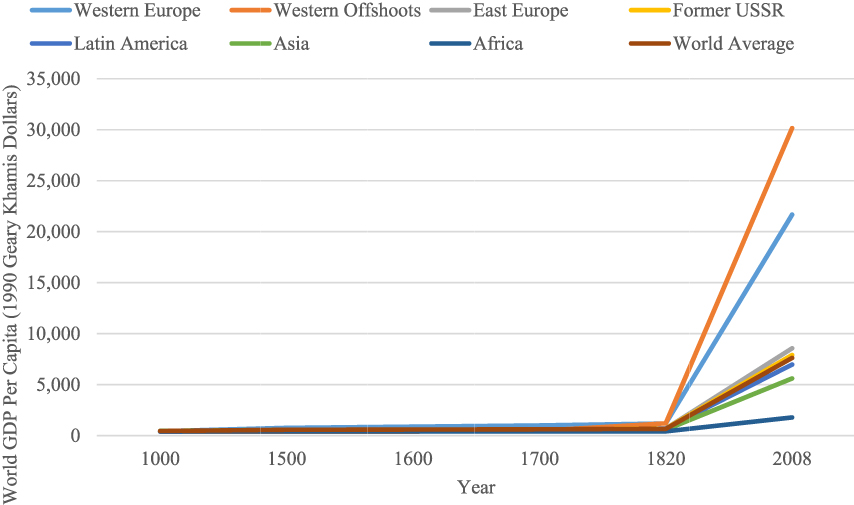
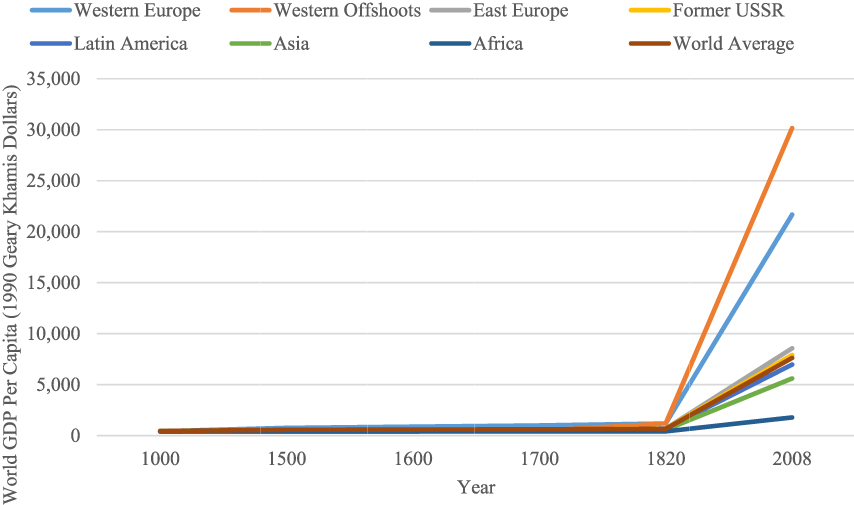
The central inquiry of political economy since at least Adam Smith has been to explain modern economic development. The transition of nations from poor and sick to healthy and wealthy is the “Great Fact” of human history, starting first in northwestern Europe and later spreading throughout the world. Illustrated by Figure 1, per-capita income, or the amount of income per individual in society, remained relatively unchanged until around 1800, after which real per-capita income rose monumentally by a factor of sixteen.Footnote 15 Although the overall picture has been one of increasing wealth and well-being, the distribution of wealth has by no means been uniform across the world.
World GDP Per Capita
Source: Angus Maddison, Statistics on World Population, GDP and Per Capita GDP, 1-2008 AD (Groningen, Netherlands: University of Groningen, 2008).
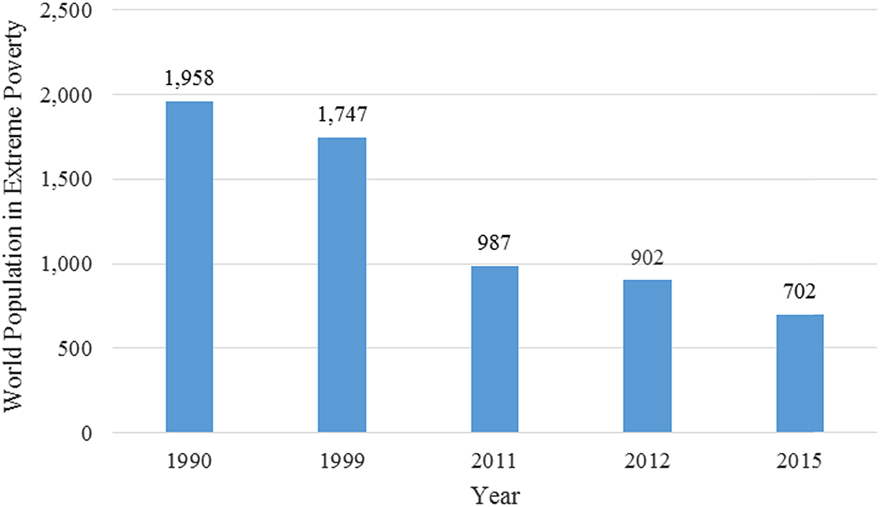
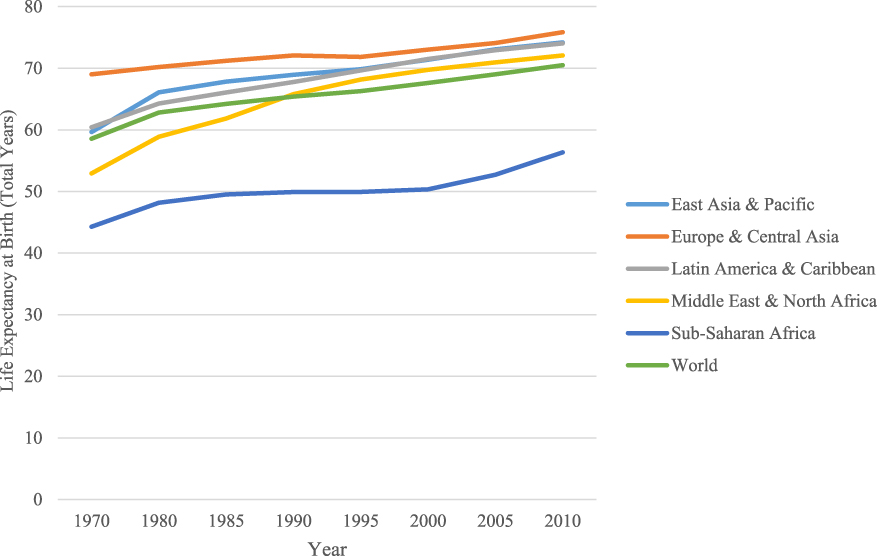
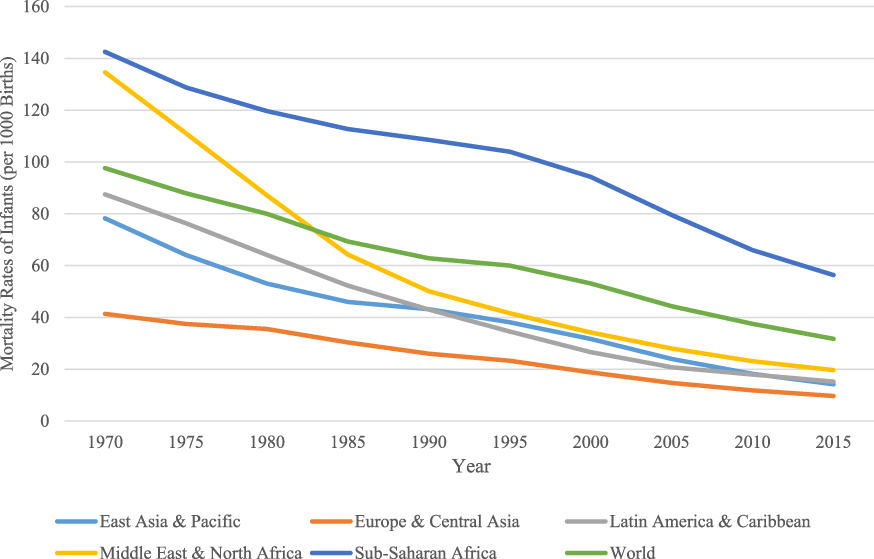
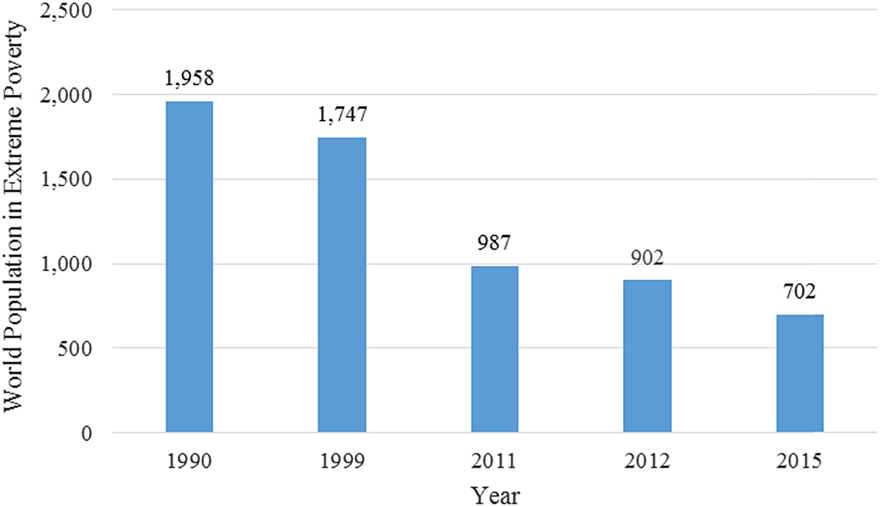
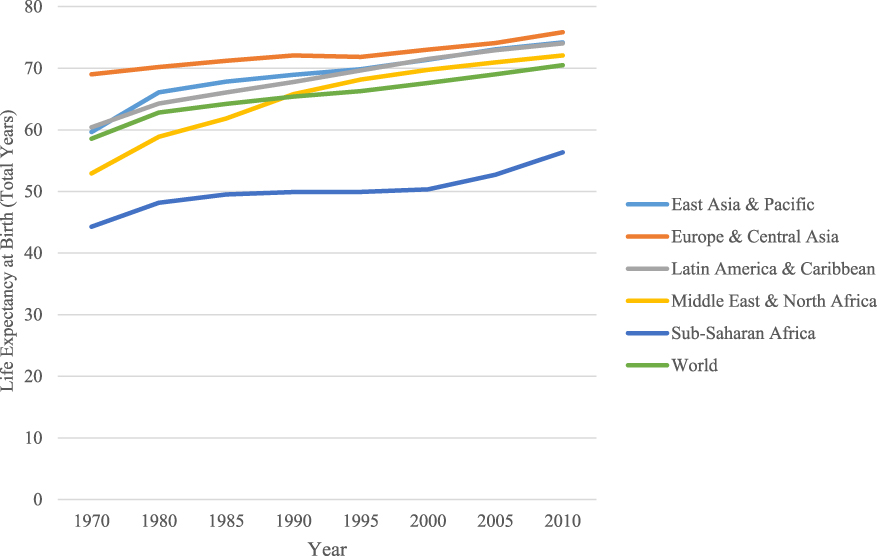
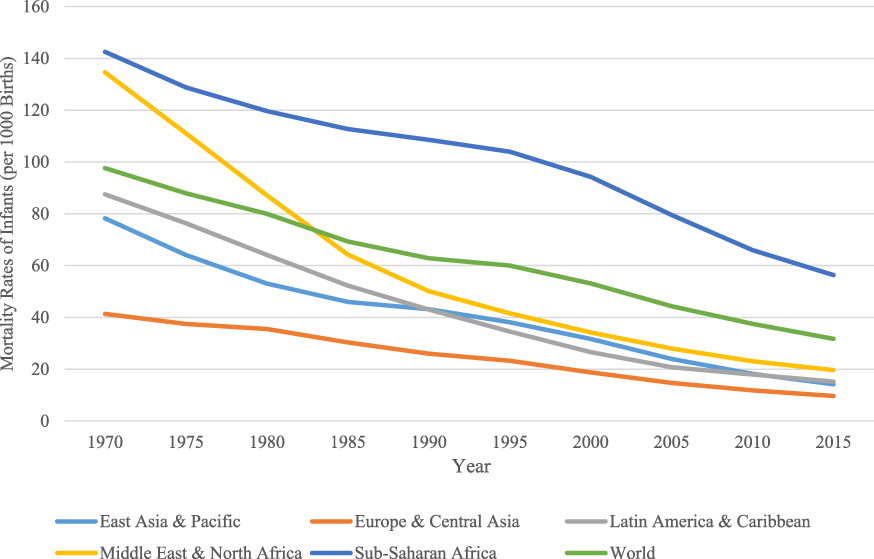
The most incredible fact in recent economic history is the rapid decline of extreme poverty throughout the developing world. According to Figure 2, the world’s population currently living on less than two dollars per day has fallen from roughly 2 billion people in 1990 to 700 million in 2015. This dramatic reduction in poverty has occurred in spite of an increase in the world’s population of about 2 billion during that same time. This “Great Escape,” as Angus Deaton has termed it, has been due to a turn from central economic planning toward private property and freedom of contract protected by the rule of law.Footnote 16 Moreover, the proportion of the world’s population living in extreme poverty is the lowest it has been in recorded history. According to Figure 3, as of the end of 2015, the percentage of individuals living on less than two dollars per day has fallen to less than 10 percent of the world’s population. Life expectancy has increased and the incidence of infant mortality has plummeted, which are illustrated in Figures 4 and 5, respectively. Human beings are living healthier, wealthier, and more productive lives than ever. These astonishing figures remind us, as Robert Lucas has stated, that “once one starts to think about them, it is hard to think about anything else.”Footnote 17 What explains this “Great Fact” in economic progress and the differences in economic performance?
World Population Living in Extreme Poverty (Millions) (Based on the $1.90 Poverty Line and 2011 PPP)
Source: Marcio Cruz, James Foster, Bryce Quillan, and Phillip Schellekens, Ending Extreme Poverty and Sharing Prosperity: Progress and Policies, Policy Research Note; PRN/15/03 (Washington, D.C.: World Bank Group, 2015).
http://pubdocs.worldbank.org/en/109701443800596288/PRN03Oct2015TwinGoals.pdf
Percentage of World Population Living in Extreme Poverty (Based on the $1.90 Poverty Line and 2011 PPP)
Source: Marcio Cruz, James Foster, Bryce Quillan, and Phillip Schellekens, Ending Extreme Poverty and Sharing Prosperity: Progress and Policies, Policy Research Note; PRN/15/03 (Washington, D.C.: World Bank Group, 2015).
http://pubdocs.worldbank.org/en/109701443800596288/PRN03Oct2015TwinGoals.pdf

Life Expectancy at Birth (Total Years)
Source: World Bank 2015
Mortality Rate of Infants (per 1,000 births)
Source: World Bank 2015
Political economists face trade-offs in their efforts to explain such significant social change as the Great Fact. Since World War II, economic inquiry has been dominated by a theoretical paradigm of resource allocation, rather than a paradigm of exchange and production that Adam Smith had originally initiated in economics.Footnote 18 Under the resource allocation paradigm, the condition of static equilibrium occupies the foreground of economic analysis. Under the conditions of equilibrium, all potential gains from trade and innovation between individuals are by definition fully exhausted. What is pushed to the background of analysis is the role that institutions and freely adjusting relative prices play in constantly guiding individuals toward potential gains from trade and innovation. This perspective is the opposite of how Smith and the classical political economists pursued economic science. The implication of the resource allocation paradigm is that economic development results from exogenous increases in physical capital, human capital, and technological innovation. In a world of static equilibrium, wealth is by definition a fixed pie. However, if our analysis begins in a world in which everyone is poor, as Adam Smith and the classics did, how do we explain the process by which countries became wealthy in the first place? The critical transition, as Adam Smith stated, was from the “lowest barbarism” to the “highest degree of opulence.”Footnote 19 This transition did not entail the redistribution of a pie of wealth, but understanding which institutions yield increasing returns to growing the pie. Smith’s explanation was not based on natural resources, geographic advantages, or even cultural heritage, but on the alternative institutions of governance that were in operation in the different times and places. P. T. Bauer argued more recently that explanations of the discrepancies in economic performance, such as a postulated “poverty trap,” fail in the wake of theoretical and empirical scrutiny.Footnote 20 In order to explain economic progress, we need an economic theory of dynamic change that explains how alternative institutions impact entrepreneurial behavior.Footnote 21
The theoretical paradigm of exchange and production can be understood in juxtaposition to the theory of resource allocation. Economists sitting in the seat of Adam Smith concentrate on exchange behavior and “the various institutional arrangements that arise from this form of activity.”Footnote 22 Entrepreneurial action of individuals is coordinated, as David Schmidtz states, “by free-floating price signals,” through which “the wealth of nations is made.”Footnote 23 Analytical attention is on the dynamic evolution toward equilibrium, whereby entrepreneurs discover opportunities for trade and innovation. At “each stage in this evolution towards solution,” as James Buchanan has stressed, “there are gains to be made, there are exchanges possible, and this being true, the direction of movement is modified.”Footnote 24 A story of how liberty generates economic progress via generalized increasing returns cannot be told in terms of static equilibrium, in which the role of the entrepreneur is eliminated.
B. Increasing returns and economic progress
In explaining the nature and causes of the wealth of nations, Adam Smith placed the role of productive specialization and peaceful cooperation under the division of labor at the center of his analysis. The engine of growth that transforms a society from subsistence to exchange is the increasing returns that emerge from trading activity. Smith recognized that “the greatest improvement in the productive powers of labour, and the greater part of the skill, dexterity, and judgment with which it is anywhere directed, or applied, seem to have been the effects of the division of labour.”Footnote 25
What was also crucial to Smith’s analysis is that exchange, or “trade-tested progress”Footnote 26 as Deirdre McCloskey dubs it, is predicated on a political-legal framework that secures private property and freedom of contract under the rule of law. As David Schmidtz and Jason Brennan put it, “a society’s infrastructure must also secure people in their possessions, so that people feel comfortable showing up at the market with goods for sale, feel secure to invest in the future, and so on.”Footnote 27 It is well-enforced property rights under the rule of law, and the ideas that legitimate such institutional infrastructure, that are responsible for the wealth creation that humanity has experienced over the past two centuries.
Smith argued that the division of labor is limited by the extent of the market. He correctly identified the source of an economy’s increasing productivity as the freedom to exchange and the ability of individuals to choose employment that best fits their skills and preferences. Through specialization and trade, all individuals in the exchange nexus can consume a greater quantity and variety of goods than they would be afforded living in isolation. Building on this point, Schmidtz states that commercial society is not only “liberating for all, especially the poor,” but also results in individuals “depending on many, yet being at the mercy of none.”Footnote 28
Prior to expanding the extent of market transactions, the same person might serve as both a surgeon and a barber, a common practice in Europe during the Middle Ages.Footnote 29 With a growing population, overall productivity rises as a “thicker market” of consumers supports the specialization of both trades into separate fields of employment. Due to increasing returns from specialization, the process of economic growth, Smith seemed to argue, has limitless potential. The refinement of specialization under the division labor promulgates ever-greater opportunities for employment, trade, and innovation. This virtuous cycle that Smith expounded is summarized nicely again by Schmidtz:
To Smith, economies of scale enable fine-grained specialization, thereby making possible new dimensions of pride in being able to perform superlatively at a particular kind of work. In port cities, arts proliferate and people innovate, because port cities are hubs of commerce; they are where cultures meet, and where entrepreneurs come looking for ideas.Footnote 30
For the purposes of our argument, what we wish to stress is not the increasing returns to scale, such as finer-grain specialization of any single productive activity. Rather, we want to draw attention to the generalized increasing returns to institutions that expand the scope of finer-grain specialization, as James Buchanan has emphasized.Footnote 31 It is this positive feedback loop between the accumulation of liberties, the institutionalization of liberty, and generalized increasing returns that unleashes ever greater refinements of productive entrepreneurial activity. This Smithian process explains the transition from poverty to wealth. Smith’s explanation of how countries rise from poverty to wealth is inseparable from institutional analysis.
The Smithian view of economic progress emphasizes how the institutional framework of negative liberty engenders a process of entrepreneurial discovery of new ways of combining resources together in a more productive manner. Individuals realize the mutual gains from trade and innovation. The process of entrepreneurial discovery entails new ways for individuals to relate to one another peacefully within the extended order of the marketplace. An extension of the limits of the market yields economic progress not only by enabling more fine-grained specialization of entrepreneurial talent, but also because entrepreneurial discoveries provide positive feedback for the discovery of additional entrepreneurial opportunities. Changes in the institutional framework, which result from the achievement of liberties, are embodied by “generalized or economywide increasing returns”Footnote 32 to all entrepreneurial activity. Without this general expansion of the market, as Randall Holcombe has argued:
Henry Ford could not have succeeded in mass-producing automobiles until there was a substantial market, including infrastructure such as roads, gasoline stations, and repair facilities. Bill Gates could not have made his fortune had not Steve Jobs seen the opportunity to build and sell personal computers, and Steve Jobs could not have built a personal computer had not Gordon Moore invented the microprocessor.Footnote 33
For Smith, the extent of productive specialization and social cooperation under the division of labor is institutionally contingent. What determines the extent of the market is the security of private property and freedom of contract under the rule of law. What is inseparable from Smith’s explanation of how countries rise from a state of humiliating poverty to generalized wealth, respect, and dignity is the generalized increasing returns that emerge from institutions of governance that are operating in that particular time and place. The move from subsistence to exchange corresponds with the accumulation of liberties to the institutionalization of liberty. The institutional establishment of liberty liberates the poor from starvation, servitude, and exploitation.
III. Institutions, Entrepreneurship, and the Liberating Effect of Increasing Returns
The statistical and graphical analysis shown in Section II illustrates that individuals consume a greater amount and variety of goods and services than ever before in recorded human history. However, as McCloskey and other economists have written, economic progress is not merely about consuming more stuff. As she puts it, “[m]odern economic growth gives the scope to do much more, whether or not the opportunity has been fully seized by everybody.”Footnote 34 Economic freedom, Schmidtz reminds us, “promotes not only universal opulence but also a universal freedom of which the weak are the principal beneficiaries.”Footnote 35
As Schmidtz writes, “[t]hroughout history, the strong have subjugated the weak. In Smith’s mind, commercial society changed the frontier of possibility in such a way that the strong have a better option: namely, learning to do business in such a way that the community is better off with them than without them.”Footnote 36 Central to Smith’s explanation is the role that institutions play in guiding entrepreneurial activity. The increasing returns to productive entrepreneurship emerge from the liberating effect that the institutional framework plays, specifically by unleashing the creative powers of the poor and weak whose talents and energies would otherwise go underutilized.
The simple proposition that individuals are alert to profit opportunities is the basic entrepreneurial insight upon which the division of labor emerges. Whether entrepreneurial action will be directed in a productive or unproductive direction is institutionally contingent. Different institutional arrangements incentivize different forms of entrepreneurship. The returns to a particular form of entrepreneurial activity are a function of the institutional infrastructure in place and the extent of the market that framework enables.
If Smith gave primacy to exchange and specialization in explaining the cause of wealth creation, how is liberty then important for human progress? Liberty and human progress are a particular manifestation of institutions and entrepreneurship, respectively. Institutions — the rules of the game that structure human interaction — can be understood as filters for the allocation of entrepreneurial talent. Institutions, such as property rights, provide the framework for entrepreneurial activity by structuring the costs and benefits of exchange. Institutions either (1) encourage productive entrepreneurship and technological innovation, or (2) direct activity into unproductive entrepreneurship and a politicized redistribution of property rights. Such entrepreneurial outcomes are dependent on the presence or absence of liberty. Institutions and entrepreneurship are inseparable from one another in understanding not only human progress, but also the path to liberty.
For most of human history, the institution of property was insecure from predation, precluding the realization of extensive gains from trade and innovation. As a result, violence was the means by which individuals competed for resources, rather than cooperative exchange. Moreover, it is in such a situation that individuals specializing in exercising force subjugate the weak. For this reason Smith concluded the following:
It is only under the shelter of the civil magistrate that the owner of that valuable property, which is acquired by the labour of many years, or perhaps of many successive generations, can sleep a single night in security. He is at all times surrounded by unknown enemies, whom, though he never provoked, he can never appease, and from whose injustice he can be protected only by the powerful arm of the civil magistrate continually held up to chastise it.Footnote 37
There are certain ways of allocating property rights that are conductive either to productive entrepreneurship or unproductive entrepreneurship.Footnote 38 Such consequences are contingent upon the presence or absence of the rule of law. Under the rule of law, “government confines itself to fixing rules determining the conditions under which the available resources may be used, leaving to the individuals the decision for what ends they are to be used.”Footnote 39 The nature of the rule of law implies that laws are certain, applied equally to all individuals, and end-independent. Thus, by creating a private sphere of voluntary exchange, “a right like that of property will emerge”Footnote 40 at the expense of political privilege.
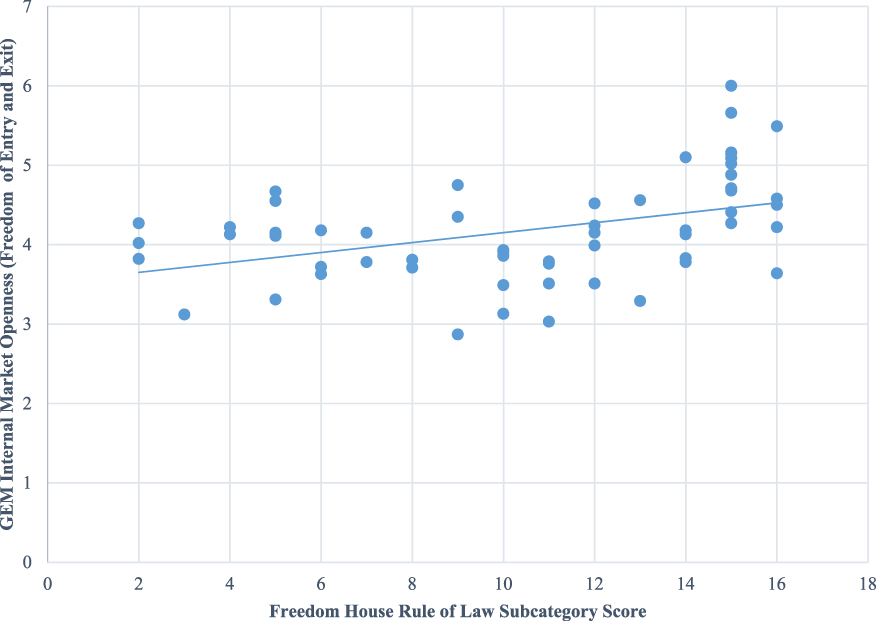
According to Israel Kirzner, a market society under private property and the rule of law is characterized most distinctively “by freedom of entrepreneurial entry.”Footnote 41 Complementary to the freedom of entry and exit, as Schmidtz stresses, a “second freedom transforming Europe’s economy by Smith’s time was the freedom of ordinary people to contract with persons other than the lord. In a feudal system, if you are born a serf, you are entitled to your lord’s protection, but you lack many rights that today we take for granted.”Footnote 42 Freedom of contract yields generalized increasing returns by harnessing the creative powers of individuals, who previously were excluded because of the privilege or status of others. As private property becomes more secure under the rule of law, individuals become freer to enter and exit contractual relationships with other prospective employers. Individuals become free to pursue an entrepreneurial project of their own by forming a new firm, introducing new products, or initiating a new technique of production. This point is also illustrated in Figure 6, showing that in countries where the rule of law is more secure, there is greater openness in the market for new firms to enter, at the expense of established monopoly privilege.
Institutions and Internal Market Openness
Source: Global Entrepreneurship Monitor (GEM) 2015 National Expert Survey Global Key Indicators;
http://www.gemconsortium.org/data/sets
Freedom House 2015
https://freedomhouse.org/report/freedom-world-aggregate-and-subcategory-scores
Notes: The scatter plot represents a correlation between the extent to which new firms are free to enter existing markets (i.e., internal market openness) and the extent to which property rights are secure under the rule of law.
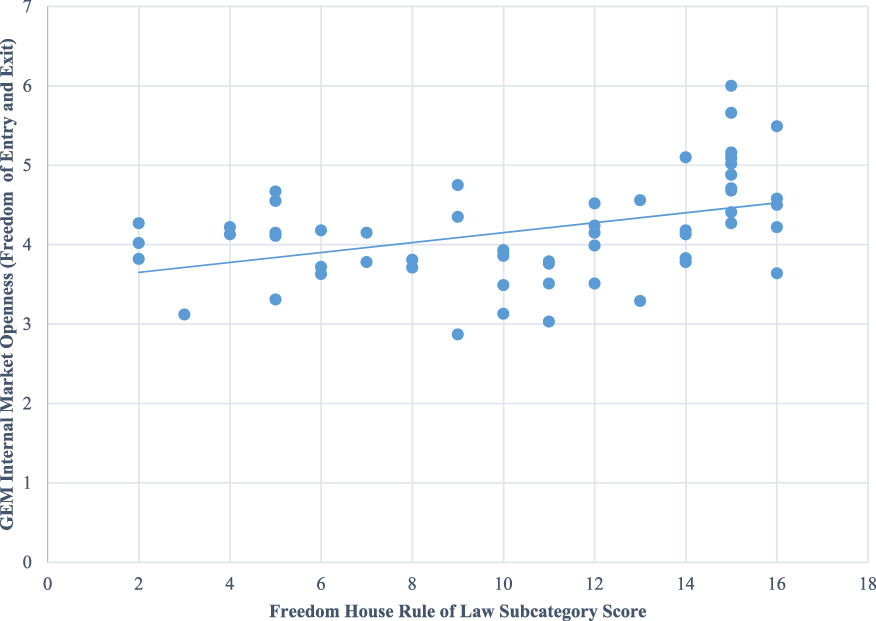
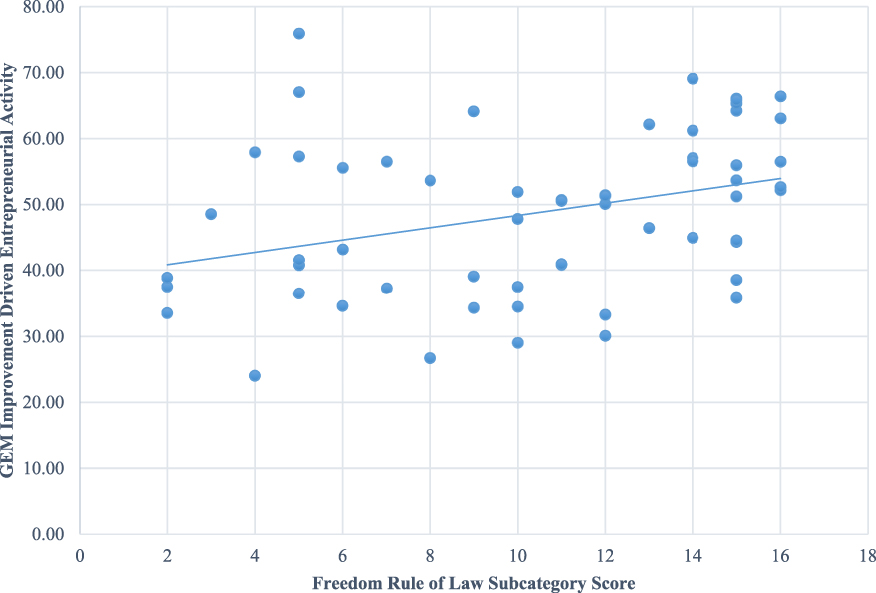
Increasing returns also arise from greater economic inclusion.Footnote 43 Rather than workers being limited in their choice of work by class or social status, greater freedom of entry and exit is liberating due to greater social mobility. Rather than being barred from certain occupations based on class or status, the son of a barber or pipefitter might rise to become a professor.Footnote 44 This positive relationship is illustrated by Figure 7. When the rule of law becomes more secure, it empowers greater numbers of individuals who are entrepreneurial to pursue a new opportunity of employment.
Institutions and Productive Entrepreneurship
Source: Global Entrepreneurship Monitor (GEM) 2015 Adult Population Survey Global Key Indicators
http://www.gemconsortium.org/data/sets
Freedom House 2015
https://freedomhouse.org/report/freedom-world-aggregate-and-subcategory-scores
Notes: The scatter plot represents a correlation between those individuals surveyed (1) who claim to be driven by opportunity as opposed to finding no other option for work and who indicate that the main driver for being involved in this opportunity is being independent or increasing their income, rather than just maintaining their income, and (2) the extent to which property rights are secure under the rule of law.
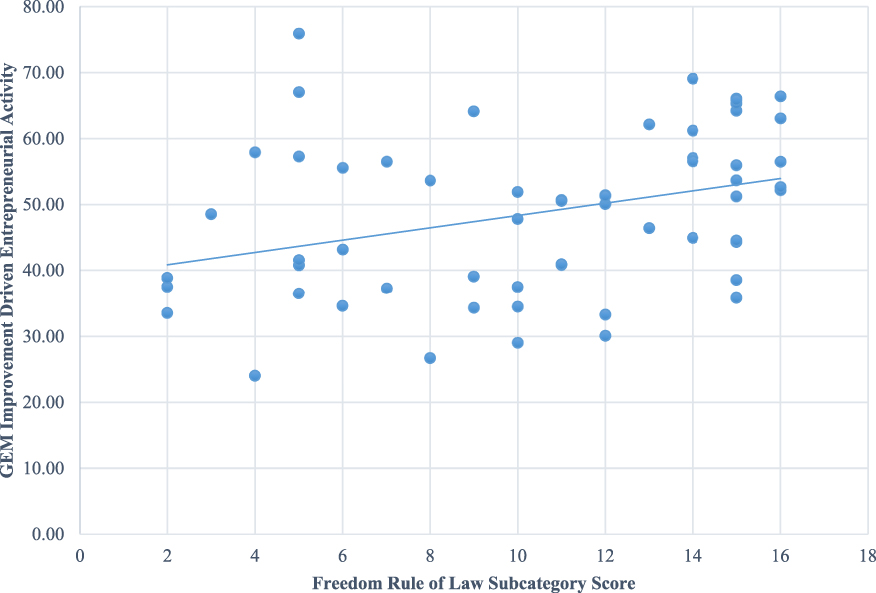
The institution of private property does not merely incentivize the allocation of given resources. Competition is inherently a process of entrepreneurial discovery of dispersed and particularized knowledge.Footnote 45 Competition between entrepreneurs generates knowledge of new resources, new technology and innovative new ways to use such resources and technology. Outside the institutional context of private property, resources cannot be allocated to their most valued uses. This is because the contextual knowledge required to calculate the relative scarcity of the means of production through money prices is absent. It is in this sense that Hayek referred to competition as a discovery procedure,Footnote 46 initiated by entrepreneurs being alert to profit opportunities. In order for the price system to communicate the relative scarcity of resources, entrepreneurs must be free to pursue profit as well as bear losses. Profits signal to entrepreneurs that resources have been directed to projects most valued by consumers, and losses communicate to entrepreneurs that resources are more valued by consumers in alternative projects. Private property is required for economic calculation of the productive investment of scarce resources in an economy, without which the economic progress we have been talking about would be impossible.Footnote 47 The role of economic calculation, according to Ludwig von Mises, is to sort out, from among the vast array of technologically feasible production projects, those that are economically feasible. This provides the underlying logic of what Deidre McCloskey described as “trade-tested” betterment in human affairs. Liberty provides the institutional foundation upon which economic calculation of the alternative uses of scarce resources can occur through the exchange of private property.
Without the rule of law, the allocation of property rights will become a negative-sum game rather than a positive-sum game.Footnote 48 Economic progress will stagnate when resources are expended to transfer existing wealth by political discretion rather than creating new wealth through voluntary exchange. The opportunity to transfer existing wealth through political discretion attracts unproductive entrepreneurship.Footnote 49 Adam Smith warned that without a system of natural liberty, “governments which thwart this natural course, which force things into another channel, or which endeavor to arrest the progress of a particular society at a particular point, are unnatural, and to support themselves are obliged to be oppressive and tyrannical.”Footnote 50
In The Road to Serfdom, Hayek applied basic economic reasoning to understand why the worst get on the top of political decision-making authority within central planning regimes.Footnote 51 In both markets and politics, individuals are competing against each other, but the different institutional settings yield generalized increasing returns to different manifestations of competition. In markets, entrepreneurs benefit themselves only by benefiting others, with the unintended result of competition manifesting itself peacefully and productively. For example, an entrepreneur can choose to build railroads out of platinum or steel. Although platinum is a higher-quality metal, the higher price of platinum communicates to the entrepreneur that platinum is scarce, and in higher demand elsewhere. As a result, the entrepreneur will cut back on platinum and substitute iron to build railroads more profitably. The miracle of the price system is that it coordinates the self-interest of the entrepreneur with the demands of other individuals without using force. In politics, however, the same entrepreneur who controls the use of platinum bears neither the full cost of utilizing platinum to build railroads nor does he or she benefit from building railroads more profitably with iron. Outside the context of private ownership, such an individual will lack the prerequisite knowledge provided by monetary prices and profit/loss signals to use scarce resources productively.
Moreover, whereas the entrepreneur in the market uses resources to serve the ends of other individuals, the same entrepreneur in politics uses resources to control the ends of other individuals. If, for example, a political official controls the use of platinum, as a scarce and valuable commodity, political control over the right to use platinum will invite bribery by individuals seeking to acquire platinum for alternative uses. Such a profit opportunity will attract individuals with a comparative advantage in exercising a particular form of entrepreneurial talent, the ability to exercise coercion and compete for political power. Competition for such political privileges will tend to yield increasingly higher returns to individuals willing to compete for political control of such resources. Moreover, it will also yield higher returns to individuals who are willing to protect the value of such a privilege by increasing the scope of their power. This may include not only the control and exclusion of the use of substitutes or other technologies that erode the value of platinum, but also the exclusion of potential rivals for political power, both through violent means. Such increasing returns to the scope of political power explain why, as Hayek put it, the worst get on top.
Smith recognized the entrepreneurial propensity of individuals “to maintain the natural progress of things toward improvement, in spite both of the extravagance of government, and of the greatest errors of’ administration.”Footnote 52 As he further added: “[t]he natural effort of every individual to better his own condition, when suffered to exert itself with freedom and security is so powerful a principle that it is alone, and without any assistance, not only capable of carrying on the society to wealth and prosperity, but of surmounting a hundred impertinent obstructions with which the folly of human laws too often incumbers its operations; though the effect of these obstructions is always more or less either to encroach upon its freedom, or to diminish its security”Footnote 53 (emphasis added).
Smith’s appreciation of the omnipresence of entrepreneurship does not detract from the role that institutions play in directing entrepreneurial talent. Moreover, it does not detract from the critical threshold that must be reached in the accumulation of liberties in order for the creative powers of a free civilization to be unleashed and economic progress to be realized. The human “propensity to truck, barter, and exchange” has existed throughout history. The historical path to liberty cannot be fully understood without understanding the positive feedback loop between entrepreneurial wealth creation and the accumulation of liberties. The economic progress unleashed by productive entrepreneurial activity could not have occurred without the gradual accumulation of liberties and the eventual institutional establishment of liberty.
IV. The “Moral” Constitution of Liberty
In the previous section, we outlined the role that institutions play in rewarding different forms of entrepreneurial activity, determining the wealth or poverty of a society. While private property under the rule of law is an essential filtering mechanism for productive entrepreneurship, formal institutions alone cannot realize the full potential of the creative powers of a free society. Formal institutions that facilitate an extensive division of labor rely on certain norms that reinforce the rules of just conduct in the social order. Informal and formal rules emerge through the evolution of the exchange nexus. Social norms, such as freedom from discrimination based on race, ethnicity, sex, and creed, emerge from commercial activity. Moreover, commercial interaction reinforces the freedom to express and experiment with new ideas. Both freedom from discrimination and freedom of expression arise from a principle of tolerance. While liberty demands tolerance as a matter of principle,Footnote 54 this notional freedom becomes an effective freedom through commercial dealings.Footnote 55 From the institutional precondition of liberty, the market process emerges to fully realize these liberties.
The generation of commercial practices and ideas is ignited by the entrepreneurial market process. The invisible hand not only generates economic growth, but also commercial practices and ideas that further expand and reinforce the scope of social cooperation under the division of labor. As Murray Rothbard states, “it is far more likely that feelings of friendship and communion are the effects of a regime of (contractual) social co-operation rather than the cause.”Footnote 56 It is a “combustible combination” of not only institutions, but also commercial practices and ideas that results in human progress.Footnote 57
Adam Smith states that a “[s]ociety may subsist, though not in its most comfortable state, without beneficence.”Footnote 58 A free society is one in which its institutional preconditions do not guarantee that all human possibilities will be realized. Rather, the institutional framework of a free society is planted thick with possibilities and responsibilities. Such an institutional framework enables individuals to cultivate the customs, habits, and ideas necessary for a free society to realize its full potential and push the extent of the market for the discovery of new possibilities.Footnote 59 As Hayek states, these accidental discoveries “occur in the combination of knowledge and attitudes, skills and habits, acquired by individual men and also when qualified men are confronted with the particular circumstances which they are equipped to deal with.”Footnote 60 Wealth creation that enables the transformation of merely notional freedoms to effective freedoms can only be experienced through toleration of a great number and great diversity of peoples, who are free to experiment, innovate, and act on their specialized and particular knowledge.Footnote 61
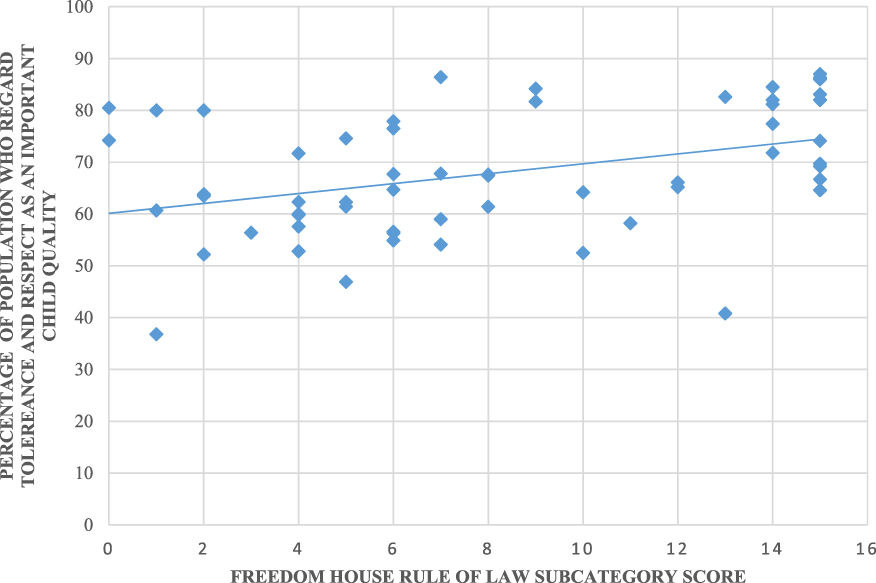
In The Lever of Riches, economist Joel Mokyr states that “innovation requires diversity and tolerance.”Footnote 62 Tolerance is the underlying moral attitude that links the institutional framework of liberty with expansion of the exchange nexus. An expanding scope of exchange, the spread of commercial practices, and the emergence of legitimating ideas generates a “combustible combination” of social progress. While secure private property under the rule of law makes it safe to be a full participant in a market society, the rule of law cannot guarantee that all mutually beneficial trades will not go unrealized due to bigotry, mistrust, or hate of strangers. Commerce facilitates tolerance not only by raising the cost of violent conflict, but also by raising the cost of discriminating against previously unknown trading partners. This positive relationship is illustrated in Figure 8. By being intolerant of individuals different from ourselves, one foregoes the chance for enrichment, both material and moral, through exchange. Berggren and Nilsson observe that the “practice of commercial interaction and trade induces people to understand others and to realize that they do not pose a threat.”Footnote 63 Through trade, a cosmopolitan notion of liberty can be gradually accumulated and made more effective through the market process. As Montesquieu states, “[c]ommerce cures destructive prejudices, and it is an almost general rule that everywhere there are gentle mores, there is commerce and that everywhere there is commerce, there are gentle mores.”Footnote 64
Institutions and Tolerance
Source: Freedom House 2015
https://freedomhouse.org/report/freedom-world-aggregate-and-subcategory-scores
World Value Survey Wave 6: 2010-2014
http://www.worldvaluessurvey.org/WVSOnline.jsp
Notes: The scatter plot represents a correlation between (1) the proportion of the population surveyed regarding tolerance and respect as an important child quality and (2) the extent to which property rights are secure under the rule of law.
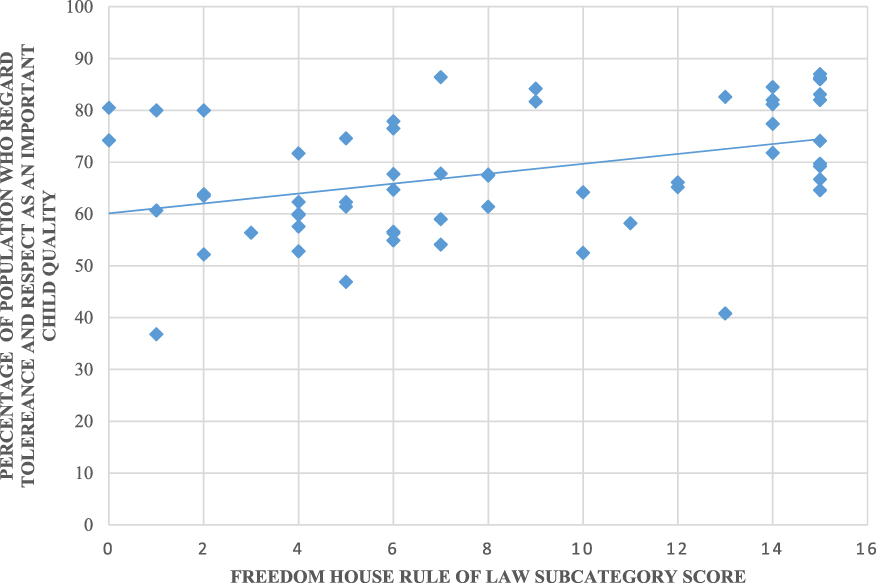
With regard to social progress, “perhaps the most important effect of tolerance is its dynamic effects on the generation and spread of new ideas.”Footnote 65 The importance of trade and specialization enabled by liberty goes far beyond impersonal communication between anonymous strangers via the price system. “Contacts through traders and trade are prime agents in the spread of new ideas, modes of behavior, and methods of production,”Footnote 66 facilitating the “combustible combination” of explosive human progress. Deirdre McCloskey has most recently argued that a shift in rhetoric and ideas that legitimate bourgeois commercial values gave rise to trade-tested progress first in the West. Her claim is that the institutions of liberty alone cannot explain the trade-tested progress that emerged in the late eighteenth and early nineteenth century. The institutional precondition of property is necessary, though not sufficient for the full potential of liberty to be realized.Footnote 67 The rise of bourgeois commercial values and practices, such as mutual respect, trust, and reciprocal regard, fully breathe life into the notion of private property. Without such values, the potential scope of market exchange will shrink, limiting the generalized increasing returns to adopting private property.
We agree with McCloskey that the timing of what she calls “The Great Enrichment” cannot be fully attributed to the existence of private property rights. Our disagreement with her argument, however, is ironically more rhetorical rather than substantive. Prior to the nineteenth century, private property rights may have existed in form, but they were waiting to be deployed by entrepreneurs in use. The full potential use of private property unfortunately remained unnoticed for centuries due to the lack of subsidiary institutional prerequisites. These subsidiary conditions include the legitimation of commercial ideas and practices to fully realize the potential from trade and innovation. In other words, the previous accumulation of liberties had not yet reached the critical threshold or “tipping point” required for the generalized increasing returns to be realized. But as we have argued throughout this essay, once the spark is provided through the legitimation of the accumulation of particular liberties, the “combustible combination” of ideas, institutions and practices set in motion the virtuous cycle of human progress.
Our argument can be illustrated by the following analogy. The “engine” of economic progress is the generalized increasing returns to accumulating liberties, conducive to productive specialization and peaceful social cooperation. What “fuels” that engine is the entrepreneurial spirit within the context of a private property order, and guided by freely fluctuating relative prices so that complex coordination of economic plans is realized through time. The “ignition” is the ideas that afford respect and dignity to ordinary people, providing the physical, social, and intellectual space for them to pursue their projects as they see best. This interaction thesis explains how millions have been lifted from abject poverty, sickness, and servitude to others who exercise dominion over them. If in fact a shift in rhetoric and ideas dignifying bourgeois commercial values explains economic progress, and property rights had already been well established in the West before the late eighteenth century, as McCloskey claims, what then is the missing link that generated a “combustible combination” of increasing returns to specialization and innovation? We take up this question in the next section.
V. The Historical Path of Liberty
As we argued in the previous section, social progress facilitated by liberty is not merely an economic process of exchange and innovation under the division of labor. It is also inclusive of social norms that emerge to facilitate and reinforce the extension of the market. We have also pointed out in Section III that the state may enable the security of property rights from private predation and foster greater gains from specialization under the division of labor. As economist Douglass North pointed out, “the existence of a state is essential for economic growth.”Footnote 68 This notion of the state as a facilitator and enforcer of private contracts “is a logical extension of the theorem of exchange.”Footnote 69 However, as a monopoly on legitimized force, North also recognizes that the state also has been “the source of man-made economic decline,”Footnote 70 with the capacity to be the greatest instrument for predation and allocating privileges to special interest groups. How is it possible then to empower government to enforce private contracts while simultaneously constraining it from predation and granting special privileges?
Political economy, as James Buchanan stressed throughout his career, can best be understood as two levels of analysis: (1) a study of the rules of the game and their enforcement; and (2) social interaction within those rules. Going as far back as the Scottish Enlightenment, scholars such as Adam Ferguson, David Hume, and Adam Smith elaborated on the spontaneous order of the market process within a framework of private property, freedom of contract, and the rule of law. Among economists working in the Austrian tradition, such as Carl Menger and F. A. Hayek, spontaneous order theorizing was extended to understand the emergence of rules for social order as well. It was from a spontaneous order process of human action, though not of human design, that the institutions of liberty emerged in Europe.
Liberty first emerged in the West neither because of any behavioral superiority of Europeans nor because of the benevolence of European political leaders to design rules for social progress. Rather, as Tyler Cowen has argued, the institutions that would later facilitate social progress emerged out of the entrepreneurial action of political leaders, who were seeking to expand their domestic revenue base under the threat of international conflict. As an unintended consequence of such action, feudalistic privileges were gradually eroded and liberties were accumulated step by step until a critical threshold was met. This critical threshold was met by a “combustible combination,” which included (1) the institutional liberalization of European economies, (2) the rise of new commercial practices expanding the scope of trade and innovation, and (3) the toleration of new ideas giving dignity to a diversity of new forms of employment. It is the alignment of these institutions, practices, and ideas into a “combustible combination” that enabled diverse human societies to realize the unlimited potential of social cooperation and productive specialization. This gradual cumulative procedure in the path to liberty is best characterized by Ludwig von Mises: “Saving, capital accumulation, is the agency that has transformed step-by-step the awkward search for food on the part of the savage cave dwellers into the modern ways of industry. The pacemakers of this evolution were the ideas that created the institutional framework within which capital accumulation was rendered safe by the principle of private ownership of the means of production.”Footnote 71
Throughout our argument we have stressed the role of specialization under the division of labor in explaining this institutional evolution. The initial step in the accumulation of wealth required the achievement of liberties to complement and facilitate a further extension of market exchange. Rosenberg and Birdzell account for the discovery, evolution, and growth of institutional innovations in Medieval Europe that facilitated the expansion of productive specialization of the division of labor:
Medieval society was not well adapted to even the most essential trade between regions, and the expansion of trade which occurred in the fifteenth and sixteenth centuries required the invention or adoption of new institutional arrangements to supplement or replace the old medieval institutions. Some of the institutional innovations reduced the risks of trade, either political or commercial. Among them were a legal system designed to give predictable, rather than discretionary, decisions; the introduction of bills of exchange, which facilitated the transfer of money and provided the credit needed for commercial transactions; the rise of an insurance market; and the change of governmental revenue systems from discretionary expropriation to systematic taxation — a change closely linked to the development of the institution of private property.Footnote 72
As we stressed in our discussion on economic calculation, political leaders operate outside a context of private property and money prices. They therefore cannot calculate the relative scarcity of the means of production. Without the incentives or the requisite knowledge provided by private property and money prices, respectively, they cannot allocate resources to their most economically valued uses. Without these institutional constraints, political decision-makers are incentivized to accumulate power and political support in a negative-sum manner. They do so by creating monopoly privileges, regulations, and other barriers to entry that benefit politically favored special interest groups. How was it, then, that institutions conducive to liberty emerged in Western Europe out of the entrepreneurial action of political leaders, but not out of their intended design?
Liberty in Western Europe historically “grew out of a politically decentralized feudal society”Footnote 73 of small competing jurisdictions, each of which were anxious to extract revenue generated by the commercial practices of the bourgeoisie. Although violent conflict itself is a negative sum game, the unintended results induced by the threat of international conflict were the adoption of growth-enhancing institutional arrangements. Two filtering mechanisms — an incentive effect and a selection effectFootnote 74 — generate this “invisible-hand explanation.”Footnote 75
As Joel Mokyr states, a “powerful ruler can be enlisted either to protect the status quo or to support the forces of progress.”Footnote 76 The incentive effect motivates policymakers to pay attention to how different institutional arrangements affect economic performance. Since specialization yields increasing returns to one’s knowledge, “the expected return from attempting to learn which policies promote development is greater if this knowledge can be applied to improving a country’s international standing.”Footnote 77 Policies, which are intended to bolster national defense, can inadvertently generate the conditions for economic progress.
The selection effect sorts from a set of political leaders those who are more alert to making institutional changes that can increase their tax revenue base. Just as we might expect in a market setting that the firms that survive are those most successful in being alert to profit opportunities, the same evolutionary mechanism can be applied to understand the “survival” of particular institutional arrangements.Footnote 78 Within a decentralized and fragmented institutional setting, the incentive and selection effect aligned the self-interest of European political leaders with the unintended public benefit of adopting institutions conducive to liberty.
In order to finance the maintenance of strong military forces against the threat of conflict, European political leaders were incentivized to secure the property rights of merchants, bankers, and technological innovators. The effect of this institutional change was to encourage the development of capital markets capable of mobilizing large concentrations of wealth from which to tax and borrow. Moreover, in order for the political elite to have tapped this economic potential, security from arbitrary expropriation and confiscation, and toleration of technological experimentation and new ideas that would yield savings and investment were both necessary. These institutional changes facilitated the expansion of technological innovation and productive specialization under the division of labor. As Brennan and Schmidtz argue, “trade gets off the ground when people feel so secure in their possessions that a transformation occurs: people begin to think of themselves as being able simply to count on having the right to say no.”Footnote 79 Individuals that are able to devote more time engaged in trade and innovation rather than defending their property will generate greater wealth. Once an institutional framework had been secured with the potential for liberty, what had to emerge were commercial practices and ideas that dignified the accumulation of wealth through market exchange rather than the acquisition of political privilege.
If the political environment of Western Europe had not been decentralized, this competitive process might not have yielded an accumulation of liberties and thus the path to liberty. On this point, North states the following: “Where there are no close substitutes,” such as competing states, “the existing ruler characteristically is a despot, a dictator, or an absolute monarch.”Footnote 80 For example, China had been regarded as technologically superior to Western Europe during this same period. However, given the size and centralized nature of its government, the competitive pressure to make liberty-oriented institutional reforms was less prevalent than it was in Western Europe. As a result, “when China was in financial straits, confiscation of the property of wealthy subjects was entirely in order,”Footnote 81 thwarting long-term capital accumulation and investment. While the West was gradually achieving liberties that would ignite the combustible combination of economic progress, what prevailed in China was an institutional status quo that discouraged productive entrepreneurship. Without the path to liberty that Western Europeans had taken, the ability to yield increasing returns from technological innovation, to channel entrepreneurial energy into wealth-creating activities, and to cultivate values and ideas that dignify productive entrepreneurship, might never have been possible.
VI. Conclusion
We argued in this essay that the institutionalization of liberty exhibits, in economists’ language, “increasing returns.” The accumulation of liberties provides positive feedback in terms of economic progress, thus aiding the process of accumulating more liberties. Fundamental to this process was the recognition and respect afforded to persons and property. The grand tradition of political economy since the time of Adam Smith has focused our attention on that set of institutions that harnesses the spontaneous forces of the market and enables a diversity of individuals to realize mutual gains through productive specialization and social cooperation. However, the realization of social cooperation under the division of labor requires not only specific institutions, but also underlying social mores, cultural norms, and ideas that extend the scope of market exchange.
Historically, liberty did not come in one full sweep, but through the cumulative adoption of liberties. Small steps to a better world were taken, but steps that were positively reinforced, leading to the dramatic improvement in human well-being once a critical threshold was met. Liberty, from this perspective, is not a fixed doctrine prescribing the confines of individual interaction. Rather, liberty is a set of rules that enables individuals to adapt to unforeseeable and unpredictable circumstances. As Hayek states, liberty “is essential in order to leave room for the unforeseeable and the unpredictable.”Footnote 82 He also goes further to argue that “the advance and even the preservation of civilization are dependent upon a maximum of opportunity for accidents to happen.”Footnote 83 Liberty generates progress by enabling us to live better together than we ever could apart. Social progress is the process of individuals aligning their own purposive plans in coordination and interaction with those of others. In the commercial realm this means that the production plans of some must coordinate with the consumption demands of others. In the noncommercial realm, it means that we must adopt rules that enable us to live better together as neighbors, despite our diverse beliefs and attitudes, than we ever could in isolation from one another. It is through this continual process of adaptation and learning within both the commercial and noncommercial sectors of society that the achievement of liberty is approximated and the interdependent and co-evolutionary relationship between liberty and progress is to be found.