Implications
In pig breeding programmes, phenotypic selection to avoid unfavourable conformational traits is common, which can result in a reduced selection differential, thereby leading to reduced genetic gain. In this study, genetic parameters for 11 exterior traits and osteochondrosis diagnosed with computed tomography are presented. The main findings are that heritabilities for the traits are medium to low, and that significant genetic correlations exist among the traits. Furthermore, the study presents desirable genetic trends from a breeding programme in which conformation traits have been included in the breeding goal based on estimated breeding values rather than phenotypic selection for the traits.
Introduction
Since the start of pig breeding, a subjective assessment of exterior traits has been carried out by the breeders, and several evaluation systems have been implemented by pig breeders and pig breeding companies worldwide (Bereskin, Reference Bereskin1979; Lundeheim, Reference Lundeheim1987; Grindflek and Sehested, Reference Grindflek and Sehested1996; Nikkilä et al., Reference Nikkilä, Stalder, Mote, Rothschild, Gunsett, Johnson, Karriker, Boggess and Serenius2013a). The focus on exterior traits in the pig industry is primarily owing to its relationship with leg weakness and the stayability of the animals. Reports from the pig industry (Mote et al., Reference Mote, Mabry, Stalder and Rothschild2009; Norsvin, 2012) suggest that leg weakness and lameness are still major reasons for the culling of sows. More than three decades ago, Reiland (Reference Reiland1978) claimed that osteochondrosis (OC) was a major contributor to leg weakness, and several groups have more recently investigated the relationship between exterior assessment and OC (Jørgensen and Andersen, Reference Jørgensen and Andersen2000; Luther et al., Reference Luther, Schwörer and Hofer2007). Their findings were not completely consistent, but indicate a genetic relationship between OC and the ‘X-posture of leg’, between OC and the ‘rear leg side-view angle’, between the ‘rear leg size of the inner toe’, and between OC and swaying hindquarters. Miller (Reference Miller1977) experimented with the use of X-ray techniques as a tool to study what he called ‘structural soundness’. His conclusion was that this technique was not feasible in practical breeding, and that a visual scoring system would be sufficient. An important goal for breeders is to effectively improve conformation traits connected to the lifetime performance of animals, and as a consequence, animal welfare is improved. Hence, the objective of our study was to investigate the heritabilities and genetic correlations between selected traits from a linear exterior assessment system and OC measured by computed tomography (CT), in addition to studying genetic trends resulting from implementing these traits in a breeding programme. This stands in contrast with former studies, which only present genetic parameters for exterior and OC traits.
Material and methods
Animals
A total of 4571 Norsvin Landrace test station boars were included in the study. Records from only one male per litter were utilized to help avoid the effect of a common rearing environment. This excluded <10% of the boars with phenotypes. The animals were purebred Landrace and part of a breeding nucleus population consisting of ~50 elite boars and 3500 purebred litters per year, whereas the generations were overlapping, with an average generation interval of 1.15 years. The Landrace population has been closed for the last three decades with no import of genetic material, and all AI boar candidates were tested at one test station with an annual test capacity of ~3500 boars. The boars in the study entered the test facility between April 2008 and January 2013 at a live weight of ~25 kg, and groups of 12 boars were placed in each pen based on an equal BW. Boars suffering from disease (e.g. lame) and not responding to medical treatment were euthanized, and were neither CT scanned nor subjected to conformation assessment. The test regime was changed during the data collection period; from April 2007 to mid-December 2011, the test was ended at ~100 kg live weight, whereas from mid-December 2011 to January 2013 the test ended at ~120 kg live weight. At the end of the test period, all boars were subjected to a conformation assessment with a 32-trait exterior assessment system (Supplementary Table S1). Within 10 days of the assessment, the boars were subjected to a CT for the measurement of lean meat percentage and OC. Before scanning, the boars were sedated using Azaperone, 8 mg/kg live weight (Stresnil Vet®, Janssen-Cilag Ltd, Buckinghamshire, UK), which was administered intra-muscularly. Furthermore, all boars in the study were reared according to the laws and regulations for keeping pigs in Norway (Animal Welfare Act 2009-06-19-97, Regulation for the keeping of pigs in Norway 2003-02-18-175).
Conformation characteristics
All boars were assessed once by the same trained technician. The assessment of all the 32 traits for each individual boar took ~5 min, and of the 32 available traits 11 were chosen to be included in the study. The traits were chosen based on a preliminary analysis (univariate heritability estimates and a bivariate estimation of genetic correlations to OC). Five of the traits were scored on a seven-point linear assessment scale, as described in Supplementary Figure S1, whereas the remaining six traits were scored on a four-point linear scale as described in Supplementary Figure S2.
The traits scored on the seven-point scale were front leg knee side view (FKNE), front leg pastern side view (FPAS), front leg knee front view (FSTA), hind leg position rear view (HSTA) and hind leg pastern side view (HPAS). A value of 1 was assigned to the boars with a severe or pronounced expression of a trait in the direction assumed to be preferable as described in Supplementary Figure S1. The preferable direction for the trait was determined by the literature and population average score for the trait. A value of 4 was assigned to the animals with the desired expression of the trait, whereas a value of 7 was assigned to the animals with a severe or pronounced expression of the trait in the most undesirable direction, as described in Supplementary Figure S2. For example, to illustrate with the FPAS trait, this would translate as follows: pronounced soft (score of 1), medium soft (score of 2), hint soft (score of 3), correct/desired (score of 4), hint upright (score of 5), medium upright (score of 6) and pronounced upright (score of 7). For estimated breeding values (EBV) calculation and selection purposes, a direction for selection should be chosen. For example, for FPAS, and with the average of the population being >4, a selection towards 1 is applied to move the population average towards the optimum of 4. In addition, softer pasterns are thought to be better than upright if one had to be chosen over the other. The traits scored on a four-point scale were front leg pastern front view (FFLK), hind leg standing under side view (HSTU), hind leg small inner toe (HITO), dipped back (DIPP), arched back (ARCH) and waddling hindquarters (WADL). For the four-point scale, desired/correct appearance was assigned a value of 1, while pronounced or severe was given a value of 4. A score of 4 would also be assigned to animals with severe outward twisted pasterns (FFLK), severe standing under (HSTU), severe small inner toe (HITO), severe dipped back (DIPP), severe arched back (ARCH) and severe waddling hindquarters (WADL). The conformation assessment systems described were developed by Norsvin and has been in use since 1996.
For all conformation traits except ARCH, phenotypes from 2008 to 2013 were used, as the phenotype registrations for ARCH were only available after March 2012.
Assessment of OC using CT
OC was scored by using CT as described in detail by Aasmundstad et al. (Reference Aasmundstad, Kongsro, Wetten, Dolvik and Vangen2013). In a study described by Olstad (Reference Olstad, Kongsro, Grindflek and Dolvik2014), a cohort of piglets was serially scanned from two to eight times at biweekly intervals with conventional CT, and then, following the last scan for each piglet, a postmortem sectioning of distal femur into slabs were performed. The lesions seen with CT were attempted validated by histology, and a high correlation was found. The OCT trait is the total score of OC assessed on the medial and lateral condyles at the distal end of both the humerus and femur of the right and left leg based on images from CT; hence, evaluation was conducted on eight anatomical locations for each boar. For each location, a score between 0 and 5 was assigned (Supplementary Figure S3), based on the assessment scale described by Aasmundstad et al. (Reference Aasmundstad, Kongsro, Wetten, Dolvik and Vangen2013), and all animals were judged by the same trained assessor.
Statistical analyses
For the OCT, FPAS, FFLK, FKNE, FSTA, HSTA, HSTU, HITO, HPAS, WADL, ARCH and DIPP traits, log transformations of phenotypes were attempted, but the distributions still did not pass the normality test. Therefore, the untransformed records were the basis for the analyses conducted in this study, with Supplementary Figure S4 showing the histoplots of the traits in the study.
The estimation of (co)variance components was carried out using bivariate animal genetic models. The DMU 6.7 software package (Madsen and Jensen, Reference Madsen and Jensen2008) was used, more specifically the AI-REML algorithm within the software, whereas the asymptotic standard errors of the estimates were computed from the inverse AI matrix.
For all the traits related to conformation characteristics, the following model was used:
 $$y_{{ijklmn}} ={\rm parity}_{i} {\plus}{\rm HY}_{j} {\plus}{\rm YS}_{k} {\plus}{\rm pen}_{l} {\plus}{\rm animal}_{m} {\plus}{\rm error}_{{ijklmn}} $$
For all y’s, parity (parity of dam) included three classes (i=1, 2, 3 or a higher parity), whereas for HY (herd of origin and year of birth) j=158 levels for all conformation traits except for arched back (j=57 levels). For YS (year and season of birth) k=25 levels for all conformation traits except for arched back (k=7 levels). Parity, HY and YS were treated as fixed effects, whereas the effect of pen, animal and error were treated as random effects.
For the OCT trait, the following model was fitted:
 $${\rm OCT}_{{ijklm}} ={\rm parity}_{i} {\plus}{\rm HY}_{j} {\plus}{\rm YS}_{k} {\plus}{\rm animal}_{l} {\plus}{\rm error}_{{ijklm}} $$
For OCT, i has three levels, j has 125 levels and k has 18 levels. All these effects were treated as fixed in the model, whereas the animal genetic effect and error were treated as random effects. For both models, additive genetic effects were expected ~
 $$N\left( {{\bf 0},{\bf G}\,\otimes\,{\bf A}} \right)$$
and both the pen and residual effect was expected
 $$N\left( {{\bf 0},{\bf R}\,\otimes\,{\bf I}} \right)$$
, where A is the additive relationship matrix, G is the additive genetic (co)variance matrix, I is an identity matrix of dimension equal to the number of animals with phenotypic records and R is the residual (co)variance matrix. In the models, parity would account for the differences in the phenotypic level seen between parities, whereas the effect of HY in the two models accounted for the variation seen in the herd level for each year. The effect of YS would account for the effects in environment within the season of a particular year. These fixed effects would correct the data for the differences in, for example, lactating level and maternal ability related to parity and in flooring, feeding, and management in the herd and season where the boars were born.
To create the genetic correlation matrix, a total of 66 bivariate analyses were performed. In the bivariate analyses, the covariances between the pen effects were set to 0 because of low and non-significant estimates. The phenotypic correlations presented are calculated on the basis of the (co)variance components from the bivariate analyses following the formula
 $$r_{p\,1,2} =\surd h\,_{{\rm 1}}^{{\rm 2}} {\times}\surd h\,_{{\rm 2}}^{{\rm 2}} {\times}{\rm }r_{{g\,1,2}} {\plus}\surd\left( {1{\minus}h_{1}^{2} } \right){\times}\surd\left( {1{\minus}h_{2}^{2} } \right){\times}r_{{e1,2}} $$
Genetic trends for HSTU, HPAS, FPAS, WADL and OCT
EBV were the output from the bivariate DMU analysis between the specific trait and the OCT. The EBVs for animals born after 2008 were based on the phenotypic records of the boar and his relatives, whereas the EBVs from boars born before 2008 were calculated based on their relationship with animals with phenotypic records born after 2008. The traits were all part of the breeding goal by 2012, but were not simultaneously included in the breeding goal. Before 2007, a penalty score based on the exterior assessment was the trait in the breeding goal, together with a breeding value for OC based on phenotypes from a half-sib test. In 2007, the breeding value for HSTU was included in the breeding goal with a weight of 3%, whereas in the years to follow, the penalty score was gradually replaced by FPAS, FKNE, HPAS, HITO, HSTU, DIPP and OCT. As with the breeding goal update in 2012, 11% of the weights in the breeding goal were divided on these traits, whereas the remaining 89% of the weights in the breeding goal were divided on the traits for production, slaughter quality, meat quality, litter size and robustness. For robustness, the conformation and OCT traits are weighed together with presence/non-presence of cryptorchidism, scrotal and umbilical hernia, and arthritis. Shoulder wound and body condition score at weaning of litter are also part of the robustness trait and recorded on a four-point and nine-point scale, respectively.
For all analyses, a pedigree file containing 13 796 animals was used (>7 generations).
Results
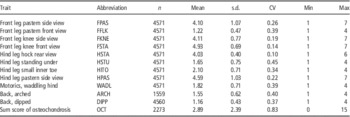
Descriptive statistics for the traits in the study are listed in Table 1. The minimum and maximum values were used for all traits except HSTA, as a pronounced bowed leg was not seen. The highest OCT value was 15, although the highest possible value was 40. In this study, the averages show that HITO and FSTA were the two traits that deviated the most from the desired value. All traits on the seven-point scale had an average within 3 to 5 (correct±1 point). However, the variation for these, expressed as CV, reveals that FPAS and HPAS express more phenotypic variance compared with HSTA and FSTA. For the traits assessed on a four-point scale, a similar picture can be seen. HITO exhibited an average score exceeding >1 point over the ‘correct’ value (1) of the trait. HSTU expressed the greatest variation (CV=0.45), whereas DIPP expressed the least variation (CV=0.37) of all these traits. In addition, over 90% of the boars in the study had signs of OC at one or more locations (OCT>0). The average for the trait was 2.89, whereas the phenotypic standard deviation was 2.39. Supplementary Figure S4 shows that the majority of the animals had an OCT score of <6 and this indicates that the majority of the boars had minor lesions, as the OCT is the sum score of eight locations and the maximum score that can be obtained is 40. However, a OCT score of 6 can be obtained in several ways, for example, a score of 4 on one location and a score of 2 on another location, or a score of 1 on six of the eight locations. The scoring is described in detail by Aasmundstad et al. (Reference Aasmundstad, Kongsro, Wetten, Dolvik and Vangen2013).
Descriptive statistics for the traits in the study; number of boars for each trait (n), average (mean), s.d., CV, minimum (Min) and maximum (Max) values

Heritabilities, phenotypic and genetic correlations
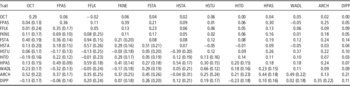
Estimates of heritabilities, as well as phenotypic and genetic correlations, are presented in Table 2. Phenotypic correlations are Pearson correlation coefficients derived from the SAS/STAT® statistical package. Phenotypic correlations were generally medium to low, with the highest between FPAS and FKNE, which was followed by FPAS and HPAS, whereas the negative correlations that were found were between −0.05 and −0.03. Phenotypically, there was a low correlation between exterior traits and OCT. The estimated genetic correlations are the results from 66 bivariate analyses in DMU, and of these, 18 correlations emerged as significantly different from 0. The strongest correlation was between FSTA and FFLK (0.94), which was followed by the correlation between FPAS and FKNE (0.69). The majority of the correlations between OCT and exterior traits were low and not significantly different from 0, although there were exceptions for ARCH and FSTA. As shown in Table 1, ARCH had a lower number of observations compared with the other exterior traits. Nevertheless, this trait had several medium strong correlations with other exterior assessment traits, although not all the correlations were significantly different from 0. Heritabilities were calculated through the use of a bivariate analysis between the exterior traits and OCT. The lowest heritability was found for FFLK, whereas FPAS was estimated to have the highest heritability, with OCT demonstrating a heritability of 0.29. The standard errors of the estimates were generally low (an s.e. between 0.02 and 0.06), and hence all heritabilities were significantly different from 0.
Heritabilities, genetic correlations and phenotypic correlations for the traits in the study; phenotypic correlations on the upper triangular, heritabilities on the diagonal and genetic correlations on the lower triangular; standard errors of genetic correlations in brackets
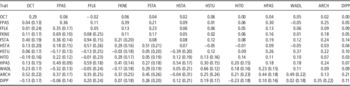
OCT=sum score of osteochondrosis; FPAS=front leg pasterns side view; FFLK=front leg pasterns front view; FKNE=front leg knee side view; FSTA=front leg knee front view; HSTA=hind leg hock rear view; HSTU=hind leg standing under side view; HITO=hind leg inner toe; HPAS=hind leg pasterns side view; WADL=waddling hindquarters; ARCH=arched back; DIPP=dipped back.
Genetic trends for HSTU, HPAS, FPAS, WADL and OCT
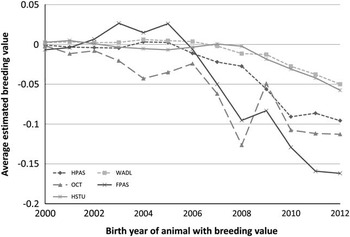
Genetic trends for the HSTU, HPAS, FPAS, WADL and OCT traits presented in Figure 1 are EBVs averaged over the birth year of the animals in the relationship file (animals with phenotype and their relatives). The EBVs are the output from the same bivariate DMU analyses as the variance components presented in Table 2. The EBVs for animals born before 2000 were not included in the analysis owing to a low number and distant relationship with the animals with phenotypes in our study. All traits revealed a favourable development in genetic trends after the inclusion of the traits in the breeding goal.
Genetic trends for the traits hind leg pasterns (HPAS), waddling hindquarters (WADL), sum score of osteochondrosis (OCT), front leg pasterns (FPAS) and hind leg standing under (HSTU).

Discussion
To the best of our knowledge, this data material is the first in which CT is used to carry out an in vivo measurement of OC, a procedure described by Aasmundstad et al. (Reference Aasmundstad, Kongsro, Wetten, Dolvik and Vangen2013). In vivo measurements facilitate the phenotyping of the selection candidates themselves, thereby increasing the accuracy of the EBV, which leads to increased genetic gain.
Before 2008, the Norsvin breeding programme included an OC assessment based on sectioning two joints and the macroscopic inspection of the slabs. The animals scored were half-sibs of boars in a boar test described by Gjerlaug-Enger et al. (Reference Gjerlaug-Enger, Aass, Odegard and Vangen2010). The phenotypes acquired were used for an estimation of an OC breeding value, and the trait was included in the breeding goal. However, the animals were not assessed for conformation traits before slaughter. After 2008, the half-sib test ended and the flow of OC phenotypes stopped until 2012, when an OC breeding value based on the OC measurements from CT was implemented in the breeding goal (Aasmundstad et al., Reference Aasmundstad, Kongsro, Wetten, Dolvik and Vangen2013). With the implementation of CT, the in vivo measurement of OC and conformation scoring can be acquired on the same animal, thus improving the accuracy of the selection. In addition, the assessment of OC based on eight locations yields more accurate phenotypes for OCT than the postmortem method, in which only one score for a leg was given. In addition, only the right-side legs were scored.
Exterior scoring system
The exterior assessment system in Norsvin is described in part by Grindflek and Sehested (Reference Grindflek and Sehested1996), and resembles systems described by van Steenbergen (Reference Van Steenbergen1989); Jørgensen and Vestergaard (Reference Jørgensen and Vestergaard1990) and Nikkilä et al. (Reference Nikkilä, Stalder, Mote, Rothschild, Gunsett, Johnson, Karriker, Boggess and Serenius2013b). However, direct comparisons of phenotypic levels are difficult as the selected phenotypes in our material are scored on a seven-point scale (Supplementary Figure S1) or a four-point scale (Supplementary Figure S2) depending on the trait, whereas the other studies used a nine-point linear scale (van Steenbergen, Reference Van Steenbergen1989; Nikkilä et al., Reference Nikkilä, Stalder, Mote, Rothschild, Gunsett, Johnson, Karriker, Boggess and Serenius2013b) and a four-point assessment scale (Jørgensen and Vestergaard, Reference Jørgensen and Vestergaard1990). In this study, the exterior traits assessed were FPAS, FFLK, FKNE, FSTA, HSTA, HSTU, HITO, HPAS, WADL, ARCH and DIPP. A low score for each trait is assumed to be more favourable compared with a high score, although a score of 4 is supposed to be desirable for the traits scored on a seven-point scale. For the FPAS trait, a softer pastern is the preferred direction for selection. The angle of the front leg pastern seen sideways (FPAS) is a trait mentioned by Miller (Reference Miller1977), Bereskin (Reference Bereskin1979) and van Steenbergen (Reference Van Steenbergen1989), with the first two suggesting that a sloping pastern is better compared with an upright pastern. Scored on a seven-point scale, the side view of the front leg knee (FKNE) is a trait reported by several authors (Van Steenbergen, Reference Van Steenbergen1989; Serenius et al., Reference Serenius, Sevón-Aimonen and Mäntysaari2001; Nikkilä et al., Reference Nikkilä, Stalder, Mote, Rothschild, Gunsett, Johnson, Karriker, Boggess and Serenius2013b). To the best of our knowledge, a front view of the pasterns in pigs has not previously been reported in the literature. Nevertheless, the same authors as above reported a similar trait called ‘legs turned out’ for the fore legs, which might be a combination of FFLK and FSTA in our analysis. For the hind leg, the four traits of HSTA, HSTU, HITO and HPAS were considered. HSTA has been described by both van Steenbergen (Reference Van Steenbergen1989) and Nikkilä et al. (Reference Nikkilä, Stalder, Mote, Rothschild, Gunsett, Johnson, Karriker, Boggess and Serenius2013b), whereas HSTU has been described by van Steenbergen (Reference Van Steenbergen1989), Jørgensen and Vestergaard (Reference Jørgensen and Vestergaard1990) and Nikkilä et al. (Reference Nikkilä, Stalder, Mote, Rothschild, Gunsett, Johnson, Karriker, Boggess and Serenius2013b). HITO has been described in all three references, whereas HPAS has been previously described by van Steenbergen (Reference Van Steenbergen1989), Jørgensen and Andersen (Reference Jørgensen and Andersen2000) and Luther et al. (Reference Luther, Schwörer and Hofer2007). Moreover, the locomotion pattern WADL was defined by van Steenbergen (Reference Van Steenbergen1989) and Jørgensen and Vestergaard (Reference Jørgensen and Vestergaard1990), whereas Nikkilä et al. (Reference Nikkilä, Stalder, Mote, Rothschild, Gunsett, Johnson, Karriker, Boggess and Serenius2013b) referred to ‘overall leg action’. Nikkilä et al. (Reference Nikkilä, Stalder, Mote, Rothschild, Gunsett, Johnson, Karriker, Boggess and Serenius2013b) also studied a trait termed ‘top line’, which resembles our ARCH trait. In 1977, ‘arched back’ was described by Miler (Reference Miller1977), whose proposal was that an ‘arched back’ is a result of an altered angle of the bones from the hip to hock. The trait ‘top line’ (Nikkilä et al., Reference Nikkilä, Stalder, Mote, Rothschild, Gunsett, Johnson, Karriker, Boggess and Serenius2013b) is probably a combination of ARCH and DIPP, as it referred to a ‘side view of the animal’s back’. DIPP is probably related to kyphosis, a trait studied by Holl et al. (Reference Holl, Rohrer, Shackelford, Wheeler and Koohmaraie2008). The scoring system used in the current study is linear, which is an advantage when the trait is used for selection purposes. Compared with systems in which several morphological traits are added into one trait, better control with the development of a broad range of specific traits can be achieved by our system of recording. However, the judging is time consuming and dependent on trained technicians, as is the case in all scoring systems in which many traits are included.
Heritabilities of the exterior assessment traits and OCT
Generally speaking, the estimates of heritabilities obtained for the exterior assessment traits are low to medium (h 2 FFLK=0.05, h 2 FPAS=0.36), which is in the same range as presented by van Steenbergen (Reference Van Steenbergen1989) and Serenius et al. (Reference Serenius, Sevón-Aimonen and Mäntysaari2001), although a bit lower than those reported by Jørgensen and Andersen (Reference Jørgensen and Andersen2000). Among the traits in the study, FPAS was the most heritable (h 2=0.36), whereas FFLK was estimated to have the lowest heritability (h 2=0.05). The differences in heritabilities between different studies can be effects of the scoring systems, but can also be owing to the fact that this is a subjective assessment, as the variance in the phenotypes is dependent on the assessor. The heritability of OCT (h 2=0.29 (s.e.=0.06)) is within the range reported by Aasmundstad et al. (Reference Aasmundstad, Kongsro, Wetten, Dolvik and Vangen2013), which is as expected as the data material is overlapping. As a consequence of the relatively low heritabilities, a selection based on EBVs for exterior and OC is expected to yield substantially more genetic progress compared with a phenotypic selection.
Phenotypic and genetic correlations between exterior assessment traits and OCT
Traits scored on the seven-point scale (Supplementary Figure S1) are assumed to be ‘correct’ in the middle with unwanted deviations on either side, whereas traits scored on the four-point scale (Supplementary Figure S2) assume deviations on only one of the sides. For all traits, including OCT, a selection towards a lower value is preferred. For OCT, this turns into a selection for less abnormal cartilage. The phenotypic correlations found in this study generally indicate low correlations between exterior assessment and OCT in contrast with a study by de Koning et al. (Reference de Koning, van Grevenhof, Laurenssen, Ducro, Heuven, de Groot, Hazeleger and Kemp2012), who found a non-linear phenotypic relationship between OC in the elbow and a steep or weak pastern. This trend was not found in our material, in which low phenotypic correlations were estimated between exterior traits and OCT, as well as among the exterior traits. However, the results for the estimated genetic correlations of the overall picture are more diverse. Most genetic correlations among the exterior traits are small to medium, and most are favourable. A high genetic correlation (r gFFLK,FSTA=0.94) was found between the FFLK and FSTA traits, indicating that this might be the same trait. Nonetheless, the phenotypic correlation between FFLK and FSTA is moderate to low, indicating that the technician sees this as two traits. Similarly, the medium-to-high correlation (r gFPAS,FKNE=0.69) between FPAS and FKNE might indicate that both correlations can be results from specific anatomical structures; a stable FKNE and a soft FPAS could be a result of the deep flexor tendon being too long or too tensile. This tendon stretches from the elbow (ulna) all the way down to the digits (Nickel et al., Reference Nickel, Seiferle, Wilkens, Wille and Frewein1986), and if this tendon is too tensile it can stretch and leave the animals with soft pasterns and a sable knee. On the contrary, a too short or too rigid flexor tendon can lead to a bucked knee and upright pasterns as seen in foals (Ross and Dyson, Reference Ross and Dyson2011). Another hypothesis would be that undesired exterior traits rise because of the shape of the bones involved in the joint. Such a hypothesis is not supported by us, as we experienced that the development of pastern angles from steep to sloping can occur within a week, particularly in periods of rapid growth. From our material, it seems as if all traits are more or less positively correlated. As a result, we would like to raise the concern that breeding too rapidly for softer pasterns could lead to more tensile tendons and connective tissue in the pig, and give rise to hypermobile joints. Our hypothesis is supported by the findings of Fan et al. (Reference Fan, Onteru, Mote, Serenius, Stalder and Rothschild2009b), who found an association between body conformation traits and several genes controlling collagen structure, which is the main component of the connective tissue. For example, the COL1A2 gene, encoding the collagen α-2 chain protein, was found to be significantly associated with front and rear pasterns in pigs (Fan et al., Reference Fan, Onteru, Mote, Serenius, Stalder and Rothschild2009b) However, several other genomic studies have also been conducted to detect major genes related to structural soundness (Fan et al., Reference Fan, Onteru, Nikkilä, Stalder and Rothschild2009a, Reference Fan, Onteru, Mote, Serenius, Stalder and Rothschild2009b and Reference Fan, Onteru, Du, Garrick, Stalder and Rothschild2011; Guo et al., Reference Guo, Ai, Ren, Wang, Wen, Mao, Lan, Ma, Brenig and Rothschild2009), and multiple genes seem to be involved. For feet and leg structural soundness, for example, a clustering analysis showed that significant genes were involved in a variety of functions such as bone and cartilage development, muscle development and insulin regulations (Fan et al., Reference Fan, Onteru, Du, Garrick, Stalder and Rothschild2011). In our study, ARCH is a trait with less phenotypic records. Even so, the trait is heritable (h 2 ARCH=0.13 (s.e.=0.05)) and the genetic correlations to the other exterior traits are medium and all in the same direction; pigs with a high score for ARCH are genetically disposed for other disadvantageous conformational features. This was most apparent for WADL, but HPAS and FPAS also expressed genetic correlations significantly different from 0. The OCT trait is medium correlated to FSTA and ARCH, whereas a genetic correlation between ‘front legs turned out’ and OC on humeral condyles on the Yorkshire breed has previously been documented (Jørgensen and Andersen, Reference Jørgensen and Andersen2000). Correspondingly, a smaller genetic correlation between ‘X-O posture at rear legs’ and lesions at the medial condyles of the humerus has been described (Luther et al., Reference Luther, Schwörer and Hofer2007). In addition, Lundeheim (Reference Lundeheim1987) found a moderate genetic correlation between ‘leg weakness score’ and OC at both the femur and humerus condyles, thereby suggesting that these traits are related, although the genetic correlation between ARCH and OCT in our material is perhaps less obvious. Phenotypically, an animal with an arched back often has other flaws in the exterior, as discussed in the section entitled ‘phenotypic correlations’. One might speculate whether the genetic correlation between ARCH and OCT is related to pain, and that a high score for ARCH is an indication that high scores of OCT are painful.
Genetic trends for HSTU, HPAS, FPAS, WADL and OCT
After the introduction of the specific conformation traits into the Norsvin breeding goal, genetic improvements in these traits has been seen (Figure 1). Apparently, the effect of selection has been largest for the traits with assessment on a seven-point scale, which is possibly owing to a larger genetic standard deviation. Nevertheless, significant changes can also be observed for WADL and HSTU, with both traits being assessed on a four-point scale. The findings in our study suggest that a selection for softer hind leg pasterns will ultimately lead to softer front leg pasterns as the genetic correlation in our material is 0.49 (s.e.=0.09). Furthermore, the changes in FPAS might be superior to those for HPAS, as the heritability for FPAS is almost double. This is supported by the genetic trends in Figure 1, as a larger genetic gain for FPAS seems to have been achieved when compared with HPAS, despite the earlier introduction of the HPAS trait and a higher weighing of HPAS. If breeding animals are subjected to a phenotypic threshold selection based on an expression of exterior traits, this would be a waste of potential genetic gain, as the heritabilities for the exterior traits are low. Our study demonstrates that an effective strategy for genetic improvement in the exterior traits of pigs should include the traits in a breeding goal. With this strategy, the independent culling of animals based on traits not included in the breeding goal can be avoided, and a higher genetic gain can be achieved. However, genetic changes for OCT and exterior traits in the population should only by prioritized in a breeding goal if exterior traits are an indicator of the animal’s potential for a long and healthy production life.
Acknowledgements
This study is a part of a project funded by the Research Council of Norway and Norsvin (Norwegian Pig Breeders Association). The authors wish to express their gratitude to Prof. Nils Ivar Dolvik, Dr Jørgen Kongsro, Dr Peer Ola Hofmo and Dr Marte Wetten for their valuable discussion and input to the manuscript. We would also like to thank the technicians at the boar test station for their patience and valuable input.