Introduction
The glycophytic species rice suffers from severe yield reduction even at moderate soil salinity, a stress that exerts, drought stress, direct ion toxicity and nutritional imbalance on plants (Munns et al., Reference Munns, Husain, Rivelli, James, Condon, Lindsay, Lagudah, Schachtman and Hare2002, Reference Munns, James and Lauchli2006; Flowers and Colmer, Reference Flowers and Colmer2008; Horie et al., Reference Horie, Karahara and Katsuhara2012; Tari et al., Reference Tari, Laskay, Takács and Poór2012; Shahzad et al., Reference Shahzad, Zörb, Geilfus and Mühling2013). However, there exists natural variation for salt sensitivity in rice cultivars, a phenomenon that has been exploited to develop tolerant varieties (Collard et al., Reference Collard, Jahufer, Brouwer and Pang2005; Thomson et al., Reference Thomson, de Ocampo, Egdane, Rahman, Sajise, Adorada, Tumimbang-Raiz, Blumwald, Seraj, Singh, Gregorio and Ismail2010). The prerequisite is thus to identify the tolerant genotypes from the existing germplasms (Munns and James, Reference Munns and James2003; Flowers, Reference Flowers2004; Colmer et al., Reference Colmer, Munns and Flowers2005). In doing so, the indica rice had received more attention compared with japonica and wild rice, and indica rice was only comparative studied with either japonica or wild rice (Nakamura et al., Reference Nakamura, Murayama, Tobita, Bong, Yanagihara, Ishimine and Kawamitsu2002, Reference Nakamura, Agarie, Murayama, Tobita, Yanagihara, Kawamitsu and Motomura2004; Lee et al., Reference Lee, Choi, Ko, Kim and Gregorio2003; Awala et al., Reference Awala, Nanhapo, Sakagami, Kanyomeka and Iijima2010). Most critically, few tolerant cultivars have been identified from japonica and wild germplasms (Lee et al., Reference Lee, Choi, Ko, Kim and Gregorio2003; Awala et al., Reference Awala, Nanhapo, Sakagami, Kanyomeka and Iijima2010). Indeed, a comparative study involving the salinity response of indica, japonica and wild species of rice has never been reported until now.
Traditionally, phenotypic characterization and screening of genetic resources involve field trials where breeders select material for inclusion in breeding programmes. This is intensive of resource, and many conserved germplasm accessions remain uncharacterized and often unutilized. Also, often in crop genetics and breeding research, phenotypic data are collected; however, currently, much of the data generated are not made publically available (Zamir et al., Reference Zamir, Dias, Dulloo, Maxted, Kell, Thörn, Smith, Preston and Hutchinson2014). Further, genotype screening has often been based on scores for a single growth or physiological trait; however, continuous variation in such traits makes it difficult to clearly quantify genotypic differences (Zeng, Reference Zeng2005). Qualitative evaluation scores alone based on visual vegetative damage are useful for mass screening at the seedling stage, but not effective at lower levels of stress, because at low stress, the symptoms of damage such as leaf rolling and chlorosis are not always obvious (Gregorio et al., Reference Gregorio, Senadhira and Mendoza1997; Zeng et al., Reference Zeng, Shannon and Grieve2002). The lack of an effective screening method is, therefore, a major barrier to the identification of tolerant germplasm that could be used in breeding programs for developing tolerant varieties.
Our approach is to use critical statistical analyses of multiple variables that can be used to screen and identify genotypes responding in a similar manner to salt stress, subsequently facilitating appropriate selection of material to feed directly into breeding programmes. The comparison of previous results on the categorization of rice genotypes based on growth and ion accumulation parameters has separately indicated the possibility of some correlation between these separate categorizations (Zeng et al., Reference Zeng, Shannon and Grieve2002; Zeng, Reference Zeng2005). Our study is, therefore, aimed at the broad comparative evaluation of the level and mechanism of salinity tolerance in three groups of rice, namely indica, japonica and wild species, under moderate and high stress levels using multivariate analysis on combined growth, qualitative and physiological assessments as a novel screening approach that may pave the way for precise germplasm evaluation in future.
Materials and methods
Plant materials
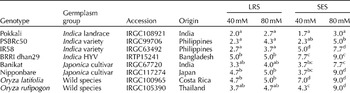
Seeds of four indica, two japonica and two wild rice accessions, obtained from the International Rice Gene Bank Centre (IRGC) of the International Rice Research Institute (IRRI), were used in this study. These genotypes consisted of landraces, cultivars, commercial varieties and wild species, and were chosen based on their diverse origins and various reputation of tolerance to salt stress (Table 1).
Salinity reactions of eight rice genotypes in terms of Leaf Rolling Score (LRS) and Standard Evaluation Score (SES) under moderate (40 mM) and high (80 mM) NaCl stress levels
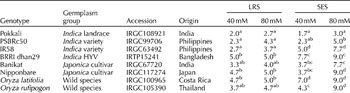
HYV, high yielding variety; IRGC, International Rice Germplasm Center; IRTP, International Rice Testing Program.
Data presented as the mean (n= 3) and unlike superscript letters in a column indicate significant differences at P≤ 0.05 by Duncan's Multiple Range Test.
Plant growth and culture conditions
Seeds were heat treated at 48°C for 5 d, then sterilized with 1% sodium hypochlorite and incubated on presoaked filter paper in a sterile petridish at 20°C for 48 h. Germinated seeds were transferred to test tubes filled with Yoshida nutrient medium (Yoshida et al., Reference Yoshida, Forno, Cock and Gomez1976) for seedling establishment for 7 d and then the seedlings were transferred to aluminium foil-wrapped 250 ml conical flasks. Individual seedlings were held in place using a sponge bung in each flask, and roots were suspended in nutrient solution. Flasks were maintained in a growth room with 16/8 h photoperiod, 28/20°C day/night temperature, 70–75% relative humidity and average 290 μmol/m2/s photosynthetic photon flux.
Experimental design and salinity treatments
Seedlings in flasks were challenged with 0, 40 and 80 mM NaCl in Yoshida nutrient medium (with additional CaCl2 added at a molar concentration ratio of 1:6) representing non-saline, moderate and high-salt stress, respectively, in a randomized complete block design with three replicates per treatment. Half-strength salt stress was applied at 13 d after emergence, and after another 24 h, the full-strength stress was applied. The pH of the nutrient solution was maintained at 5.0 on a daily basis, and the solution was renewed every week.
Plant measurements
Leaf (fully expanded 3rd leaf) Rolling Score (LRS) was recorded on the third day (after 8 h in light) of salt treatment on a scale of 1–5, with ‘1’ being fully expanded and ‘5’ fully rolled (Singh et al., Reference Singh, Singh and Chauhan2009). Leaf (3rd), root (seed to tip of the seminal root) and shoot (seed to tip of the longest leaf) lengths (mm) were measured daily at 3–6 DAS (days after salt treatment), and elongation rates (mm/d) were calculated over this period. Modified Standard Evaluation Score (SES) (Gregorio et al., Reference Gregorio, Senadhira and Mendoza1997) was recorded at 6 DAS on a scale of 1–9, with ‘1’ being scored for highly tolerant and ‘9’ for highly susceptible. Leaf area (cm2) was measured at 6 DAS using the ‘Length-width method’ (Yoshida et al., Reference Yoshida, Forno, Cock and Gomez1976). Transpiration rate/g dry weight (DW)/h was measured by estimating the reduction in mass per hour per unit (g) biomass at 7 DAS using a Sartorius balance (ED623S). Plants were harvested at 7 DAS, and after washing with de-ionized water, shoot and root tissues were separated and dried at 80°C for 48 h to record the biomass. Powdered shoot and root tissues were digested with 1M HNO3 at 80°C for 8 h and analysed for cations and anion concentrations (mmol/kg DW) using ion chromatography (Dionex® DX500; Dionex Corporation, CA, USA).
Statistical analysis
Analysis of variance (ANOVA) was performed on all measurements. Significant changes in individual tissue ions in treated versus untreated plants were analysed using a t-test. Differences between the means were determined using Duncan's multiple range test (DMRT). Pearson's correlation coefficient between the variables was computed to measure the degree of linear relationship between two variables. Principal component analysis (PCA) was performed with standardized data (mean subtracted from the variable and then divided by the standard deviation). Traits that were found to contribute more to the total variation among the genotypes in PCA were used for cluster analysis using squared Euclidean distance and Ward's complete linkage method. All analyses were performed using Minitab version 15 (Minitab Ltd., Coventry, United Kingdom) except Duncan's new multiple range test, which was performed using SAS statistical package version 9.2 (SAS Institute Inc., Cary, North Carolina, USA).
Results
Variability within and between genotypes, treatments and their interaction
Seedlings of rice genotypes varied in both inter- and intra-genotypically following exposure to moderate (40 mM NaCl) or elevated (80 mM NaCl) salt stress. Statistically significant differences were observed between the genotypes and between the interactions of genotypes and treatments for all traits except for transpiration rate and between the treatments except for shoot K+ (two-way ANOVA; Table S1, available online).
Growth characterization and qualitative assessment
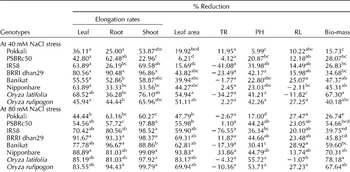
Leaf, root and shoot elongation rates were decreased at increased external salt in all genotypes; either Pokkali or PSBRc50 showed the least reduction and BRRI dhan29 showed the highest reduction at both salt levels (Table 2; Figs S1 and S2, available online). Banikat had the smallest reduction in root elongation rate at the higher salt level. Leaf area, plant height, root length and total biomass decreased with increased external NaCl in all genotypes except Oryza latifolia at both salt levels, and Nipponbare at high salt level showed a slight increase in root length. Pokkali showed the least reduction in all these parameters except PSBRc50 in leaf area at moderate salt level and Nipponbare in root length at high salt level. O. latifolia showed the highest reduction in all these parameters except Oryza rufipogon in plant height at moderate salt level and Nipponbare in leaf area at high salt level (Table 2; Figs S1 and S2, available online). The visual evaluation scores, SES and LRS showed significant variation in response to salt stress among the rice genotypes. Both SES and LRS increased with the increase in stress level, indicating greater susceptibility at higher stress level (Table 1). Under moderate and high salt levels, the indica cultivar Pokkali showed a higher degree of tolerance (SES = 1.67 and 3, respectively) followed by PSBRc50 (SES = 2.33 and 5, respectively). The indica variety BRRI dhan29 at both salt levels and the wild species at the high salt level were found to be the most susceptible. BRRI dhan29, Nipponbare and O. latifolia showed the highest LRS at high salt stress, while Pokkali showed the least at both the salt stresses (2.0 and 2.7 at 40 and 80 mM NaCl, respectively) followed by PSBRc50 (2.3) at moderate and IR58 (3.7) at high salt stress.
Genotypic variations in percent reduction of growth traits in rice seedlings at 40 mM and 80 mM NaCl stress
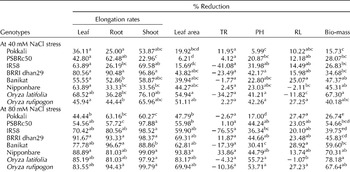
TR, transpiration rate; PH, plant height; RL, root length.
Data are presented as the mean (n= 3) and unlike superscript letters in a column indicate significant differences at P≤ 0.05 by Duncan's Multiple Range Test.
Physiological characterization with regard to tissue ion accumulation
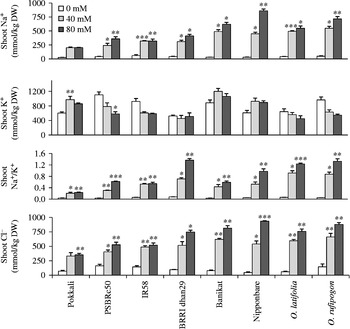
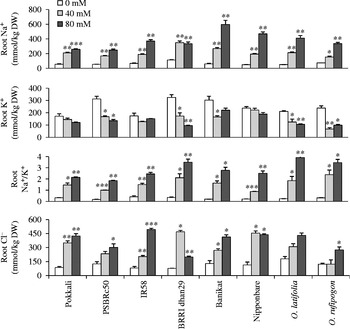
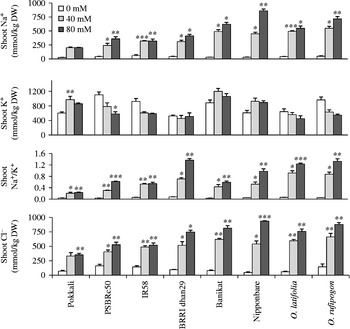
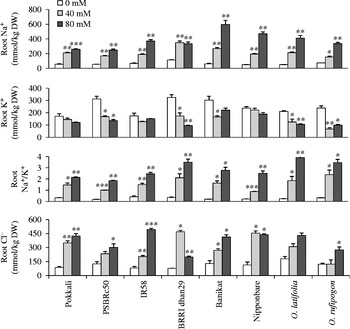
Na+ concentration and the Na+/K+ ratio in the shoot increased significantly at higher stress levels in the majority of genotypes (Fig. 1). At both moderate and high salt levels, Pokkali accumulated least Na+ (200.69 and 201.03 mmol/kg DW, respectively) and maintained lowest Na+/K+ (0.21 and 0.23, respectively) in the shoot followed by PSBRc50 (241.31 mmol/kg DW) at moderate salt levels and IR58 (318.86 mmol/kg DW) at high salt levels. Wild species O. rufipogon (548.05 mmol/kg DW) followed by O. latifolia (494.69 mmol/kg DW) accumulated the highest Na+ in the shoot at moderate salt level; at high salt level, however, Nipponbare (860.61 mmol/kg DW) followed by O. rufipogon (715.34 mmol/kg DW) showed the highest accumulation. Shoot Na+/K+ was highest in the wild species and BRRI dhan29 at both salt levels. Shoot K+ decreased in PSBRc50, IR58 and the wild species, and increased in Pokkali, Banikat and Nipponbare with the increase in stress level. However, only the increase in Pokkali and the decrease in PSBRc50 at high salt level were significant (Fig. 1). Root Na+ and Na+/K+ increased significantly with the increase in salt stress in all genotypes (Fig. 2). O. rufipogon accumulated the least root Na+ (153.40 mmol/kg DW); however, Nipponbare maintained least Na+/K+ (0.87) in the root at moderate salt level. At high salt level, PSBRc50 (247.26 mmol/kg DW) followed by Pokkali (257.95 mmol/kg DW) accumulated the least root Na+ and also maintained least Na+/K+ (1.84 and 2.14, respectively). BRRI dhan29 (347.83 mmol/kg DW) and Banikat (595.72 mmol/kg DW) accumulated the highest Na+ in the root at moderate and high salt levels, respectively. Like shoot Na+/K+, root Na+/K+ was also high in the wild species and BRRI dhan29 at both salt levels (Fig. 2). Pokkali was a moderate accumulator of root Cl−, but translocated least Cl− to the shoot compared with other genotypes (Figs 1 and 2). The situation was the reverse in O. rufipogon, which accumulated least Cl− in the root, but translocated highest Cl− in the shoot.
Genotypic differences in the concentrations of shoot Na+, K+, Cl− and Na+/K+ of 0, 40 and 80 mM NaCl stressed rice seedlings. Shoot tissue was harvested at 7 DAS and the chromatographic analysis was carried out using Dionex® DX500 system (Dionex Corporation, CA, USA). Data presented as mean ± SE (n= 3). Significant differences with control at P≤ 0.05, P≤ 0.01 and P≤ 0.001 are indicated by *, ** and ***, respectively, by Student's t-test.
Genotypic differences in the concentrations of root Na+, K+, Cl− and Na+/K+ of 0, 40 and 80 mM NaCl stressed rice seedlings. Root tissue was harvested at 7 DAS and the chromatographic analysis was carried out using Dionex® DX500 system (Dionex Corporation, CA, USA). Data are presented as mean ± SE (n= 3). Significant differences with control at P≤ 0.05, P≤ 0.01 and P≤ 0.001 are indicated by *, ** and ***, respectively, by Student's t-test.
Multivariate assessment of genotypic variability
There were significant differences between genotypes in their responses to salt over a range of parameters. The correlations between the parameters were measured, and it was observed that the tolerance parameters such as shoot Na/K, SES and LRS (which are significantly positively correlated within themselves) showed significant negative correlation with the growth parameters such as plant height, leaf area and total biomass at both salt stresses (Table S2, available online). It clearly indicates that shoot Na/K can be considered as the single-most important physiological parameter to study salinity tolerance in rice as it evidently restricts the plant growth.
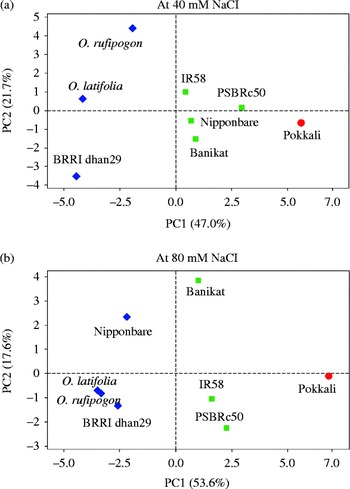
To determine which parameters were most influential, PCA was performed on the whole data set. Six principal components (PCs) with eigenvalues higher than unity were extracted and explained 99.1 and 97% of total variation among the eight rice genotypes at moderate and high salt levels, respectively. The first and second PCs accounted for 49 and 21.7% of total variation, respectively, at moderate salt level and 53.6 and 17.6%, respectively, at high salt (Table S3, available online). A scatter plot of the first and second PCs shows the distribution of the eight rice genotypes (Fig. 3). At both salt stress levels, PC1 has clearly divided the genotypes based on their tolerance status and at higher salt stress, PC2 has divided the genotypes based on their subspecies groups. The pattern of growth, qualitative and physiological responses of 40 and 80 mM NaCl stressed rice seedlings are shown in the scree plot and loading plot of PCs (Fig. S3, available online). Under both levels of stress, the trait biomass, SES, plant height, leaf area, shoot Na+/K+, LRS, shoot Cl− and root Na+/K+ contributed most in decreasing order towards the overall variability on PC1 (Table S3, available online).
Scatter plot of principal components (PCs) showing the relationships among four indica, two japonica and two wild rice genotypes based on principal component analysis (PCA) using fourteen growth, qualitative and physiological traits under (a) 40 and (b) 80 mM NaCl stress. PCA was performed with standardized data (mean subtracted from the variable and then divided by the standard deviation).
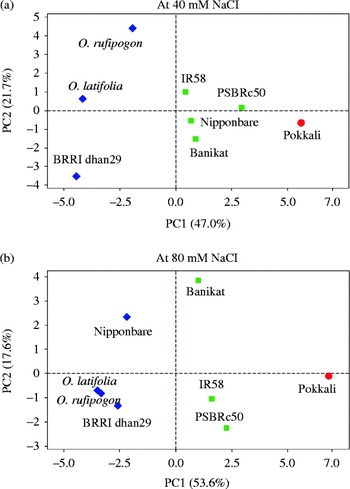
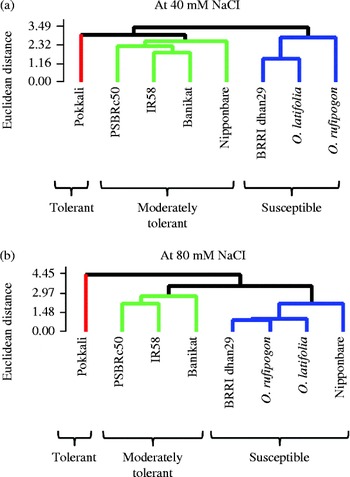
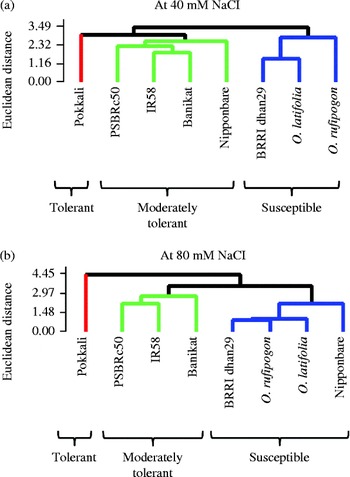
The PCA results were further corroborated by cluster analysis, which was done using the traits contributing most to the variation accounted for on PC1 and PC2. The clustering algorithm grouped the eight rice cultivars into three distinct groups at both moderate and high salt level (Fig. 4). The known salt-tolerant cultivar Pokkali emerged as the most distinct genotype, forming a distinct cluster at both moderate and high salt levels. The indica genotypes PSBRc50 and IR58 and the japonica genotype Banikat were found together in the same cluster at both moderate and high salt levels and can be categorized as moderately tolerant cultivars. Interestingly, at moderate salt level, the japonica cultivar Nipponbare was located within the moderately tolerant group, but at high salt level, it emerged as a highly susceptible genotype, which indicates that Nipponbare is tolerant only at moderate salt level. The indica genotype BRRI dhan29 and the wild species O. latifolia and O. rufipogon were always classified as susceptible genotypes. This can be linked back to the PCA shown in Fig. 3 where it was observed that PC1 that accounted for maximum variation within the genotypes separated the genotypes based on their ability to tolerate salt at both moderate and high stress levels. PC2, on the other hand, separated the Japonica genotypes from the indica and wild species at higher salt stress.
Cluster diagram showing the relationships among four indica, two japonica and two wild rice genotypes under (a) 40 and (b) 80 mM NaCl stress. Eight traits, namely biomass, standard evaluation score, plant height, leaf area, shoot Na+/K+, LRS, shoot Cl− and root Na+/K+ were identified as the most contributing towards the overall variability of the rice genotypes in principal component analysis and were used for cluster analysis using squared Euclidean distance and Ward's complete linkage method.
Discussion
Unlike previous studies, this study evaluated the comparative salinity tolerance of four indica, two japonica and two wild species of rice using growth, qualitative and physiological traits. Use of multivariate analysis allowed these parameters to categorize the genotypes based on their levels of tolerance and point the way towards a more informative and effective approach to genetically broad-based screening of rice genetic resources. Additionally, the approach was able to identify some unexpected responses of some genotypes to salt stress.
Contrasting genotypic differences were observed in response to salt stress. According to SES and LRS, the indica genotypes Pokkali and PSBRc50 showed more tolerance than the two japonica genotypes, and BRRI dhan29 followed by the wild species was most susceptible. Similar trends were observed for percent reduction in leaf, root and shoot elongation rates. At the higher salt level, all the genotypes except Pokkali and PSBRc50 showed over 80% reductions in leaf, root and shoot elongation rates. Since growth of rice has been reported to adapt to the initial osmotic stress within 24 h of salt stress imposition (Yeo and Flowers, Reference Yeo and Flowers1986; Yeo et al., Reference Yeo, Lee, Izard, Boursier and Flowers1991; Munns, Reference Munns2002; Colmer et al., Reference Colmer, Munns and Flowers2005; Flowers and Colmer, Reference Flowers and Colmer2008; Munns and Tester, Reference Munns and Tester2008), the reduction in growth rate at 3–6 DAS can be attributed to the toxic effects of salt build-up. On this basis, Pokkali and PSBRc50 showed greater resistance, a conclusion further strengthened since Pokkali, and PSBRc50 along with the other indica genotype IR58 had the lowest reduction in leaf area, plant height and total biomass.
The concentrations of shoot Na+, K+ and their ratio are important physiological traits for studying salinity tolerance (Lee et al., Reference Lee, Choi, Ko, Kim and Gregorio2003; Kader and Lindberg, Reference Kader and Lindberg2005; Zeng, Reference Zeng2005). Shoot Na+ was increased at the higher stress level and varied between the genotypes. In general, indica genotypes accumulated less Na+ in the shoot, followed by wild species and japonica genotypes. Among the indica genotypes, Pokkali took up less Na+ in the shoot, an observation consistent with the suggestion that at these salt concentrations, Pokkali employs ‘Na+ exclusion’ mechanism of salt tolerance by restricting the uptake of Na+. Similar observation of ‘Na+ exclusion’ mechanism (Moradi et al., Reference Moradi, Ismail, Gregorio and Egdane2003; Ren et al., Reference Ren, Gao, Li, Cai, Huang, Chao, Zhu, Wang, Luan and Lin2005; Kavitha et al., Reference Kavitha, Miller, Mathew and Maathuis2012; Platten et al., Reference Platten, Egdane and Ismail2013) and several genes for Na+ exclusion such as HKT1;4 and HKT1;5 (HKT = high-affinity K+ transporter) was identified in Pokkali (Davenport et al., Reference Davenport, James, Zakrisson-Plogander, Tester and Munns2005; Horie et al., Reference Horie, Hauser and Schroeder2009). In Pokkali, the concentrations of Na+ in the root and shoot were similar; however, the concentration of K+ was higher in the shoot than in the root that helped to maintain a low Na+/K+ ratio in the shoot (Figs 1 and 2). This observation suggest towards the possibility that Pokkali also employs the ‘ion balance’ mechanism of salt tolerance. It is, however, not clear if the higher concentration of K+ in the shoot is due to increased translocation of K+ to the shoot or due to the inhibition of K+ efflux from cells/tissues of the shoot. The other indica genotypes such as PSBRc50 and IR58 did not accumulate more K+ in the leaf, but maintained low Na+/K+ by restricting uptake of Na+ in the shoot. In contrast to Pokkali, ‘Na+ exclusion’ is the only mechanism of salinity tolerance employed by these indica genotypes. Japonica genotypes Banikat and Nipponbare showed elevated level of Na+ in the shoot compared with indica genotypes, but were able to maintain low Na+/K+ ratio by translocating more K+. High accumulation of Na+ into leaves of Nipponbare was also reported previously (Haq et al., Reference Haq, Akhtar, Nawaz and Ahmad2009; Yamamoto et al., Reference Yamamoto, Sawada, Shim, Usui and Fujihara2011), and the existence of Na+ exclusion mechanism in Nipponbare is confirmed very recently (Cotsaftis et al., Reference Cotsaftis, Plett, Shirley, Tester and Hrmova2012; Platten et al., Reference Platten, Egdane and Ismail2013; Li et al., Reference Li, Tang, Hu, Yu, Liu and Xu2014). In addition, the rice gene OsHKT2;1 (OsHKT = Oryza sativa high-affinity K+ transporter) has been reported to mediate Na+ influx in Nipponbare (Horie et al., Reference Horie, Costa, Kim, Han, Horie, Leung, Miyao, Hirochika, An and Schroeder2007).
Previous studies using different japonica varieties reported that japonica rice lacked the mechanism for higher uptake of K+ and that the trait would need to be transferred from indica varieties to achieve salinity tolerance (Lee et al., Reference Lee, Choi, Ko, Kim and Gregorio2003). The current data, however, identifies elevated level of K+ occurring within the japonica subspecies, suggesting that tolerance mechanisms can vary among varieties even within a particular subspecies. This strongly supports the need for enhanced germplasm screening that is precise and high throughput. Our data indicate that ‘tolerance’ does not necessarily need to be transferred via indica× japonica crosses, but can be achieved more easily by crossing within japonica.
PCA was undertaken to determine the overall variation among the rice varieties and to identify combinations of traits that contributed most towards salinity tolerance. Extracting trait combinations using a multivariate approach can facilitate subsequent investigations integrating whole genome expression patterns under salt stress (Pandit et al., Reference Pandit, Rai, Bal, Sinha, Kumar, Chauhan, Gautam, Singh, Sharma, Singh, Gaikwad, Sharma, Mohapatra and Singh2010; Cotsaftis et al., Reference Cotsaftis, Plett, Johnson, Walia, Wilson, Ismail, Close, Tester and Baumann2011; Baisakh et al., Reference Baisakh, RamanaRao, Rajasekaran, Subudhi, Janda, Galbraith, Vanier and Pereira2012; Cuin et al., Reference Cuin, Zhou, Parsons and Shabala2012). Pokkali diverged from all other varieties in the PCA and formed a distinct group at both moderate and high salt levels. The separation can be attributed to the low reduction in biomass, plant height, leaf area and low shoot Na+/K+, and the variety is categorized as the most tolerant among the eight studied varieties. Pokkali is known as the benchmark landrace for salinity tolerance (Yeo et al., Reference Yeo, Yeo, Flowers and Flowers1990; Gregorio et al., Reference Gregorio, Senadhira, Mendoza, Manigbas, Roxas and Guerta2002; Thomson et al., Reference Thomson, de Ocampo, Egdane, Rahman, Sajise, Adorada, Tumimbang-Raiz, Blumwald, Seraj, Singh, Gregorio and Ismail2010) and identifying it as a tolerant genotype using multivariate approach based on multiple growth and physiological parameters confirms the effectiveness of such approach in precise screening of germplasm.
The indica genotypes PSBRc50 and IR58 and the japonica variety Banikat were all found to be in the same cluster at both moderate and high salt levels and were categorized as moderately tolerant cultivars. It is noteworthy that, at moderate salt level (40 mM NaCl), the japonica cultivar Nipponbare was located in the moderately tolerant group; however, at high salt level (80 mM NaCl), it had moved to the susceptible group. This is explained by the greater decrease in percent reduction in shoot elongation rate, leaf area, plant height, biomass and greater increase in shoot Na+, Na+/K+ and shoot Cl− under high stress level compared with moderate stress. It is not clear whether this represents a qualitative difference in the salt response of this variety or whether the other genotypes studied would show a similar pattern if tested against even higher salt levels. This response to salt stress has not previously been detected in this widely studied variety, and further extensive and statistically robust research may be required to reconfirm the current findings.
The indica genotype BRRI dhan29 and the wild species O. latifolia and O. rufipogon were grouped in the third cluster as susceptible genotypes under both moderate and high salt stress. However, this classification contrasts with the finding of Nakamura et al. (Reference Nakamura, Murayama, Tobita, Bong, Yanagihara, Ishimine and Kawamitsu2002) where O. latifolia (IRGC100965) was classified as tolerant. The difference between the conclusions of the two studies may be due to the difference in the way treatments have been applied; the Nakamura group stressed plants at 68 d compared with 10 d in the present study, consistent with tolerance arising later in development in this wild species. In addition, the Nakamura group determined salt tolerance solely on survival, whereas the current study combined multiple growth and tissue ion traits analysed with multivariate analysis. Our classification of O. latifolia along with BRRI dhan29 and O. rufipogon as susceptible indicates that they may not be useful germplasm sources for breeding programmes for salt tolerance, and once again indicates a need for precise and wider screening of genetic resources in order to improve the efficiency of breeding programmes (Mackill et al., Reference Mackill, Ismail, Kumar and Gregorio2012). In terms of O. rufipogon, this contrasts with the findings of Tian et al. (Reference Tian, Tan, Liu, Cai and Sun2011) who have found three quantitative trait loci (QTL) for salinity tolerance. However, their assessment of tolerance and the identification of QTL were only based on relative biomass-related traits, whereas we are suggesting the precise and holistic screening of genotypes based on multiple morphological, qualitative and physiological assessments using multivariate analytical approach.
Conclusion
In conclusion, we have been able to identify different mechanisms of salt tolerance operating among diverse germplasm of rice, that varieties do not necessarily express tolerance or susceptibility consistently between different levels of salt stress, and that in this particular case, wild species of Oryza do not hold value for improving crops' tolerance to salt stress, indicating wide crossing with indica subspecies varieties or wild species is not always necessary to transfer tolerance into new varieties of japonica subspecies. We propose that to come to such conclusions, new evaluation methods including multivariate approaches need to be employed as demonstrated in this study, and on a wider scale than has previously been the case (Ford-Lloyd et al., Reference Ford-Lloyd, Schmidt, Armstrong, Barazani, Engels, Hadas, Hammer, Kell, Kang, Khoshbakht, Li, Long, Lu, Ma, Nguyen, Qiu, Ge, Wei, Zhang and Maxted2011). We also suggest that as the salinity tolerance picture is clearly complex, for future identification and analysis of the QTLs and genes that may be interacting to confer salinity tolerance by way of whole genome expression studies (Flowers and Colmer, Reference Flowers and Colmer2008; Mian et al., Reference Mian, Senadheera and Maathuis2009; Deyholos, Reference Deyholos2010), dissection of that complexity using multivariate analysis techniques will be essential.
Supplementary material
To view supplementary material for this article, please visit http://dx.doi.org/10.1017/S1479262115000118
Acknowledgements
This research was sponsored by The Commonwealth Scholarship Commission in the UK. We thank Dr Glenn Gregorio and Flora de Guzman (IRRI) for providing the rice seeds and Dr Gillian Kingston (Facility for Environmental Nanoscience Analysis and Characterization, University of Birmingham, UK) for technical assistance with the ion analysis.
Author contribution
M. R. H., J. P. and B. V. F.-L. jointly conceptualized and designed the project. M. R. H. has conducted all experiments, generated and analysed the data and prepared the draft script. J. P. and B. V. F.-L. supervised the work, interpreted the results and finalized the manuscript.
Conflict of interest
The authors declare that they have no conflict of interest.