IntroductionFootnote 1
Life should begin with age and its privileges and accumulations, and end with youth and its capacity to splendidly enjoy such advantages. (Mark Twain, Reference Twain1901)
The reversal of the life cycle yearned for here by Mark Twain will unfortunately never be more than a dream. And yet the concept of ‘active ageing’ actually satisfies a substantial portion of this vision. How can labour market policy help to improve the quality of life in the sense intended by Mark Twain? We argue that people's possibilities for participating in working life for as long as they wish and their opportunities for combining paid work with other self-determined activities are essential elements of a good quality of life. A policy that fostered these possibilities and opportunities would also make a contribution to efforts to cope with the challenges of employment and the pensions crisis. However, we consider the latter as important side effects rather than as the main objective of ‘active ageing’. On the contrary, in the tradition of Transitional Labour Market theory, we are opposed to the exclusive focus on incentives for older persons to continue working, which are found, for instance, in many OECD documents (for example, OECD, 2005a: 18). What we are much more interested in is increasing the range of options available during the transition from the ‘second’ to the ‘third’ phase of life.
We first present the theory of Transitional Labour Markets (TLM), from which we derive normative criteria for ‘active ageing’. We then explain why and under which conditions more employment for older persons can help to improve their quality of life. Our second step begins with a brief review of the employment situation of older workers (aged 55–64) in the different European countries, so as to be able to identify what precisely might be required at the level of labour market policy. We then systematically discuss – on both the supply and demand sides – which factors might be responsible for the significant variation in the employment of older workers across Europe. This section ends with a simple statistical model to test the explanatory value of the factors that promote and inhibit employment. In our third step, we provide examples of good practices and, in conclusion, sum up some general strategies for ‘active ageing’.
‘Active ageing’ and transitional labour markets
This section will examine ‘active ageing’Footnote 1 against the background of the theory of TLM and social risk management (Schmid, Reference Schmid, Schmid and Gazier2002, Reference Schmid2006). We cannot discuss the theoretical concepts in any detail here, but we can single out those aspects that are relevant for the questions we pose in this paper. Transitional labour markets designate critical phases in an individual's working life that denote either the beginning or the suspension of continuous employment and therefore require a profound adjustment of the labour contract so that a (new) employment relationship can start, or an existing one either be maintained under special conditions, be combined with other useful (unpaid) activities or be (gradually) terminated in favour of retirement. In particular, transitional labour markets regulate the interface between employment and social security in the event of transitions from education to employment, from one job to another, from unemployment to employment, from private activities to gainful work and, finally, from employment to retirement.
Specific risks are associated with each of these transitions. First, the risk of inadequate or eroded income capacity over the life cycle; second, the risk of income volatility due to fluctuating demand or transitions between various employment relationships; third, the risk of limited income capacity due to social obligations; fourth, the risk of occasional total loss of income due to involuntary unemployment (that is, of limited but uncertain duration); and, fifth, the risk of permanently reduced or zero income capacity due to disability, chronic illness or old age. So far there is nothing new here. However, the theory of TLM and social risk management insists on considering these life-course risks as partially new risks that require a recalibration of existing institutional arrangements.
TLM theory proceeds on the assumption that the dynamics of transitions on modern labour markets are becoming increasingly complex. For example, the transition from education to employment is becoming both a more long-winded and a more complicated process. The road to a young person's first ‘real’ job is increasingly paved with internships, contracts for services and spells of short-term employment. Increasingly, too, people's working careers encompass phases of unemployment, if often only of a short-term nature. Many older workers have entered early retirement: a trend that has only been halted recently and partially. A growing number of older workers are now switching to jobs offering much lower salaries, or are gradually entering retirement, or are even returning from retirement to working life in pursuit of a meaningful activity or a welcome additional income (Maltby et al., Reference Maltby, de Vroom, Mirabile and Overbye2004).
Working life is therefore often no longer characterised by linear employment careers but instead by discontinuity or even chaos. This means – as paradoxical as it may sound in the current age of mass unemployment – that the major risk of the future will not be that of unemployment (that is, temporary total loss of income), but that the other income risks will come increasingly to the fore (cf. Rigg and Sefton, Reference Rigg and Sefton2006). However, people are either not or are only inadequately or improperly insured against these other risks in the employment biography.
The course for an individual's future income, status, career opportunities and social security is set, in particular, during critical events and transitional phases of working life. The TLM theory follows three normative criteria in assessing whether the course is set in a way that will result in a positive or in a negative dynamic of transition:
• First, not maximisation of economic benefit but expansion of individual options in accordance with the concepts of empowerment, ability and motivation.
• Second, equality and solidaristic risk-sharing between the sexes and between and within generations and regions.
• Third, effectiveness and efficiency in accordance with the insights gained from modern theories of governance, especially their indication of the need for mixed practices of governance in the form of negotiated flexibility and security as well as public–private partnerships.
How can these abstract principles be applied to the problems deriving from the new labour market dynamics and then be translated into practicable strategies? In the following, we present just a few examples.
The criterion of the expansion of individual options would be satisfied if institutional and financial incentives to enter retirement early and abruptly were disposed of and instead investment was made both in ability to work and ability to employ.Footnote 2 In terms of ‘active ageing’, this means enabling older people to undergo further training or even to retrain for a second or third career. But it also means offering possibilities for modifying working hours or for switching to less demanding work should productivity decline. On the enterprise side, this means, first and foremost, obtaining the necessary scope to make new contractual arrangements, and – in the event that adjustment measures are required – being able to count on support from representative associations or from the state. Support in this sense would encompass both the transfer of knowledge on good practice from other enterprises and the guarantee of a level playing field as to standards of quality and safety.
The criterion of equality and solidaristic risk-sharing requires balancing cost- and benefit-sharing both between and within the generations. The fulfilment of this postulate of justice is an extremely demanding requirement. Here, we can only briefly sum up the reasons behind the normative assumptions we have made (Schmid, Reference Schmid2006). First, we are opposed to the utilitarian assumption of maximisation of happiness for all, preferring Rawls' (Reference Rawls1990) difference principle, according to which inequality is justified only when it improves the lot of the neediest. Second, we extend this assumption in the sense of an ethics of responsibility (Dworkin, Reference Dworkin2000) by the principle of individual responsibility under conditions of equally distributed resources. Third, we emphasise individual differences in the ability to use material resources for fulfilling personal life plans, which may also call for differences in endowment with resources (Sen, Reference Sen2001). Finally, we proceed from the assumption that the increasing interdependence between economic and social action also requires a spatial expansion of the principle of inclusion: in other words, an expansion of solidaristic risk-sharing communities beyond ethnic, regional and national boundaries (Ferrera, Reference Ferrera2005).
Under these premises, the question arises as to whether labour market risks are still fairly distributed in the family formation phase, especially since discontinuous employment histories are concentrated among women. Two issues associated with women's employment and equality between the sexes are relevant for an analysis of ‘active ageing’. First, as a consequence of the close link between social security for older people and employment, the uneven distribution of labour market risks to the disadvantage of women is propagated in old age in the form of unequal autonomous insurance rights. The solution applied to date of compensating for such insurance gaps by granting derivative rights is inconsistent with the premise of independent insurance in old age. Second, new jobs could be created through the externalisation of services that women provide within the family (for example, care-giving) and these could potentially also be open to older workers.
The ‘ageing’ of society also represents a threat to generational justice. If longer life expectancy and low birth rates change the old-age dependency ratio, then in a pure pay-as-you-go system, the younger generations will be disadvantaged by rising contribution rates. When contribution rates increase, the ability of enterprises to provide employment decreases because of the rising non-wage costs, and a vicious circle develops that ultimately jeopardises the social security of the future generations in general. Here, generational justice demands a regulation of financing systems, for example by converting systems that up to now were mainly benefit-driven (guaranteeing a defined level of security) into contribution-driven systems (in which benefit levels are based on the inflowing contributions).
The criterion of efficiency states that there are different types of transition risks that require different types of risk management. This rule is violated, for example, when early retirement is financed through unemployment insurance, although the retiree is not obliged to be available to the labour market. TLM theory also states, however, that these different insurance systems must be complementary and attuned to and coordinated with each other. Finally, TLM theory points out that failure to overcome critical events early on in the employment career has an effect on the entire subsequent work biography. Labour market policy must, then, also be life-cycle policy. The problem is not that people are living longer. On the contrary, the increase in life expectancy is also an opportunity for new markets and associated new employment, especially in the areas of social infrastructure, personal services and environmental protection, which are decisive for improved quality of life in all age brackets. Labour market policy should therefore be geared much more towards prevention and investment than has been the case to date.
Armed with this framework of criteria we can now ask: What are the conditions of ‘active ageing’ seen from the point of view of labour market policy?
Challenges and determinants of ‘active ageing’ in Europe
Initial pointers can be gleaned from a systematic country comparison and the main challenges that can be derived from it. The next question, then, is how to explain the astonishing differences in the actual labour force participation of older people (aged 55–64) so as to gain an idea as to where promising policy measures might start. Finally, we use a simple statistical model to assess the explanatory value of an aggregate index of factors that promote and inhibit employment on the basis of data from 18 EU member states.
Labour force participation of older workers in European comparison
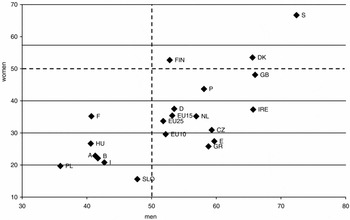
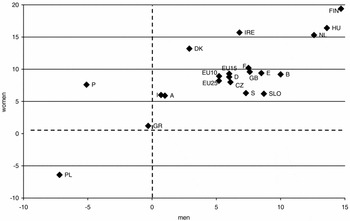
As the comparison of the labour force participation of older people in the EU member states shows, ‘active ageing’ represents a bigger challenge for some countries than for others (see Figure 1). If we look only at the men, many countries – especially those of Scandinavia, and Ireland and Great Britain – have already achieved the European Employment Strategy's Lisbon target of an employment rate of 50 per cent.Footnote 3 It is mainly the continental countries (France, Belgium, Austria and Italy) and the new member states (Poland, Hungary and Slovakia) that lag behind with respect to this indicator. With the exception of a few countries (Poland and Portugal), the downward trend in the employment rate of older men seen in the 1970s and 1980s turned around again at the beginning of the new millennium. The countries that have made the most progress since the launch of the Lisbon Strategy are Finland, Hungary and the Netherlands.
Employment rates of men and women aged 55–64, 2005.
Notes: EU–10: Average for the countries that joined the EU in 2004; EU–15: Average for the EU countries prior to enlargement in 2004; EU–25: Average for all EU countries.
Source: Eurostat.

However, the European perspective also shows that ‘active ageing’ in the sense of greater labour force participation is especially underdeveloped among women (see Figure 1). At the same time, the female employment rate is rising in all member states – except for Poland – and particularly rapidly in Finland, Hungary and the Netherlands. It is striking that the increases in the employment of women and men go hand in hand (see Figure 2). There is no question of women replacing or displacing men (or vice versa). On the contrary, there must be economic powers at work or political-institutional reforms must have taken place that promote employment growth among both sexes at the same time.
Change in the employment rates of older men and women aged 55–64, 1997–2005 in percentage points.
Notes: Data for EU–10: 1998, without Malta and Cyprus. Data for Czech Republic, Hungary and Slovakia: 1998.
Source: Eurostat.

Determinants of the labour force participation of older workers
What are the causes of these differences between countries and the two sexes? From the TLM point of view, this question can be narrowed down to the scope for action enjoyed by those offering labour and those looking for it. What draws people into gainful employment (‘pull factors’) and what (prematurely) squeezes them out (‘push factors’)? Given the immensely complex bundle of potential determinants, we concentrate on those factors that appear to be central from the perspective of our normative frame of reference. Although not all factors easily fit the dichotomy of push and pull factors, we wish to stick to it as a valuable framework for our analysis.
The first pull factor that comes into mind is labour demand. The higher the demand induced by economic growth, the higher the demand also for older people. If one takes into account that spatial mobility declines with age, then jobs offered should be within the local reach of older people. Moreover, one has to think of the kind of work that suits older people most. Hard physical work such as that required in coal mining or manufacturing is not compatible with the physical capabilities of many older people. Labour demand in education, health and social work, in other community services and in private households, therefore, should be favourable to the employment of aged workers. This demand factor will have a second pull effect. The availability of these services on the market will allow women, especially, to leave or to stay on the labour market since they will now be able to buy services – by means of either cash or taxes – that they would otherwise provide themselves. To represent this complex demand factor in the model (see below), we selected value added in the areas of education, health and social work, community services and private household services measured as a share of GDP.Footnote 4 This share ranged in 2002 from a maximum value of 17.7 per cent in Denmark to a minimum value of 9.5 per cent in Slovakia. In order to incorporate its particular significance, the demand factor enters the model doubly weighted.
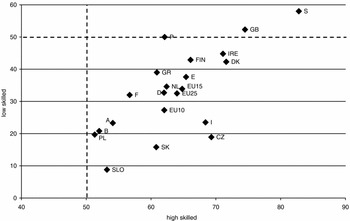
Education is the second most important factor pulling people into gainful labour market work. Empirical evidence shows that in the group of the highly skilled, all EU member states have surpassed the Lisbon goal of 50 per cent employment among older people.Footnote 5 About 85 per cent of highly skilled older men and women in Sweden are still working. In Germany and in the Netherlands, the figure is about 65 per cent. For the low-skilled, however, only Sweden, the United Kingdom and Portugal surpass the Lisbon goal. Even Finland, the model country for ‘active ageing’, has to do some catching up if it is to surpass the Lisbon benchmark of 50 per cent. Thus, mainly low-skilled workers have problems reaching the envisaged retirement age of 65 (see Figure 3).
Employment rates of older workers by level of qualification aged 55–64, 2005.
Data: 2nd quarter of 2005; low skilled: ISCED 0–2, high skilled: ISCED 5–6.
Source: Eurostat.

We consider the share of people in the age group 55 to 64 and with tertiary education as a valid indicator for the complex causal relationships that represent the mix of factors pulling high-skilled people into employment: skill requirements, non-pecuniary rewards of work and economic incentives (that is, rising wages with formal skill levels, and late entry into the labour market demanding a longer stay in order to fulfil the time requirements of pension entitlements).
Since skills erode or are outmoded with age, they have to be refreshed or replaced regularly over the life cycle. The participation rate in continuous education and training is therefore another factor pulling older people into employment. Measured as the participation of 55–64 year-olds in further education, it varies in our sample member states from 43 per cent in Sweden to only 4 per cent in Italy, Portugal, Spain and Hungary.
Next, the TLM perspective requires both flexibility of work organisation and flexibility of social security arrangements to provide options for combining work with retirement. The proportion of older people working part time is probably the best available indicator that reflects both sides of the flexibility coin. Of course, part-time work is often contingent on income levels and might go hand in hand with high job insecurity and/or poor access to training.Footnote 6 However, starting from the normative assumption that there is a need to increase flexibility at the end of the working career, we believe that growing part-time participation is highly desirable. The variation in this measure is enormous across Europe. It ranges from 49 per cent of older people working part-time in the Netherlands to only 5 per cent in Greece. As is well known, the differences between men and women are even greater. The two main factors (among many others) explaining low part-time employment among men appear to be that they did not learn flexible employment patterns early on in their careers, and that they would have to accept losses in status or income.
This hypothesis is already corroborated by the fact that the share of part-time employment among older women is high where it is also high among other age groups (Netherlands, Germany, Great Britain and Portugal). This observation suggests that a systematic expansion of part-time employment or contractually agreed working-time variations during the employment biography helps to extend the scope for flexible employment relationships for older workers. In addition to the individual perspective, a high proportion of part-time workers overall also increases the ability of employers to employ older workers. The reason is that employers learn both to acknowledge the high productivity of part-time workers and to deal with the organisational complexities of part-time work.
Employability is another factor keeping older people in employment. The TLM perspective insists here especially on the availability of options for gainful employment outside the regular labour market. Such options have to be provided by proactive labour market policies either in the form of in-work benefits, in the form of jobs that are adapted to the capabilities of workers, or in the form of sheltered workplaces. We consider expenditure on active labour market policies (ALMP) other than training or placement measures a good indicator for such options. This indicator varies in our sample from 2 per cent of GDP in Denmark to 0.02 per cent of GDP in the United Kingdom.
Health conditions are an important push factor. With decreasing physical and/or mental ability to continue working, employees are often forced to exit the labour market. Since health conditions are difficult to measure, we take healthy life expectancy at the age of 60 as an appropriate surrogate variable. Low numbers, as in Hungary (14.1 years) or Poland (14.5 years), point at a strong inhibiting effect on work, while high numbers, such as in Spain (18.2 years) and Sweden (18.4 years), should be conducive to ‘active ageing’.
The decision for or against retirement depends also on job satisfaction. The more people like their jobs, the more they will stay in them for as long as possible. In 2003, the European Foundation for the Improvement of Living and Working Conditions provided such information according to age groups and gender for the first time for all 25 EU member states. Respondents were asked to indicate how satisfied they were with their jobs on a scale from 1 (not at all satisfied) to 10 (very satisfied). Older workers in Denmark turned out to be the most satisfied (8.6), while the Greeks ranked at the lower end (6.3).
In economics, relative wage costs are the central determinant that might push people out of employment. The higher the wages of older workers compared to younger workers, the stronger the probability that they will be dismissed or not hired if employers have to downsize their workforces. Of course, implicit contract theory has found good reasons for the efficiency of seniority wages: that is, wages rising from below to above the income capacity (or productivity) of workers. However, there are also arguments suggesting that the preconditions for seniority wage schedules are eroding. Thus, high wages for older people compared to young people (a reality that is especially pronounced in Belgium, France, the Netherlands and Spain) have to be considered as a factor that inhibits older people's employment.
Finally, taxes can also play a role pushing older workers out of the labour market. Romain Duval (Reference Duval2004) calculated the implicit tax rate with which workers are confronted when deciding between work and retirement. The higher the taxes on work income compared to transfers during retirement, the lower the probability of remaining in work. Five years before regular retirement, a Belgian earns 7 per cent more than his/her expected transfers in retirement, whereas a Swedish peer has 80 per cent more in his/her pocket. The impact of this tax wedge is very strong, and explains about one third of the declining employment rate of the older workers in OECD countries in the 1980s and 1990s. It functions like an early retirement trap, as demonstrated by this econometric study; it is therefore doubly weighted in the following model.
A model of the labour force participation of older persons
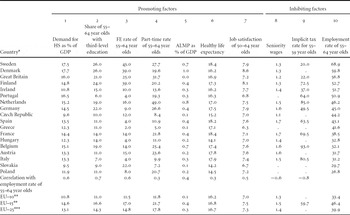
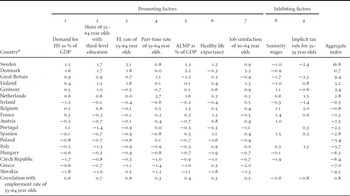
We can now sum up the factors that pull older workers into or push them out of employment.Footnote 7Table 1 enumerates the independent variables, while sorting countries according to the dependent variable – the overall employment rate of older persons in 2005 – as shown in the final column.
Factors pulling oldesr worker into (+) or pushing them out of (−) employment

Notes: *Countries ranked according to the employment rate.
** The calculation of the averages took only these countries into consideration.
*** Calculated as the weighted average of the values for the EU–10 and EU–15 countries.
1 Value added in the area of human services (HS) as % of 2002 GDP. Source: National Account Statistics, Table 2.1: Value added by industries at current prices, items: Education; health and social work; other community, social or personal services; private household with employed persons; Gross domestic product.
2 Third-level education is defined as ISCED 5–6 (International Standard Classification of Education, levels 5–6); Source: OECD, 2005b.
3 Further education (FE). Source: OECD, 2005b.
4 Part-time employment rates of older workers in 2005. Source: Eurostat (2006).
5 Spending on selected active labour market policy (ALMP) measures (see text) as % of GDP. Source: OECD Employment Outlook, 2006, Table H.
6 Healthy life expectancy weights the years of ill-health according to severity and subtracts them from overall life expectancy to give the equivalent years of healthy life (WHO).
7 Response to the following item: ‘Please tell me on a scale from 1 (very unsatisfied) to 10 (very satisfied) how satisfied you are with your job.’ Source: Quality of Life in Europe 2003, European Foundation for the Improvement of Living and Working Conditions, Dublin; authors' tabular evaluation of the survey results (provided by Prof. Jens Alber, WZB).
8 Wages of older workers (men) compared to wages of younger workers (men). Source: OECD (2006), Figure 3.5: Seniority wages and labour market outcomes.
9 This indicator is used to model the implicit taxation of older workers on the basis of early retirement regulations and occupational invalidity and pension systems. Source: Duval (Reference Duval2004).
10 Employment rates of older workers in 2005. Source: Eurostat.
It must be assumed that all of these factors interact with each other and do not operate in isolation. If, as a first step before creating a more complex model in the future, we proceed on the simplified assumption that this interaction is of an additive nature,Footnote 8 then we can use z scores to construct an aggregate index promoting ‘active ageing’ – via good-quality employment – as illustrated in Table 2. Sweden (16.8) and Denmark (11.7) move up to the top of the ranking, while Greece (–7.0) and Slovakia (–9.3) slip down to the bottom.
Z scores* and aggregate index of factors that pull older worker into (+) or push them out of (−) employment

Notes: *Countries ranked according to the aggregate index.
* Z = (x i −  /σ x i = Originalvalueforcountry, = meanvalueofsample, σ = standarddeviation
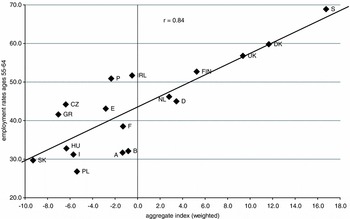
We are now in a position to test and make a first approximation of the explanatory value of the model.Footnote 9Figure 4 shows the simple bivariate relation between the aggregate index and the employment rate for older persons (aged 55–65). At 71 per cent of the variation (the squared value of r = 0.84), the explanatory value for the overall employment rate of older persons is satisfactory for this type of macro-institutional comparison. The explanatory value (not presented here due to limited space) for the employment rate of older women (r = 0.84) remains the same, explaining almost three quarters of the total variation. Only the explanatory value for the employment rate of older men is weak at 29 per cent of total variance (r = 0.54). It can be supposed that in the case of men the pull factors not included here of early retirement options – especially in industry and manufacturing (which vary sharply across the different countries) – and occasionally high unemployment rates substantially reduce the explanatory value of the model.

Risk management of transitions from employment to retirement
Using the aggregate participation index for older workers, we were able to identify the most important factors that influence ‘active ageing’ (see also Maltby et al., Reference Maltby, de Vroom, Mirabile and Overbye2004; Reday-Mulvey, Reference Reday-Mulvey2005; Walker, Reference Walker2002). In the following, we will assess the policy dimension by presenting good practices that reinforce or weaken some of the factors identified as promoters or inhibitors of ‘active ageing’. This section is structured on the basis of three main factors that either inhibit the participation of older people in the labour market or fail to promote their participation. First, the ‘culture of early retirement’; second, the direct or indirect (statistical) discrimination of older workers in the personnel and recruitment strategies of companies; third, the decline in productivity for health-related reasons. We attempt both to elaborate the incentives for increasing the supply of, as well as the demand for, older persons' employment, and to focus attention on political strategies for creating suitable incentive structures that correspond to the normative criteria laid out above.
Strategies for increasing and prolonging labour force participation
The ‘culture of early retirement’ is undergoing a paradigm shift whose basic features and most important characteristics are assumed to be familiar to the reader (cf. Ebbinghaus, Reference Ebbinghaus2006). This paradigm shift is not yet complete, however, so that a review of good practices can provide pointers as to how labour market policy for older workers could be strengthened for the future.
Reversal of the economic incentives so as to prolong working life
In the debate on pension reform, benefit cuts are among the most popular measures proposed with a view to rendering early retirement less attractive for older workers and therefore – it is hoped – less frequent. In a growing number of countries (1998 in Sweden and most recently in Belgium), this stick has been replaced by a carrot in the form of a pension bonus. Under these new regulations, every year worked beyond a certain age limit results in a supplementary increase in the individual worker's pension benefits. Whether the incentives will achieve the desired effect depends on different factors: the specified age limit, which varies between 60 years in France and 67 years in Greece; the amount of the incentive (11 per cent per annum in Estonia, 2 per cent to 3 per cent in Spain and France); and the progressive increase in the annual rates: that is, the relative gain per year of additional employment (for example, an increase of 1.5 per cent up to age 52, 1.9 per cent up to age 62 and subsequently 4.5 per cent in Finland, OECD, 2004: 11; Peters et al., Reference Peters, Dorenbos, van der Ende, Versantvoort and Arents2004: 215).
Externalising child-rearing and care-giving from the family
One of the possibilities for increasing the labour market participation of older workers (and especially of women) is to remove the exercise of care-giving activities from the domain of the family (cf. Daly, Reference Daly2002: 259).Footnote 10 Women who carry out care tasks during their working years often find it difficult to return to employment at an older age. Reforms therefore need to increase their room for manoeuvre in a permanent way. Esping-Andersen (Reference Esping-Andersen, Sassen and Esping-Andersen2006) shows that literally no woman must hold back her career in Scandinavia in order to look after her children or her relatives. In the Netherlands, by contrast, the burden of care tasks corresponds to a part-time job, while it corresponds to no less than a full-time job in Spain. In Denmark, around 3 per cent of GDP is spent on the full financial maintenance of care for older citizens at home or in residential facilities. In a model of this kind, therefore, the change in demographic structure generates more than only costs. New jobs are created in the service sector, and these in turn enable a greater number of people – mainly women – to participate in working life. As a consequence, personal income and pension rights increase, and the state takes in higher tax revenue.
Coordinating income security in old age with the risks of discontinuous work biographies
The risks associated with discontinuous employment careers must also be taken into consideration with respect to pensions and their financing. One option for reform is offered by ‘flexible entitlements’, which cover income losses, for example, during a phase of part-time employment or following a failed self-employment venture. The fundamental idea is to add a flexible component to every contribution made on the basis of actual income; this can then be used to maintain a stable level of social security contributions in phases of income loss. If an individual's employment career is continuous, this person will give up a share of the flexible entitlements to those who had to bear several of these risks.Footnote 11 The aim is to enable all individuals to enjoy sufficient income security in old age.
If, by contrast, the emphasis is on distributing income risks evenly across the individual life course, then it is good practice to calculate the pension on the basis of the longest periods of working life possible. The most interesting part of the Swedish pension reform of 1998 in this respect is the ‘lifetime income principle’, which applies both to the pay-as-you-go, income-related pension and the capital-funded premium pension (OECD, 2003). In Finland, the age span for the accrual of pension rights was extended in 2005 from age 23 to 65, to age 18 to 68. In addition, the amount of the pension is now no longer determined by the last ten years of contributions but by the entire employment career (OECD, 2004).
Finally, the Dutch government has adopted a regulation on tax-free working-time accounts with effect from 2006 (going beyond a precursory collective agreement). The workers can use these accounts to finance unpaid leave, parental leave or further education. Under the new regulation, 12 per cent of gross wages can be saved and the maximum time off has been increased from 2.1 years to 3 years at 70 per cent wage replacement. The lifetime working-time account can now also be used to supplement income in the event of early retirement (see Wotschack, Reference Wotschack2006). Moreover, the Dutch ‘life-course scheme’ is attractive in that its two-phase approach also satisfies the criterion of organisational efficiency stipulated above. General rules for the exit of older workers are negotiated at collective level and are legally binding. The details of implementation are then negotiated at sectoral or company level in accordance with the prevailing needs and conditions. However, criticism must be expressed regarding the way in which the tax incentives favour high incomes and the fact that the time saved up can be used simply as a means to early retirement. This incentive structure works against the spirit of ‘active ageing’.
Investment in sustainable employability for older workers
In the middle phase of working life, both employees and employers have an interest in further education because the horizon of expectation for the fruits of the investment is comparatively long. This interest diminishes on both sides with advancing age. Why, then, is the late phase of working life in the Scandinavian countries characterised by high levels of participation in further education? In Sweden and Denmark, this fact can be explained, on the one hand, by the higher employment rates found for older people, which lengthen the horizon of expectation and, on the other hand, by the fact that the state pays for further education pursued outside a worker's company. The risk of the investment is distributed evenly between the actors involved (enterprises, workers and the state).
A policy of state funding of training and further education not only helps to remove skill gaps but also expands the options of both individuals and companies. However, success is never guaranteed, as the example of Germany shows. In Germany, the further training costs of workers aged over 50 are reimbursed and employers receive a wage subsidy as compensation during the further training of an employee who is threatened with unemployment. But further training support has been little used to date because – apart from the fact that few people are familiar with the programme – employees and companies also have little practical experience with further education in the mid-life phase and because there is a general attitude in Germany that sees older workers as being less productive and in need of protection.
By contrast, a general qualification framework providing certifiable modular diplomas improves the effectiveness and efficiency of further training. In the Netherlands, the state-funded Competence Centre analyses and certifies the know-how of older workers in cooperation with an agency established for this specific purpose.Footnote 12 The Competence Centre accredits abilities and issues a positive valuation, thereby revealing skill gaps and laying the foundations for targeted further training.
Similarly, safe and healthy working conditions can be considered an important building block for sustainable employability. Again, Scandinavia provides examples of good practice. As early as the 1980s, the Work Ability Index (WAI) was established by the Finnish Institute of Occupational Health to assess the working ability of occupationally active people. A questionnaire that takes account of physical and mental job demands may be filled in by the workers themselves or by others (for example, by the occupational health physician during occupational health assessments).
Strategies for overcoming age discrimination
We argued at the beginning of this article that a fair and just policy must achieve a suitable balance between individual choice (responsibility) and external events (good or bad luck). If mutual dependencies and uncontrollable outside influences develop within a changing environment, then at the opposite pole the requirements for an inclusive policy will increase at the same time. In other words, anti-discrimination policy becomes more important wherever individuals are increasingly dependent on the functioning of the (labour) market.
Good practices in anti-discrimination policy can be found at different levels. In 2000, the European Community adopted Directive 2000/78/EC on equal treatment in employment and occupation, which is intended to protect all EU citizens against discrimination on grounds of sex, ethnic origin, religion, and also age. Although all member states were obliged to transpose the standards into national law by the end of 2003, the directive has still not been implemented by numerous countries (Commission of the European Communities, 2004).
Age discrimination is usually the result of the attribution of specific characteristics to older workers: for example, lack of motivation, low endurance and dwindling productivity. The Netherlands has tailor-made programmes intended to persuade employers to review their prejudices. One of the country's particularly promising regulatory instruments is the so-called ‘covenant’. The employers and employee representatives in a particular sector sign an agreement that stipulates the common challenges, the goals pursued, and the measures and approaches required. The government acts as an external monitoring agent and supporter of the self-commitments: for example, through privileged access to public resources or conferment of good reputation through rankings and good practice awards. A positive aspect that deserves highlighting is the fact that these self-commitments strengthen the involvement of the social partners, whereas the government's costs are limited to the creation of the framework and at most to the provision of kick-off financing (Korver and Oeij, Reference Korver and Oeij2005).
Strategies for reducing retirement transitions on the basis of disability or health restrictions
Good practices for reducing transitions by older workers into disability retirement are identical in some respects to the examples we presented as a strategy for increasing and prolonging labour force participation. Depending on the nature of the regulations, transitions into disability and early retirement function according to the principle of communicating vessels. If, for example, the early retirement system is strictly regulated and overall unemployment is rising, then the number of persons entering disability retirement often rises, too. Two approaches for reducing abrupt and inflexible retirement transitions on grounds of disability deserve mention here.
The possibility of combining an invalidity pension with earned income increases the number of options open to the individual. In Sweden, the status of inability to work can be combined with gainful employment for up to three years, with the full pension being paid during the first three months, irrespective of the additional earnings received. In Germany, too, the right to a full or partial invalidity pension continues to apply in principle. This option gives older workers incentives to return to working life in accordance with their capabilities. The risk associated with the return to employment of subsequently becoming unemployed, or of not being able to earn a full wage after the claim to invalidity has been forfeited, is therefore diminished.
The invalidity insurance systems in Finland and the Netherlands create a link between the contributions due and the expected risks for a company. This closes off the possibility of externalising the costs. Dismissal on health grounds, for example, leads to higher costs for the remaining workers. In the final analysis – as impact analyses have shown (Koning, Reference Koning2004) – employers are more concerned about health and safety policy.
Thus far we have seen that the processes of reforms in favour of active ageing are just as important as the content of the policies. A few more observations on the necessary conditions for successful reforms will thus be presented briefly here. First, reforms have been particularly innovative and far-reaching wherever they were formulated in the context of tripartite negotiations. Strong social partners, therefore, must not necessarily be an obstacle to reforms, as illustrated by the much-vaunted examples of Denmark, Finland, Sweden and the Netherlands. The examples mentioned also show, however, that where dissent remains despite intensive negotiations, governments must then be able to take and implement independent and courageous decisions. This is shown not least by the example of Belgium.
Belgium has strong social partner organisations that traditionally have autonomous bargaining powers in many areas and are also involved in legislative processes concerning social policy. Similar to Germany, conflicting positions on the part of the Belgian social partners have led to extensive reform deadlock in the domain of pensions. Nonetheless, in 2006 an important step towards reform was made in the form of the Solidarité entre les générations law and the collective agreement of the same name (Hartlapp and Kemmerling, forthcoming).
This regulation represents good practice because it seeks to expand options. The strategies to increase and prolong labour force participation include incentives in the form of a pension bonus for years of employment over the age of 62, while possibilities for supplementing earned income with income from transfers have also been extended. The reform initiative came from the government, which began the debate in 2004 with consultations and a large tripartite conference. Even if the trade unions (as well as the employers) heavily criticised the role of the government, which – against Belgian tradition – had exerted pressure on the social partners, the fact is that the necessary reform process would not have come about without the government initiative. At the same time, the social partners were not only consulted throughout the entire process, but they now still remain responsible for the design of more detailed application guidelines, for example the definition of physically demanding activities.
Summary and conclusions for a strategy of ‘active ageing’
The possibility of continuing to work in the later phase of the life course is a central determinant of quality of life. This is true under conditions of substantial self-determination, good working conditions, variable working hours and possibilities for combining paid and unpaid work. The modernisation of the pension funds and the enhancement of competitiveness are at best necessary but not sufficient conditions for future viability. We thus examined some conditions beyond these narrow goals, which we can now sum up as a generalised conclusion regarding a strategy of ‘active ageing’.
The first important insight is that these conditions must not be sought mainly in the characteristics of the older workers (for example, their potentially dwindling productivity) but in the general economic parameters: first and foremost, the pace of employment growth in the service sector (this perspective is in line with research stressing the limits of personal discretion over retirement decisions, cf. Vickerstaff, Reference Vickerstaff2006). A policy that begins here – be it private or public, internationally competitive or sheltered services – contributes to resolving several interrelated problems.Footnote 13 It does justice to the increasingly limited mobility associated with ageing and creates the kind of infrastructure that allows young adults with children to reconcile their family life with their work. It opens up new job opportunities for older men who are physically not able to carry out demanding manual work, and it allows older women, whose employment rate is substantially lower than that of men, to participate more extensively and for longer periods in working life than to date.
The second important insight is that labour market policy for ‘active ageing’ must start much earlier than just with older workers. As both theory and European experiences show clearly, it is important within the context of ‘lifelong learning’ to offer further education opportunities in the middle phase of the employment career, when the horizon of expectation of the fruits of the investment is long enough to motivate both the enterprise and the employee. In addition to organisational deficits, financing instruments in this regard should guarantee fairly distributed risk-sharing and resolve the problem of the time gap between investment and benefit. The demand for an earlier start also applies to the management of discontinuous employment careers. Long-term interruptions of employment (usually by women) translate into long-term wage penalties in future employment, higher probabilities of sustained precarious employment careers and even ‘inactivity’ in advanced adulthood. ‘Active ageing’ policy is therefore also understood as a policy that reinforces ties to the labour market in critical phases of the employment biography. Moreover, every deviation from the ‘standard employment relationship’ still implies a risk with respect to continuous income flows, occupational careers and social security in old age. This acts as a massive deterrent to established employees taking such risks. To be considered worth the risk, transitions between standard and non-standard employment must be cushioned by active labour market policy and by private or collectively agreed arrangements that supplement unemployment insurance: for instance, earnings insurance, lifetime working-time accounts, or a combination of wages and income from transfers.
The third important insight is that it is not enough to manipulate single parameters (reducing labour costs for older workers through wage-cost subsidies, for instance) or to turn the regulatory steering wheel in what is considered to be the right direction (for example, by relaxing the law on dismissal protection or raising statutory retirement age). Our analysis clearly indicates that those countries that have been most successful to date have followed a comprehensive approach coordinating different areas of policy, interlinking supply and demand policies: in particular, starting ‘active ageing’ early on in the life course and aiming at achieving equality between the sexes.
The application of these strategies debunks two myths. First, the myth that older workers take jobs away from younger workers. Second, the myth that the productivity of older workers declines rapidly. A sustainable reform must, on the contrary, proceed strategically on the basis of the opposite assumption, namely that the productivity of younger and older adults is mutually complementary. Where the employment of older people has increased, so too has the employment of young people;Footnote 14 and the advantage held by one group with respect to formal knowledge is complemented by the advantage held by the other group in the realm of practical knowledge.
Acknowledgements
The authors would like to thank Eckart Hildebrandt, Andreas Mauer and Achim Kemmerling, as well as two anonymous referees, for constructive comments on earlier drafts of this paper; they are also grateful for the excellent research assistance provided by Jutta Höhne, Simone Modrack and Paula Protsch.