Significant outcomes
-
∙ We clarified structural abnormality associated with social communication and interaction (SCI) in schizophrenic patients.
-
∙ These regions were not necessarily the regions with disease-specific changes.
-
∙ These findings suggest a biological basis for the overlap between autism spectrum disorder (ASD) and schizophrenia.
Limitations
-
∙ We sampled chronic schizophrenia patients under medication.
-
∙ We did no found relationship between autistic-like traits and regional brain volumes in healthy subjects.
Introduction
Schizophrenia is a complex disorder characterised by symptoms such as hallucinations, delusions, disorganised communication, poor planning, reduced motivation, and blunted affect. Impairments in social communication and social interaction are common in schizophrenia, and numerous studies have shown impaired perception of emotional expressions in schizophrenia (see review; (Reference Edwards, Jackson and Pattison1,Reference Tremeau2)). Structural brain abnormalities, such as ventricular enlargement, total brain volume reduction, and deficits in brain volume in the frontal, temporal, and parietal regions, have been repeatedly reported in people with schizophrenia (for review see (Reference Ellison-Wright, Glahn, Laird, Thelen and Bullmore3–Reference Shenton, Dickey, Frumin and McCarley8)). One study showed a relationship between the Social Adjustment Scale (Reference Weissman, Prusoff, Thompson, Harding and Myers9) and the grey matter volumes of the cingulate cortex and parahippocampus in individuals at high clinical risk for psychosis characterised by attenuated positive symptoms, brief psychotic episodes that do not meet the diagnostic criteria for schizophrenia, or a combination of genetic vulnerability and functional decline (Reference Lincoln and Hooker10). Another study showed a significant negative correlation between the total score of an autism-spectrum quotient-questionnaire (AQ, (Reference Baron-Cohen, Wheelwright, Skinner, Martin and Clubley11)) and the grey matter volume of the left superior temporal sulcus in patients with schizophrenia (Reference Sasamoto, Miyata and Hirao12).
The Diagnostic and Statistical Manual of Mental Disorders, Fifth Edition (DSM-5; (13)) defines ASD as a neurodevelopmental disorder characterised by two domains: deficits in social communication and social interaction across multiple contexts, and the presence of repetitive or stereotypic behaviours. ASD is currently estimated to be present in ~1% of the adult population (Reference Brugha, McManus and Bankart14). Several lines of evidence have revealed substantial overlap between schizophrenia and ASD at the behavioural level (Reference Lugnegård, Hallerbäck and Gillberg15–Reference Rapin and Tuchman17), environmental risk factors (Reference Meyer, Feldon and Dammann18), the cellular level (Reference Fatemi19), and the brain morphological level, especially in the parahippocampal gyrus, posterior cingulate, and left thalamus (Reference Cheung, Yu and Fung20).
Some of previously established autism rating scales had been designed to establish ‘caseness’ in a clinical sense (i.e. for ruling in or out categorical diagnoses of autism), however, the adult version of the social responsiveness scale (SRS-A), a quantitative measure of autism that is sensitive to autistic traits and symptoms even under subthreshold conditions, has demonstrated the capability of estimating the severity of social deficits of ASD, patients with other psychiatric conditions, and normal controls (Reference Constantino and Todd21). The SRS-A has also demonstrated good cross-cultural validity for ASD assessment, and is widely used (Reference Bölte22). However, there were no studies focussing on ASD trait in schizophrenia and the relationship between brain structure and social responsiveness calculated by SRS-A. To further elucidate the structural basis of the social impairment in schizophrenia, we examined the relationships between autistic-like traits assessed with SRS-A and the regional grey matter volume in schizophrenia patients.
Materials and methods
Subjects
Subjects were 37 patients with chronic schizophrenia and 62 healthy subjects. The subjects overlapped with those in our previous report about autistic-like traits in patients with schizophrenia (Reference Matsuo, Kamio and Takahashi16). A consensus diagnosis by at least two psychiatrists was made according to the DSM-5 criteria (13), on the basis of unstructured interviews in addition to the Japanese version of the Mini-International Neuropsychiatric Interview (MINI (Reference Otsubo, Tanaka, Koda, Shinoda, Sano and Tanaka23,Reference Sheehan, Lecrubier and Sheehan24)), and information from medical records. Schizophrenic symptoms were assessed with the Positive and Negative Syndrome Scale (PANSS) (Reference Kay, Opler and Fiszbein25). Daily doses of antipsychotics, including depot antipsychotics, were converted to chlorpromazine equivalents using published guidelines (Reference Inada and Inagaki26).
Controls were interviewed for enrolment by a research psychiatrist using the Japanese version of the MINI. Participants were excluded if they had a prior medical history of central nervous system disease or severe head injury, or if they met the criteria for substance abuse or dependence. Those individuals who demonstrated a history of psychiatric illness or contact with psychiatric services were excluded from the control group. Individuals who had been given a clinical diagnosis of ASD or mental retardation were also excluded. Written informed consent was obtained for participation in the study. This study was approved by the ethics committee of the National Center of Neurology and Psychiatry, Japan.
Autistic-like traits assessment
The SRS-A is a quantitative measure of the autistic-like traits/symptoms of 19–59-year-old adults with modified wording of the original SRS (Reference Constantino and Gruber27), which was developed for 4–18-year-olds (Reference Constantino and Todd28). Similar to the SRS for children, each SRS-A item is scored on a four-point scale with total scores ranging from 0 to 195. Previous studies showed that the Cronbach’s α of SRS-A total score was 0.89 in the adults with ASD, and 0.84 in the adults with other mental disorders (Reference Bölte22), Cronbach’s α of SRS-A Japanese version was 0. 96 in the normative sample (Reference Takei, Matsuo, Takahashi, Uchiyama, Kunugi and Kamio29), and the overall test–retest reliability (Pearson’s r) for the SRS-A was found to be 0.64 (Reference Constantino and Todd28), then its reliability and validity for SRS-A have been confirmed across countries including our own Japanese version (Reference Bölte22,Reference Constantino and Todd28,Reference Takei, Matsuo, Takahashi, Uchiyama, Kunugi and Kamio29). It is known that SRS is generally unrelated to intelligence quotients in the normal range, and is sensitive to autistic traits and symptoms even under subthreshold ASD conditions (Reference Kamio, Inada and Moriwaki30). Further, SRS-A is not a self-administered questionnaire, but administered to either a family member or a close friend of the subject who knew the subject well enough to provide an accurate account of his/her behaviours, and therefore it is useful to estimate the subjects who lack insight, that is, they are unaware of their symptoms. Then, it is extremely useful for research purposes. SRS-A total scores are divided into the following five subscales: social awareness, social cognition, social communication, social motivation, and autistic mannerisms (Reference Constantino and Gruber27,Reference Constantino and Todd28). A recent study demonstrated that the SRS has a two-factor structure corresponding to the new DSM-5 – compatible subscales of SCI, which are created by summing the social awareness, social cognition, social communication, and social motivation subscales, and the restricted repetitive behaviour (RRB), renamed from the autistic mannerisms subscale (Reference Frazier, Youngstrom and Speer31). The AQ reflects only what can be considered ‘high level’ (i.e. compulsive behaviour) RRB, and AQ are limited in their sampling of RRBs (Reference Uljarević, Evans, Alvares and Whitehouse32). These two subscales of SRS-A were useful to estimate the severity of ASD main symptoms exactly. In this study, the Japanese version of the SRS-A (Reference Takei, Matsuo, Takahashi, Uchiyama, Kunugi and Kamio29) was administered not to the subjects themselves but rather to either a family member or a close friend of the subject who knew the subject well enough to provide an accurate account of his/her behaviours during the preceding 6 months.
Data acquisition and processing
Magnetic resonance (MR) studies were performed on a 1.5-T Magnetom Symphony scanner (Siemens, Erlangen, Germany) as described previously (Reference Ota, Sato and Ishikawa33,Reference Ota, Noda and Sato34). Briefly, three-dimensional T1-weighted images were scanned in the sagittal plane (echo time (TE)/repetition time (TR), 2.64/1580 ms; flip angle, 15°; slab thickness, 177 mm; matrix, 208×256; 1 NEX; field of view (FOV), 256×315 mm2; slice thickness, 1.23 mm), yielding 144 contiguous slices through the head. T1-weighted MR images were processed using Statistical Parametric Mapping 8 (SPM8; Wellcome Institute of Neurology, University College London, UK, http://www.fil.icon.ucl.ac.uk/spm) running under MATLAB R2013 (MathWorks Inc., Natick, MA, USA). The images were preprocessed using the VBM8 toolbox (http://dbm.neuro.uni-jena.de/vbm/), which is an extension of the unified segmentation model providing spatial normalisation, bias field correction, and tissue segmentation (Reference Ashburner and Friston35). Registration to the stereotactic space of the Montreal Neurological Institute consisted of linear affine transformation and nonlinear deformation using high-dimensional Diffeomorphic Anatomical Registration through Exponential Lie Algebra normalisation (Reference Ashburner36). The bias-corrected, modulated, and warped tissue maps were smoothed with an 6-mm full width at half maximum Gaussian kernel.
Statistical analysis
We first evaluated the differences in demographic and clinical characteristics between the patient group and healthy subjects by two-sample t-test. Then, we examined the correlation between the total and the subscales of the SRS-A, and total and the subscales of PANSS using Pearson’s correlation analysis. Bonferroni’s correction was used, and corrected p values <0.05 were interpreted as being statistically significant. These tests were performed with the SPSS software ver. 22 (SPSS Japan, Tokyo, Japan).
Statistical analyses for graphical images were performed using SPM8 software. Differences in grey matter volume between the patients and controls were assessed using the subjects’ age, and gender as nuisance variables. Relationships between the total and subdivided scales of SRS-A and grey matter volumes were also evaluated using the subjects’ age and gender as nuisance variables in healthy subjects and using subjects’ age, gender, duration of illness, and dose of the chlorpromazine equivalent antipsychotics in schizophrenia patients. Only differences that achieved a seed level of p<0.001 (uncorrected) and a cluster level of p<0.05 (uncorrected) were deemed significant.
Results
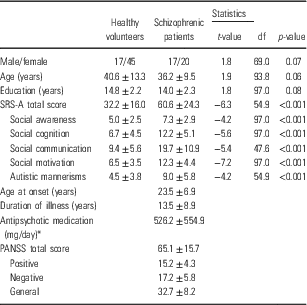
The demographic and clinical characteristics of the participants are shown in Table 1. There was no significant difference in age, gender, or education years between the patients with schizophrenia and controls. However, each SRS-A score of the patients with schizophrenia was higher than that of the healthy subjects (p<0.001, respectively). The Cronbach’s α of SRS-A total score was 0.82 in the patients with schizophrenia, and 0.83 in the healthy subjects. Kolmogorov–Smirnov test showed that the p value of the SRS-A total score in the patients with schizophrenia is 0.2, and p=0.2 in healthy subjects, and we checked the Gaussian-like distribution of the data. Within the patients with schizophrenia, there was no significant correlation between the total or any subscale score of the SRS-A and that of the total or any subscale score of the PANSS after Bonferroni correction. This indicates that these two measures assess relatively independent features of schizophrenia.
Demographic and clinical characteristics of the study sample

SRS-A, social responsiveness scale-adult; PANSS, positive and negative syndrome scale.
* Chlorpromazine equivalent.
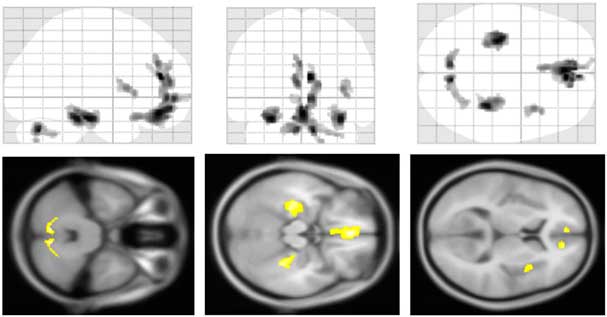
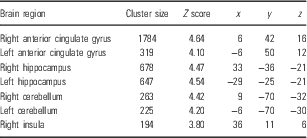
We compared the grey matter volumes of the patients with schizophrenia and healthy subjects, controlling for age, and gender. There were significant reductions in the grey matter volume of patients with schizophrenia in the ACC, bilateral hippocampi, cerebellums, and right insula, compared with healthy subjects (Fig. 1, Table 2).
Regional grey matter volume changes in schizophrenia. Patients with schizophrenia showed significant reductions of grey matter volume in the anterior cingulate cortex, bilateral hippocampi, cerebellums, and right insula compared with healthy subjects (p<0.001, uncorrected).

Regions of statistically significant differences between the patient with schizophrenia and healthy subjects

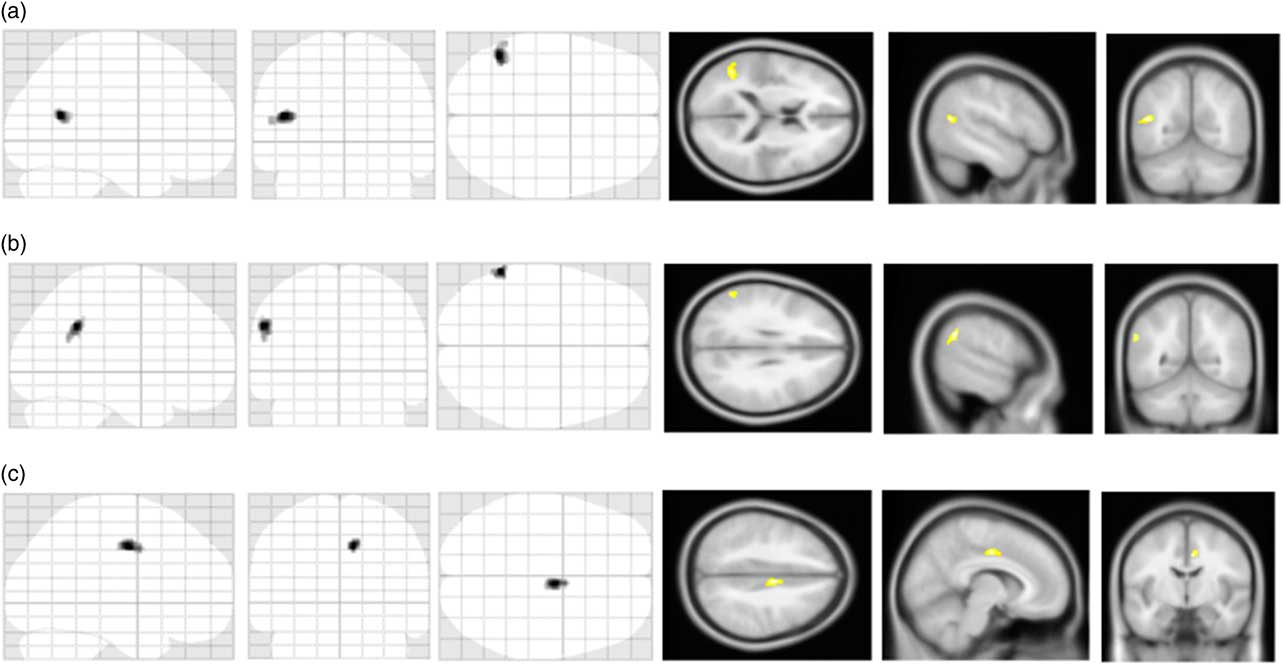
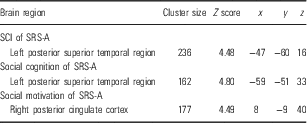
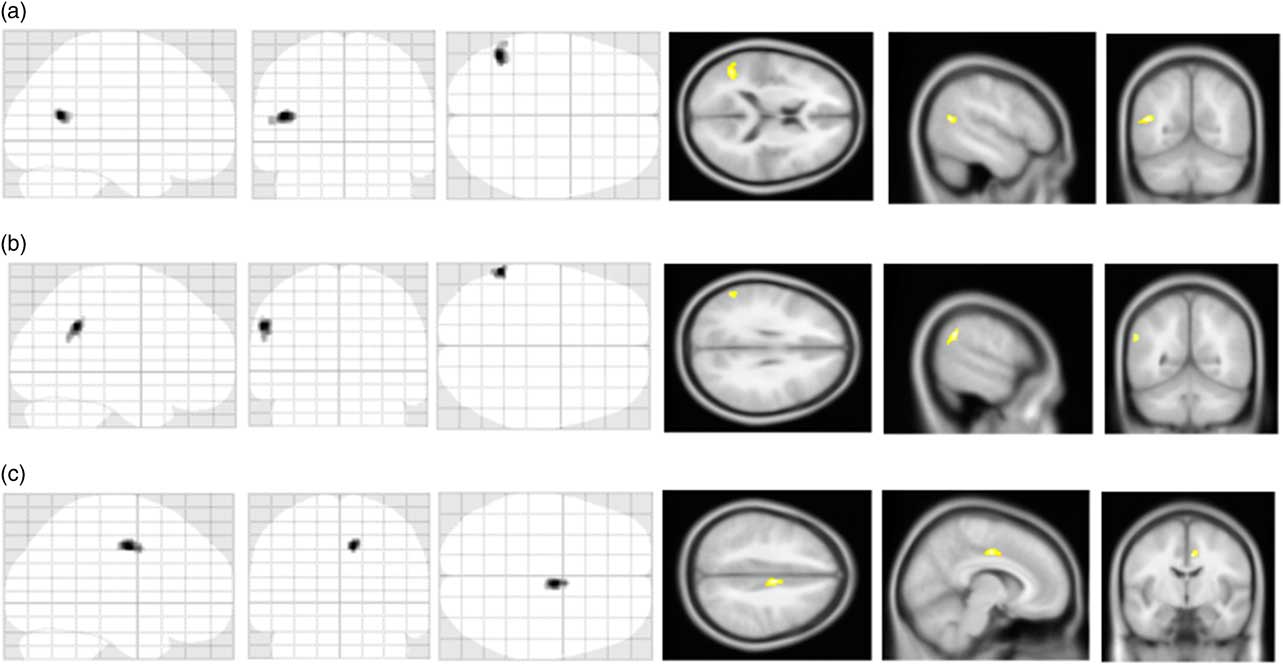
We then evaluated the correlation between the SRS-A scores and grey matter volume of the patients with schizophrenia. We first found a significant negative correlation between the SCI subscale score and the grey matter volume in the left posterior superior temporal region (Fig 2a, Table 3), while no correlation was found between the grey matter volume of any region and the RRB subscale score. Further analysis of the SCI – grey matter volume correlations revealed that there were significant negative correlations between the social cognition subscale score and the volumes in the left posterior superior temporal region (Fig. 2b, Table 3), between the social motivation score and the posterior cingulate cortex (PCC) (Fig. 2c, Table 3). The correlated regions shown in Fig. 2 were not the same as the regions with disease-specific changes shown in Fig. 1. There were no significant correlations between the metrics of SRS-A and the grey matter volumes of the healthy subjects.
Symptom-specific regional changes of grey matter volume in schizophrenia. In patients with schizophrenia, there were significant negative correlations between (a) the social communication and interaction (SCI) score and the grey matter volume in the left posterior superior temporal region; (b) the social cognition score and the grey matter volumes in the left posterior superior temporal region; (c) the social motivation score and the grey matter volume in the posterior cingulate cortex. In these cases, a seed level of p<0.001 (uncorrected) and a cluster level of p<0.05 (uncorrected) were adopted to indicate significance.
Regions of statistically significant negative correlations between the SRS-A scores and the grey matter volume of the patients with schizophrenia

SCI, social communication and interaction; SRS-A, social responsiveness scale-adult version.
Discussion
We evaluated the relationships between the regional grey matter volume and SRS-A scores in patients with schizophrenia. There were significant negative correlations between the regional grey matter volume and the autistic-like traits assessed by the SRS-A. Namely, significant negative correlations were detected between regional grey matter volumes and the SCI score, social communication, and social motivation; however, no such correlation was found with RRB, which a less socially oriented autistic-like trait. Recent study showed that SRS has a two-factor structure corresponding to the diagnostic criterion of ASD, SCI, and RRB, defined by DSM-5 (Reference Frazier, Youngstrom and Speer31). In other words, SRS could calculate these important subscales separately. To our knowledge, this is the first study to report associations between the autistic-like social traits calculated by SRS-A and grey matter volume using magnetic resonance imaging (MRI)-based voxel-based morphometry in patients with schizophrenia. These correlated region were not necessarily the region with schizophrenia-specific changes, nor the impairment of SCI were not necessarily the schizophrenia-specific symptoms. However, we reveal the relationship between the left posterior superior temporal gyrus and the severity of the SCI in schizophrenia, similar to those of ASD patients.
Our results demonstrated that the grey matter volumes in the posterior superior temporal gyrus, and the PCC were negatively correlated with the severity of social impairment assessed by the SRS-A. In addition, the grey matter volumes of the ACC, bilateral hippocampi, cerebellum gyri, and right insula were significantly lower in schizophrenic patients than in healthy subjects. Further, previous structural MRI studies focussing on ASD showed volume reductions in the PCC (Reference Cheung, Yu and Fung20), and posterior superior temporal gyrus (Reference Boddaert, Chabane and Gervais37). In consideration of all these findings, we assumed that some of the schizophrenic patients with high SRS-A scores showed brain changes similar to those of ASD patients. The posterior superior temporal region is thought to be associated with language processing in healthy subjects, particularly figurative language processing (for review see (Reference Bohrn, Altmann and Jacobs38)), and mentalising and related tasks (for review see (Reference Frith39,Reference Frith and Frith40)). Structural MRI studies focussing on the relationships between the regional brain structure and autistic-like traits in healthy subjects calculated by the AQ showed a significant correlation in the posterior superior temporal region (Reference Barnea-Goraly, Lotspeich and Reiss41,Reference von dem Hagen, Nummenmaa, Yu, Engell, Ewbank and Calder42). Further, a previous structural MRI study about the relationships between the AQ score and grey matter volume of schizophrenia also showed a significant negative correlation between the total AQ score and the left superior temporal sulcus volume (Reference Sasamoto, Miyata and Hirao12). We also found a negative correlation between the social motivation score and the grey matter volume in the PCC. Previous functional MRI studies on cognitive tasks have shown that the PCC is more often recruited during the decision-making process in healthy subjects, presumably to weigh extrinsic reasons for performing an action (Reference Fujiwara, Hirao and Namiki43–Reference Smith, Mitchell and Hardin45). Although our study employed structural MRI and behavioural assessment using the SRS-A, our results could identify brain alterations in chronic schizophrenic patients in the brain regions that are reported to be associated with various functions necessary for SCI in normal subjects. This point may provide supportive evidence of a shared pathophysiology between ASD and schizophrenia.
We found no correlation between the grey matter volume and the severity of social responsiveness in healthy subjects. Several previous studies have investigated potential associations between autistic traits calculated by AQ and regional grey matter volumes in healthy subjects, and reported relatively small associations between them (Reference von dem Hagen, Nummenmaa, Yu, Engell, Ewbank and Calder42,Reference Geurts, Ridderinkhof and Scholte46,Reference Saito, Suga and Tochigi47) or no differences (Reference Kosaka, Omori and Munesue48,Reference Watanabe, Nakamura and Ohno49), but these results did not converge to a consensus. Further, a large-sample study showed no relationship between them (Reference Koolschijn, Geurts, van der Leij and Scholte50). On the other hand, a few functional MRI studies have detected correlations between autistic traits and regional grey matter volumes (for review see (Reference Frith39,Reference Frith and Frith40)). In summary, the relatively weak autistic traits in healthy subjects are unlikely to be associated with marked structural alterations in the brain.
There were limitations in this study. First, we sampled chronic schizophrenia patients under medication. For this reason, the results in this study may not be generalised to the entire schizophrenia population, including first-episode drug-naive patients, especially as social dysfunction has been shown to be more significant in chronic schizophrenia than in first-episode drug-naive schizophrenia (Reference Altamura, Serati and Buoli51). Although we analyse the relationships between the scores of SRS-A and the regional volume controlling for the dose of antipsychotics, further studies with a larger sample including first-episode drug-free schizophrenic patients will be needed to resolve these issues. In addition, we analysed the correlation of each subscale separately, which could have enhanced the type 1 error. Finally, the number of participants was unbalanced. Further multiple regression model analysis with balanced sampling will also be needed.
In conclusion, we found a significantly negative correlation between the SCI score comprising the socially relevant components of the SRS-A, and the regional grey matter volumes in the left posterior superior temporal region. In addition, the SRS-A subscale scores for social cognition, and motivation were significantly related to regional grey matter volumes in the posterior superior temporal region and PCC, respectively, in patients with chronic schizophrenia. These findings suggest a biological basis for non-disease-specific social impairment in schizophrenics and offer new insight into the shared symptoms of ASD and schizophrenia.
Acknowledgements
Authors’ Contribution: Miho Ota designed the study and wrote the first draft of the manuscript. Junko Matsuo, Toshiya Teraishi, Hiroaki Hori, and Kotaro Hattori collected data. Noriko Sato, Yoko Kamio, and Hiroshi Kunugi managed the analyses. All authors contributed to and have approved the final manuscript.
Financial Support
This study was supported by an Intramural Research Grant (21-9, 23-25, 24-11) for Neurological and Psychiatric Disorders of the National Center of Neurology (K.H.). The funders had no role in the study design, data collection and analysis, decision to publish, or preparation of the manuscript.
Conflicts of Interest
The authors declare that they have no potential conflict of interest.
Ethical Standards
The authors assert that all procedures contributing to this work comply with the ethical standards of the relevant national and institutional committees on human experimentation and with the Helsinki Declaration of 1975, as revised in 2008.