1. Introduction
Crop genetic diversity, considered a public good (Bezabih, Reference Bezabih2008), is maintained through in situ (also known as on-farm) and ex situ conservation methods. In on-farm conservation, farmers maintain and evolve traditional crop varieties developed in their local conditions through their cultivation practices and selection efforts. Ex situ conservation involves maintaining crop varieties in purpose-built storage structures generally located at public research institutions. Though efficient, ex situ conservation is expensive and lacks the dynamic process of evolution in local environments. Also, seed varieties are not immediately accessible to farmers. Conversely, on-farm conservation contributes to higher crop genetic diversity over time and also empowers farmers to better control their crop genetic resources (CGRs) as both biological and livelihood assets (Sthapit et al., Reference Sthapit, Padulosi and Mal2010). Studies indicate that rich local crop diversity is maintained in regions when the private value of local landraces and the public value of genetic diversity are both high (Smale et al., Reference Smale, Bellon, Jarvis and Sthapit2004). For valuable CGRs to be maintained on-farm, they must be economically attractive to local populations.
Many public interventions aim to promote on-farm conservation, including improving access to markets. However, improving market participation can either encourage or discourage on-farm conservation of genetic diversity (Bellon, Reference Bellon2004). Economic incentives to produce a single, homogeneous variety can drive farmers away from on-farm conservation of crop-variety diversity when they become more integrated into the market.Footnote 1 Intensive production of a single variety often leads to higher returns and lower costs than producing multiple varieties (Bellon, Reference Bellon2004; Lipper et al., Reference Lipper, Dalton, Anderson, Keleman, Lipper, Leigh Anderson and Dalton2010). Thus, increased farmer-market integration can lead to losses in CGRs and varietal diversity (Lipper et al., Reference Lipper, Dalton, Anderson, Keleman, Lipper, Leigh Anderson and Dalton2010) if participation in markets significantly raises the opportunity costs of growing non-profitable varieties.
Yet, in the case of under-utilized crops Footnote 2 such as the minor millets (Gruère et al., Reference Gruère, Nagarajan and Oliver King2009) grown in marginal environments, the impacts of farmer–market integration might be different or reversed. For under-utilized crops, many varieties are found only in isolated or agro-ecological niches, grown by a small group of farmers within a specific geographical area. The markets for such crops are often non-existent and, if present, highly localized. Any increase or improvement in market participation or access could bring additional returns to these crops due to improved exchanges of both inputs and outputs, thus increasing on-farm diversity. In other words, integration into markets may incentivize farmers to grow a more diverse set of varieties than under autarkic conditions, if there is sufficient market demand for producers to realize profits (Van Dusen and Taylor, Reference Van Dusen and Taylor2005). For some under-utilized crops, output (grains) and input (seeds) are often interchangeable and thus access to markets may also lower costs for obtaining more seed varieties. Here, public efforts for conserving the genetic diversity of these crops could be directed to supporting market participation.
We test the above hypotheses by analyzing whether improved access to markets for growers of under-utilized crops (for example, minor millets) affects on-farm varietal diversity and, if so, how it also influences various aspects of the welfare of minor millet growers in two regions in India with different agro-ecological conditions. Minor millets are extremely important for local food security, fodder and genetic diversity in the arid and semi-arid regions of India because of their short duration and drought resistance. Three minor millet species, namely finger millet (Eleucine corocona), foxtail millet (Setaria italica) and proso or little millet (Panicum milliaceum), are widely cultivated in southern India. These crops are often classified as ‘minor or coarse grains’ in agricultural statistics – with ‘minor’ referring to the smaller grain size and lesser importance in trade (Nagarajan and Smale, Reference Nagarajan and Smale2007).
Currently, the range of improved varieties for minor millets is narrow, mostly pure-line selections from existing farmer cultivars. Private companies show little interest in developing new varieties due to their lack of commercial importance and limited scope for developing new hybrids. Markets for minor millets are mostly ‘thin’ or incomplete,Footnote 3 and seed supply channels do not interface with public seed systems or private companies (Nagarajan and Smale, Reference Nagarajan and Smale2007). No specific government interventions or public programs target the cultivation of minor millets on a large scale, although recently NGOs have implemented a few niche-based, small-scale interventions to conserve biodiversity and explore market development. In the absence of formal trading structures or interventions for minor millets, local markets may assume greater importance as a potential source for both seed (especially for locally adapted, farmer varieties) and grains (Nagarajan et al., Reference Nagarajan, Oliver King, Smale, Dalton, Lipper, Anderson and Dalton2010).
Thus, the results from this study could help policy makers understand the impact of local market participation on the on-farm diversity of minor millets and outline ways in which local markets could be used to enhance variety diversity and to conserve minor millets in the regions where they are currently grown. Perhaps, within regions where minor millets are grown extensively, increased on-farm diversity and conservation through improved market access would vary by agro-ecologies. For example, the semi-arid, infertile regions of Dharmapuri-Plains may be a preferred agro-ecology for conserving minor millet diversity by supporting improved market access, as opportunity costs for growing minor millets are unlikely to increase given the difficulty of growing other potentially profitable crops for the same market. This contrasts with Kolli Hills where minor millets compete with other more profitable cash crops due to its more fertile soils.
Thus, this case study from India also compares two different agro-ecosystems in terms of minor millet diversity and the impact of participation in minor millet markets on varietal diversity. In places where market access improves not only farmers' incomes but also other measures of welfare such as dietary diversity or household food security (e.g., dryland plains), these results further identify where incentives for on-farm genetic conservation for under-utilized crops like minor millets are higher and where there is a need for increased support towards such efforts.
In what follows, section 2 briefly describes the rationale for the study locations and sampling methods. Section 3 presents the econometric model employed to estimate the impact of minor millet market participation on the on-farm variety diversity of minor millets in the Plains and the Hills, and on welfare among minor millet growers in the Plains. It also describes the variables (outcomes and explanatory variables) used in the empirical estimation. The results from our econometric estimation are discussed in section 4, followed by conclusions.
2. Sites and sampling
Three factors influenced our choice of the study area: (1) areas were identified with significant varietal diversity and production of minor millets; (2) areas were identified with some type of market for minor millets; and (3) areas were selected that could provide a distinct contrast and comparison in terms of agro-ecological conditions and market interventions.
The sample is divided into two distinct areas: the drylands Plains area and the Kolli Hills area. These sites have significant differences in agro-ecological conditions, including elevation, soil fertility levels and cropping systems, along with socio-economic characteristics such as farm and household size, gender and age of household head, and productive assets.
The Kolli Hills had specific and current interventions to promote the marketing of diverse varieties of minor millets. In contrast, in the Dharmapuri-Plains area, no specific interventions were related to the marketing of minor millet crops and varieties. This distinction provides us with useful points of comparison in terms of minor millet diversity and their transactions within farming communities.
The Kolli Hills
Minor millets are grown extensively as a mixed crop in the forest ecosystem in the Kolli Hills, located in the Namakkal district of Tamil Nadu state. Although five different genera of minor millet varieties are found in Kolli Hills, farm households only grew three types: finger millet, little millet and proso millet. The Hills, known for its genetic diversity of minor millets, is considered the secondary center of its origin. Intra-specific phenotypic variability found among minor millets is enormous; populations are highly heterogeneous in morphological and agronomical character. Heterogeneity within the races and microclimatic variations in farmer fields at different altitudes of the Hills also help to reduce the risk of harvest loss due to various abiotic and biotic stresses (Gruère et al., Reference Gruère, Nagarajan and Oliver King2009). Despite the local population's traditional consumption preference for minor millets, the area devoted to minor millets has declined in recent years to the advantage of substitute crops grown exclusively for markets, such as cassava, rice and pineapple (Gruère et al., Reference Gruère, Nagarajan and Oliver King2009; Bioversity International, 2011).
In the Hills, the household sampling for the survey was based on farmer participation (and non-participation) in development interventions implemented by the M.S. Swaminathan Research Foundation (MSSRF). Since 2002, the MSSRF has led targeted conservation-cum-commercialization intervention programs in the Hills, with the objectives of: (i) increasing the marketing potential of these minor millets crops by adding value to them, and (ii) helping farming communities maintain existing varietal diversity among minor millets by providing economic incentives for their conservation (MSSRF, 2002). Of the seven communities that grow minor millets in the Hills, minor millets-based interventions were implemented in three. Our final sample consisted of 135 randomly selected growing households, with 75 farmers who participated in minor millets-based interventions and 60 farmers who did not.
Plains
The Dharmapuri district is located in the northwestern part of Tamil Nadu State and is a dryland, semi-arid production system. Dharmapuri leads the state in total area and production of two important minor millet varieties, little millet and finger millet. The district receives only around 400–500 mm of rainfall annually, and less than 10 per cent of farmland is irrigated. Very few crop production options are available in these dryland environments except growing minor millets. The district is a major market center for the sale of finger and little millet in southern India (Government of Tamil Nadu, 2010).
The cultivation of minor millets in these drylands is driven by increased demand over the last 15 years from North Indian food processing industries for the grains of minor millets (especially little millet). Yet no specific public or private sector interventions are working to develop improved varieties and increase yield. Therefore, few improved cultivars are available for cultivation through formal channels and any surplus of minor millets available for farmers to trade is always low – both for seed and grains. Minor millet grains and seed are traded mainly through local market towns located in the taluks Footnote 4 of Dharmapuri. Prices are typically ‘given’ by the traders with little market information made available to farmers who sell their produce in these markets (Nagarajan et al., Reference Nagarajan, Oliver King, Smale, Dalton, Lipper, Anderson and Dalton2010).
Within the Dharmapuri district, Pennagaram is a major production and marketing center for little and finger millet. Pennagaram is also a taluk headquarters, and the location of both private (agro-dealers, local grain traders shops or mandis and retail shops) and public (agri-depots of the state agriculture department) input distribution centers. For this purpose, we selected Pennagaram and the surrounding villages, and designed a two-stage random sampling procedure to implement farm-level surveys. The final sample consisted of 108 households, selected randomly from five villages to represent farming communities that grow minor millets, and located at distance gradients ranging from 5 to 50 km from the major market center (for seed and grain), viz., Pennagaram. In the final sample of 108 observations, drawn from the Plains ecosystem, 79 households sold minor millets in the market while 29 did not.
3. Econometric model
The empirical analyses for this study are based on two contexts: first, we map the behavior of minor millet growers who participate or gain access to the minor millet market in the Plains and market-based development interventions in the Hills;Footnote 5 second, we analyze the impact of market participation on on-farm minor millet variety diversity and, if the impact is significant, we analyze the impact on farmers' welfare. While doing so, we noted that the participation in market or any specific intervention (based on an NGO or government development project) could be endogenous to the various outcomes measured as diversity of minor millet varieties grown by each household and various welfare indicators. Such endogeneity is likely because producers may self-select themselves for participation, and the estimated impacts could be biased if the estimation fails to properly account for the effects of unobserved characteristics.
Propensity score matching (PSM) can be used to estimate the impact of market and project participation as the average treatment effect on treated farmers (ATT), addressing the endogeneity due to such self-selection, under the assumption that farmers' self-selection decisions can be explained by their observable characteristics alone (selection on observable or unconfoundedness assumption).Footnote 6 PSM can also be used for limited dependent variables because ATT is defined on the unconditional and not the conditional mean (Wooldridge, Reference Wooldridge2002) and is, therefore, appropriate for the diversity indices discussed later, which are truncated at zero.
Following Becerril and Abdulai (Reference Becerril and Abdulai2010), the PSM estimator can be expressed as follows. First, we estimate the propensity score p i,
 $$p_{i} \lpar X\rpar = {\rm Pr}[ D = 1\vert X] = E[ D\vert X] = F\lcub h\lpar X_{i}\rpar \rcub \comma \; $$
which is the probability that farmer i participates in the market or project (D = 1) given his/her observable characteristics X, and is expressed as the function of X. Then, conditional on p i(X) defined in (1), ATT is estimated as
 $$\eqalign{{\rm ATT} & = E\lcub Y_{iA} - Y_{iN} \vert D= 1\rcub \cr {\rm ATT} &=E[ E\lcub Y_{iA} - Y_{iN}\vert D_{i} = 1\comma \; p\lpar X\rpar \rcub ] \cr {\rm ATT} & = E[ E\lcub Y_{iA} \vert D_{i} = 1\comma \; p\lpar X\rpar \rcub - E\lcub Y_{iN} \vert D_{i} = 0\comma \; p\lpar X\rpar \rcub \vert D = 1] \comma \; } $$
in which Y iA and Y iN are, respectively, the outcome with and without treatment. An empirical approach for estimating the ATT for observation in the treatment group is to find observations in the control group with similar p, and estimate the ATT by comparing Y iA and Y iN as in (2).
The literature proposes various methods for identifying such control observations (Caliendo and Kopeinig, Reference Caliendo and Kopeinig2008), including the nearest neighbor method (NNM) and the kernel matching method (KMM). Our preferred method is single nearest neighbor with caliper, in which the treatment group observation is matched with the single observation in the control group with closest propensity score, and only if they are found within the range set by the caliper. According to Caliendo and Kopeinig (Reference Caliendo and Kopeinig2008), a certain bias may arise in PSM estimators depending on the specifications. Such a bias is typically minimized with NNM as opposed to the KMM or radius method, in single-neighbor matching as opposed to multiple-neighbors matching, with calipers as opposed to without calipers, with replacement as opposed to without replacement, although the former specifications generally increase variance of the estimated ATT (Caliendo and Kopeinig Reference Caliendo and Kopeinig2008). We also estimate KMM, given its popularity in the literature, although, according to Caliendo and Kopeinig (Reference Caliendo and Kopeinig2008), the kernel method may be associated with greater bias than the aforementioned specifications used in this study. We use normal distribution as a kernel function type. The estimated ATTs are generally insensitive to the selection of kernel function type (DiNardo and Tobias, Reference DiNardo and Tobias2001; Caliendo and Kopeinig, Reference Caliendo and Kopeinig2008).
The caliper width in using NNM is selected at 0.05, which seems to provide the best matching quality without dropping too many observations. A wide caliper is generally associated with more observations but also with greater bias (Cochran and Rubin, Reference Cochran and Rubin1973). A caliper width of 0.05 is sufficiently narrow, given the weak criteria of appropriate caliper size discussed in Cochran and Rubin (Reference Cochran and Rubin1973) and Rosenbaum and Rubin (Reference Rosenbaum and Rubin1985).Footnote 7 Similarly, in KMM, the bandwidth is selected to achieve high matching quality. We limit the observation to common support, in which the treatment group outside the caliper of the propensity score for any control group is dropped. This reduces the sample size but further improves the matching quality. As a result, our sample size becomes small, generally in the range of 30–50 observations for each group. However, since PSM only compares the means, estimated ATTs are still reliable. Several other studies have used similar sample sizes (Gotland et al., Reference Gotland, Sadoulet, de Janvry, Murgai and Ortiz2004; Becerril and Abdulai, Reference Becerril and Abdulai2010). We then assess the matching quality by (1) individual t-test using normalized distance of mean, and (2) likelihood ratio method (Sianesi, Reference Sianesi2004), which tests the joint significance of all covariates except constants in a regression where the treatment status is regressed on those covariates.
A ‘hidden bias’ in estimated ATT can arise if unobserved variables simultaneously affect farmer participation and outcomes, which violate the unconfoundedness assumption. We conduct sensitivity analysis to assess the extent of such hidden bias by estimating ‘Rosenbaum bounds’ (Rosenbaum, Reference Rosenbaum2002), using the Stata command rbounds (DiPrete and Gangl, Reference DiPrete and Gangl2004). We report the critical value of gamma, where the significant coefficients become insignificant at the 5 per cent level of significance. In addition, we run a placebo regression (Imbens and Wooldridge, Reference Imbens and Woolridge2009) to further test the unconfoundedness assumption, in which certain variables are known not to be caused by the market participation or project intervention. We use the age of spouse as such variables, following Cunguara and Darnhofer (Reference Cunguara and Darnhofer2011) and Cunguara and Moder (Reference Cunguara and Moder2011).
Outcome and determinants of propensity score
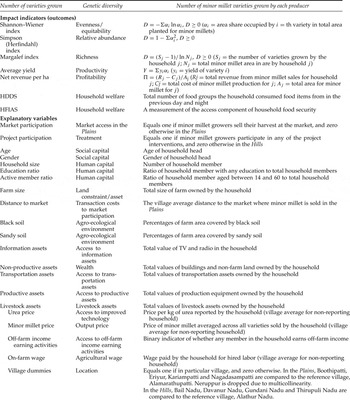
The definitions of outcome and explanatory variables are presented in table 1, while summary statistics of these variables are presented in table 2. The outcome variables (y i) are measures of minor millet diversity, namely number (‘counts’) of minor millet varieties grown by each household, Shannon–Wiener indices of evenness, Simpson (or Herfindahl) index of relative abundance of varieties, and Margalef indices of richness (Meng et al., Reference Meng, Smale, Bellon, Grimanelli and Smale1998). For the Plains, outcome variables also include yield and net revenue per hectare of minor millets, and household welfare measured by the household food insecurity access scale (HFIAS) and household level dietary diversity score (HDDS). We did not evaluate the impact of participation or interventions on farmer welfare for the Hills ecosystem and restricted our analysis to knowing the effect of market development programs on minor millet diversity.Footnote 8
Definition of impact indicators and explanatory variables

Source: Authors.
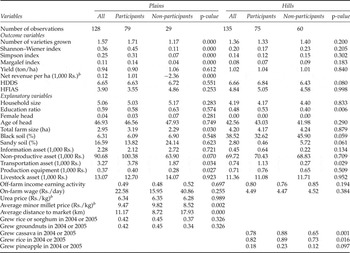
Comparison of means, explanatory and outcome variables, by regions, participants and non-participants in markets and interventionsa

Source: Authors.
Notes: aWe used the Mann–Whitney test for continuous variables, and the Kruskal–Wallis test for membership (binary variable). T-tests and chi-square tests are also used for continuous variables and binary variables, from which we obtained similar p-values.
bIn the Hills, no farmer sold minor millets, nor reported the urea price.
We use the four aforementioned measurements of minor millet diversity to examine the impact on variety diversity in multiple aspects. Counts are commonly used in the literature (Van Dusen, Reference Van Dusen2000; Nagarajan and Smale, Reference Nagarajan and Smale2007; Di Falco et al., Reference Di Falco, Bezabih and Yesuf2010). Richness, relative abundance and evenness are intuitive concepts drawn from the ecological literature about species' diversity (Magurran, Reference Magurran1988). The Shannon–Wiener index measures evenness of diversity by taking into account the area share planted for each variety. The Simpson (Herfindahl) index weighs the concept of relative abundance more heavily than richness (Magurran, Reference Magurran1988; Hubbell, Reference Hubbell2001). The Margalef index measures the richness by counts for a household relative to the total area planted for minor millet by each household.Footnote 9 Yield of minor millet is measured as the average across all minor millet varieties grown by the household, weighted by the area for each variety. Since percentage of change is more interpretable for yield increase, we use natural log of yield as a dependent variable. Net revenue per ha is measured by the aggregate of all revenue from each minor millet variety grown by the household. For additional welfare indicators, we used two indicators measuring the level of food security, namely the HDDS measured at the household level, and the HFIAS. The HDDS is especially useful in capturing the welfare level for farmers who grow crops that do not satisfy their primary food requirements but indirectly contribute to farm income through their sales.Footnote 10 The dietary diversity measure also denotes household food security, and is often described as an appropriate indicator of farmer wellbeing in a developing country context (Hoddinott and Yohannes, Reference Hoddinott and Yohannes2002; Ruel, Reference Ruel2003). The HDDS counts the number of different food groups and nutrients (such as grains, vegetables, fruits, milk, oils and eggs). For example, in this study, we constructed the HDDS measure by asking farmers to select the type of food consumed among 15 food groups in the past day and night before the interview.Footnote 11 We used food groups because food items from within the same food group tend to supply similar nutrients, whereas a fully nutritional diet is more likely to be obtained by consuming a variety of foods from a variety of food groups.
Similarly, the HFIAS is constructed as follows (Coates et al., Reference Coates, Swindale and Bilinsky2007). A series of nine event questions about the lack of food and changes in consumption patterns due to food insecurity over the past month were posed to elicit yes or no responses. Households that responded ‘yes’ to a particular question were then asked how frequently the event occurred and the response was interpreted as ‘rarely’ (once or twice in the past 30 days), ‘sometimes’ (three to 10 times in the past 30 days) or ‘often’ (more than 10 times in the past 30 days). The responses were tallied to produce a household score, ranging from zero (the most food secure) to 27 (the most food insecure).
Determinants of the propensity score should include the variables that influence both treatment assignment and outcomes but are not affected by the treatment (Smith and Todd, Reference Smith and Todd2005). The determinants in our study include various household characteristics such as age and gender of household head, household size, education ratio, access to improved technology, minor millet price, participation in off-farm income earning activities and agricultural wages, location such as distance to the nearest minor millet market, soil characteristics, values of various assets, and production of other major crops.
When input markets are imperfect, household labor resources can play an important role in the number of varieties grown (Benin et al., Reference Benin, Smale, Pender, Gebremedhin and Ehui2004; Di Falco et al., Reference Di Falco, Bezabih and Yesuf2010). Household size may also increase the diversity through preference for heterogeneity (Benin et al., Reference Benin, Smale, Pender, Gebremedhin and Ehui2004) and the availability of family labor for intensive cultivation. Age and gender of the household head can affect the household's social capital, such as membership in various community- or farmer-based associations, which can also influence their variety diversity. Older farmers may tend to conserve variety diversity because of traditional practices or taste preferences (Van Dusen and Taylor, Reference Van Dusen and Taylor2005). Farm size represents the land constraint for both conserving variety diversity and generating dietary diversity.
Soil type, the primary determinant of land fertility, can also affect variety diversity if production and its risk for each variety vary across different soils. While red soil is the most common in both the Plains and the Hills, some land portions are covered with black soil which is generally more fertile with higher water-holding capacity (Nagarajan and Smale, Reference Nagarajan and Smale2007). Sandy soil may also differ from red soil in fertility. Soil fertility can also affect the participation in minor millet markets or projects, either positively through larger marketable surplus, or negatively through substitutions with other crops that respond more significantly to soil fertility.
Both off- and on-farm activities (such as farm labor) that provide alternative income earning opportunities for minor millet growers also affect a household's ability to participate in markets. Lastly, various village-specific agro-ecologic environments may affect both the demand for variety diversity and the suitability of varieties in such environments.
Non-productive assets can measure the household's level of wealth that would then allow for purchase of various inputs, also affecting the number of varieties grown. Transportation assets and productive assets such as farm implements can measure farmers' capacity to exploit the scale of economy by mechanized intensive production of fewer minor millet varieties. Livestock assets can affect the demand for variety diversity as a source of fodder, and also through the use of livestock manure for fertilizer. Better market information that could be partly obtainable through various information assets (such as radio, TV and cell phones) can help farmers overcome high transaction costs associated with obtaining market information. Levels of access to improved technology, such as fertilizer price (urea), can affect the profitability of crops in addition to minor millets. Minor millet prices can also affect the variety diversity, and support minor millet market participation.Footnote 12
Past production of other major crops can affect both minor millet market participation and diversity as growers of other crops may have better market information. Also, substitution effects must be factored into both input use and consumption. In particular, production of groundnuts, other cereal crops such as rice and sorghum in the Plains and production of cassava, rice and pineapple in the Hills can particularly influence crop choice decisions, as a significant proportion of minor millet growers in our sample seem to grow these substitute crops (table 2) potentially for home consumption in the Plains and sales in the Hills.Footnote 13
Potential endogeneity of some variables may be a concern, because they may be affected by the market or project participation in the long run, especially if farmers have participated in the market for a long time. Including potentially endogenous variables as determinants of the propensity score violates the unconfoundedness assumption (Imbens and Wooldridge, Reference Imbens and Woolridge2009: fn. 7). However, it is also possible that they are unaffected by the market or project participation, in which case excluding them would be inefficient. We therefore analyze two models, with and without those potentially endogenous variables. Specifically, we estimated a full model including all the aforementioned determinants, and a reduced model which excludes all asset variables except non-productive assets, and dummy variables indicating production of other crops. The level of assets may change if farmers have participated in the market or market-related project for many years, except highly fixed assets such as non-productive assets (total value of buildings and non-farm land owned). Similarly, the choice of crops produced may be affected by minor millet market participation over the medium to long term. We then assess the robustness of our findings across two models.
We compared the means of each variable between market or project participants and non-participants for the sampled households in the Plains and the Hills (table 2). The p-values refer to the null hypotheses that mean values are the same across participants and non-participants for each variable. Significant differences are observed between participants vs. non-participants in the number of varieties grown, net revenue per ha, transportation and productive assets, minor millet price and distance to the nearest market in the Plains. Differences are less pronounced in the Hills, with significant variations across participants and non-participants observed for education level, transportation assets and production of other crops.
4. Results
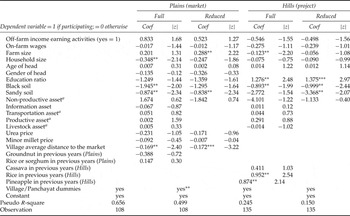
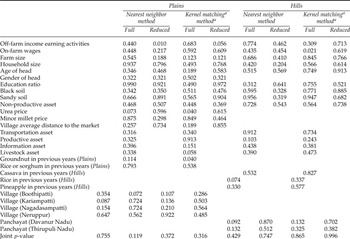
Determinants of propensity scores on market (Plains) and project participations (Hills) are presented in table 3. The Full model assumes that various asset holdings and production of other crops are unaffected by participation in market or market-related programs, while the Reduced model assumes that they are. In the Plains, under the Full model, remoteness from the nearest minor millet market discourages market participation. Smaller households were more likely to participate in markets and sell minor millets. Smaller household size may result in smaller home consumption and larger marketable surplus, thus reducing transaction costs relative to their sales revenue and inducing market participation. Of the different soil types available in the study areas (red, black and sandy), farmers with larger areas of black soils or sandy soils were less likely to participate in the minor millet market, possibly indicating the substitution with other crops that respond more to soil fertility and higher soil moisture.
Estimation of propensity scores

Source: Authors.
Notes: Levels of significance are indicated with *** as 1%; ** as 5%.
The absolute z-value is based on the robust standard errors.
aCoefficients refer to 1 million Rs. of non-productive asset and productive asset, and 1,000 Rs. of transportation asset and livestock asset.
Under the Reduced model assumption, the propensity score is primarily raised by larger farm size, less sandy soil and proximity to the nearest market, but does not seem to be affected by the household size. These differences suggest that it is important to estimate the ATTs of market participation under both assumptions to obtain robust results.
In the Hills eco-system, the important determinants of project participation were education ratio, soil characteristics in both Full and Reduced models, and farm size, and production of rice and pineapples in the Full model. Households with higher educational levels were more likely to participate in the project. In general, farmers living in the Hills have less access to infrastructure such as roads, schools, health and information and are generally less connected to external economies (MSSRF, 2002; Shilpi and Umali-Deininger, Reference Shilpi and Umali-Deininger2008). Level of education may help in fulfilling the requirement for participation. Higher shares of both black and sandy soils discouraged participation, possibly reflecting the substitutions between minor millets and other commercial and food crops such as cassava. Larger farm sizes may also raise the profitability of other commercial crops like cassava by lowering the transaction costs for these crops relative to minor millets. At the same time, rice and pineapple growers in previous years were more likely to participate in the project, possibly because the project could raise the yield of minor millets for home consumption – allowing farmers to allocate more plots for rice and pineapple grown for commercial sales. Similar to the Plains, the determinants of propensity score in the Hills differ slightly between the Full and Reduced models, suggesting the need for robust estimations of ATTs of market- related programs.
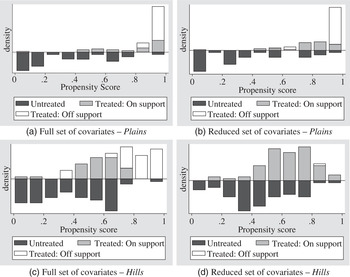
Figure 1 shows the distribution of propensity scores among the treated and control groups, and the treated group off or on support, based on the NNM. The distribution of propensity score is clearly different between the treated and control groups, suggesting the importance of proper matching. Figure 1 also suggests the significance of imposing common support conditions which reduce bad matches. Table 4 shows the matching quality, assessed through the t-test of equality of means across treated and control groups on support, and the likelihood ratio test. The table indicates that differences of the mean are statistically insignificant at the 5 per cent level for most covariates across treated and control groups, and the number of covariates with statistically significant difference is small relative to the total number of variables, which can naturally happen even under the null hypotheses (Gotland et al., Reference Gotland, Sadoulet, de Janvry, Murgai and Ortiz2004). In addition, the joint p-value based on the likelihood ratio test suggests that all covariates except constant are jointly insignificant. These suggest that treatment and control groups on support are well matched.
Propensity score distribution and common support in the Plains and the Hills
source:Authors.

Matching quality (p-values for H0: equality of means across treated and control groups on support)

Source: Authors.
Notes: aBandwidths are 0.1 for full model and 0.02 for reduced model.
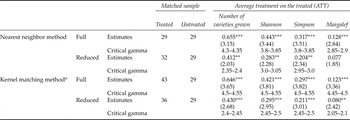
Estimated ATTs of participation in market or project are shown in tables 5–7. In the Plains, market participation significantly raised all four indicators of diversity: number, evenness (Shannon–Wiener index), relative abundance (Simpson index) and richness (Margalef index). Market participation seems to increase the average number of minor millet varieties by 0.412~0.667, Shannon index by 0.283~0.443, Simpson index by 0.204~0.317, and Margalef index by 0.080~0.128, all with statistical significance at the 5 per cent level, except the Margalef index in the Reduced NNM model.
Estimated ATTs of market participation on minor millet diversity indicators in the Plains

Source: Authors.
Notes: aBandwidths are 0.1 for full model and 0.02 for reduced model.
Levels of significance are indicated with *** as 1%; ** as 5%
Estimated ATTs of market participation on various welfare indicators in the Plains

Source: Authors.
Notes: aBandwidths are 0.1 for full model and 0.02 for reduced model.
Levels of significance are indicated with *** as 1%; ** as 5%
Estimated ATTs of market participation on minor millet diversity indicators in the Hills

Source: Authors.
Notes: aBandwidths are 0.1 for full model and 0.02 for reduced model.
In general, results indicate that, in the Plains, participation in minor millet output markets has generated more favorable and positive incentives among producers to increase on-farm minor millet diversity. Market participants tend to grow on average 0.66 more varieties than non-participants while also raising the evenness and richness in diversity.Footnote 14 An increase in number of varieties grown at the rate of 0.66 can be considered substantial, relative to the average number of 1.5 grown in the Plains. Results are similar across NNM and KMM, and are robust if excluding potentially endogenous variables from the determinants of propensity score, as discussed above. Results are also robust for potential hidden bias in our specification of propensity score estimation, as is indicated by the critical values of gamma based on the estimation of Rosenbaum bounds. For example, the ATT is still significant at 5 per cent even when the odds ratio of farmers' market participation is 4.3 times larger than the odds ratio estimated in our specification. Similar results hold for other diversity indicators, all with critical values of gamma ranging from approximately 2.5 to 4.5, indicating that our results are highly robust against hidden biases in propensity score estimation. We tested other specifications with a larger caliper size and found that results are generally similar; including more treated observations into the analysis generally leads to greater ATTs but also poorer matching quality.
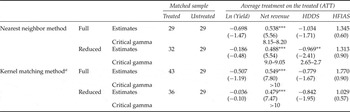
The results also indicate that market participation in the Plains has a significantly positive effect on minor millet income, raising net revenue per ha by 479~ 549 Indian Rupees (table 6) or approximately US$10, although it has a statistically insignificant effect on yield. Returns from market participation thus appear to be high enough to incentivize farmers to grow more varieties. Impacts of market participation on the HDDS and HFIAS in the Plains are, however, statistically insignificant except in the Reduced NNM model, which suggests slightly negative effects on HDDS. The net income increase derived from minor millet sales may be insufficient to substantially improve food security or may indicate certain diets are still expensive and not within the reach of farmers. Although the additional income may be sufficient to purchase carbohydrate foods (mainly subsidized rice from the public distribution system), households may not be able to afford other components of their diet that include protein and fat.
Overall, the results suggest that minor millet markets in the Plains play a key role in adding economic value to conserving minor millet varieties. Improving market access for minor millet growers may enable the conservation of minor millet varieties in an economically sustainable way. The magnitude of such economic value is, however, relatively small, so that there may be no immediate improvement in farmer welfare, that is, household food security and dietary diversity levels. Assisting farmers in saving these additional incomes over time may be necessary to enhance the incentives for minor millet farmers to participate in the minor millet market.
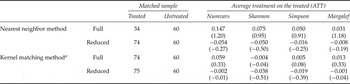
The effect of participation in the minor millet market on minor millet diversity in the Plains contrasts with the Hills, where market-related programs had a statistically insignificant effect on minor millet diversity (table 7). Although a thorough investigation of the impacts of such project interventions in the Hills is not within the scope of our current study and is left for the future, the key differences between the Plains and the Hills may be due to differences in market returns between minor millets and other crops in the two areas – and the role of markets in affecting such returns. In the Hills, highly valuable cash crops such as cassava may compete intensely with minor millets (Gruère et al., Reference Gruère, Nagarajan and Oliver King2009; Bioversity International, 2011), and thus the marginal benefit of increasing minor millet diversity may be lower than the potential benefit of expanding areas in cash crops.
In the Plains, there is continued demand for minor millets from existing local markets and traders, and a higher return associated with growing minor millets, with the potential to increase diversity through market participation. Public support for encouraging minor millet market participation by minor millet growers, therefore, has the potential to facilitate the conservation of genetic diversity of minor millets in the Plains.
5. Conclusions
Improving food security through increasing returns to agricultural production and maintaining on-farm crop genetic diversity are two important policy objectives often considered to be in opposition. Integration into agricultural markets can often increase incentives for specialization and homogeneity and thus may lead to lower levels of on-farm varietal diversity. If, however, the crop is underutilized in the sense that varieties grown in different locations are not traded beyond the community, market participation could lead to increased on-farm variety diversity through varieties exchanges, and higher returns to varieties already grown (Van Dusen and Taylor, Reference Van Dusen and Taylor2005).
We test these hypotheses using data from two regions in India with distinct agro-ecological characteristics and contrasting production environments for minor millets. The results indicate that the latter may be possible in the semi-arid and less fertile marginal region of the Plains (Dharmapuri), where market participation may increase both on-farm diversity of minor millets in terms of the number of varieties, evenness, relative abundance and richness. The study, however, also indicates the importance of context and location in determining the effects of market participation on diversity, and further actions need to be taken to achieve larger welfare effects that could enhance the minor millet growers' incentives. In the Dharmapuri district, characterized by poorer agro-ecological conditions (drylands, poor rainfall and soil) and fewer alternative cropping options for farmers, encouragement for increased market participation may not lead to the substitution to other cash crops as in the Kolli Hills. Under these conditions in the Plains, market participation is associated with higher levels of on-farm minor millet diversity. The net income effects of market participation, however, may still be insufficient to realize immediate improvement in the welfare of growers, measured by food security and dietary diversity.
In the Kolli Hills, with a more fertile ecosystem, agro-ecological conditions allow for a wider range of higher value cash crops to be grown. In such an environment, participation in a project promoting minor millet market participation may not have a significant effect on minor millet diversity. Overall, our results indicate a potential to increase on-farm variety diversity of minor millets through minor millet market participation in areas like the Dharmapuri district in Tamil Nadu, India, which can be magnified by appropriate welfare-enhancing public support. In other areas, however, minor millet market participation may not be an effective means of providing incentives for conserving desirable on-farm minor millet diversity, and in these situations other mechanisms should be sought.