1. Introduction
As electric vehicles (EVs) continue to shape the future of transportation, ensuring the flawless operation of charging ports through automated testing in the manufacturing process has become crucial for delivering reliable and high-quality vehicles. Unlike other industries, plug-in testing in the automotive manufacturing process presents unique challenges due to the diversity of vehicle designs. These challenges arise from vehicle body shape variations, charging port placements, and a wide range of surface textures and finishes. Such uncertainties create significant difficulties for vision-based localization systems in achieving precise alignment between the charging gun and the port.
Traditional vision systems often struggle to handle the variability introduced by different vehicle designs and external factors such as lighting conditions, reflections, and background noise. Recently, state-of-the-art approaches utilize deep convolutional neural networks (DCNN) for object detection in the robotics system [Reference Ismail, Mehri, Sahbani and Amara1]. However, DCNN requires large amounts of data to ensure stability and reliable performance. In the case of automotive charging testing, the diversity of vehicle models, combined with the need to account for various lighting conditions, surface textures, and environmental factors, significantly increases the complexity and expense of data collection. This limitation presents a significant challenge for scaling DCNN-based systems in real-world automotive manufacturing.
Because flexible production lines frequently change vehicle models. These variations require constant data acquisition and model retraining to ensure accuracy and robustness.
Additionally, the variation in EVs models often increases the positional uncertainty of the charging port, leading to the occurrence of camera defocus blur and uncertain noise. This results in unclear images, which reduces the localization process’s accuracy. Addressing this issue requires the implementation of a dynamic servo control mechanism, allowing the robot to adjust the camera position in real-time. By actively adjusting the camera to achieve optimal focus, the system can ensure clearer imaging and significantly improve the precision of the charging port alignment.
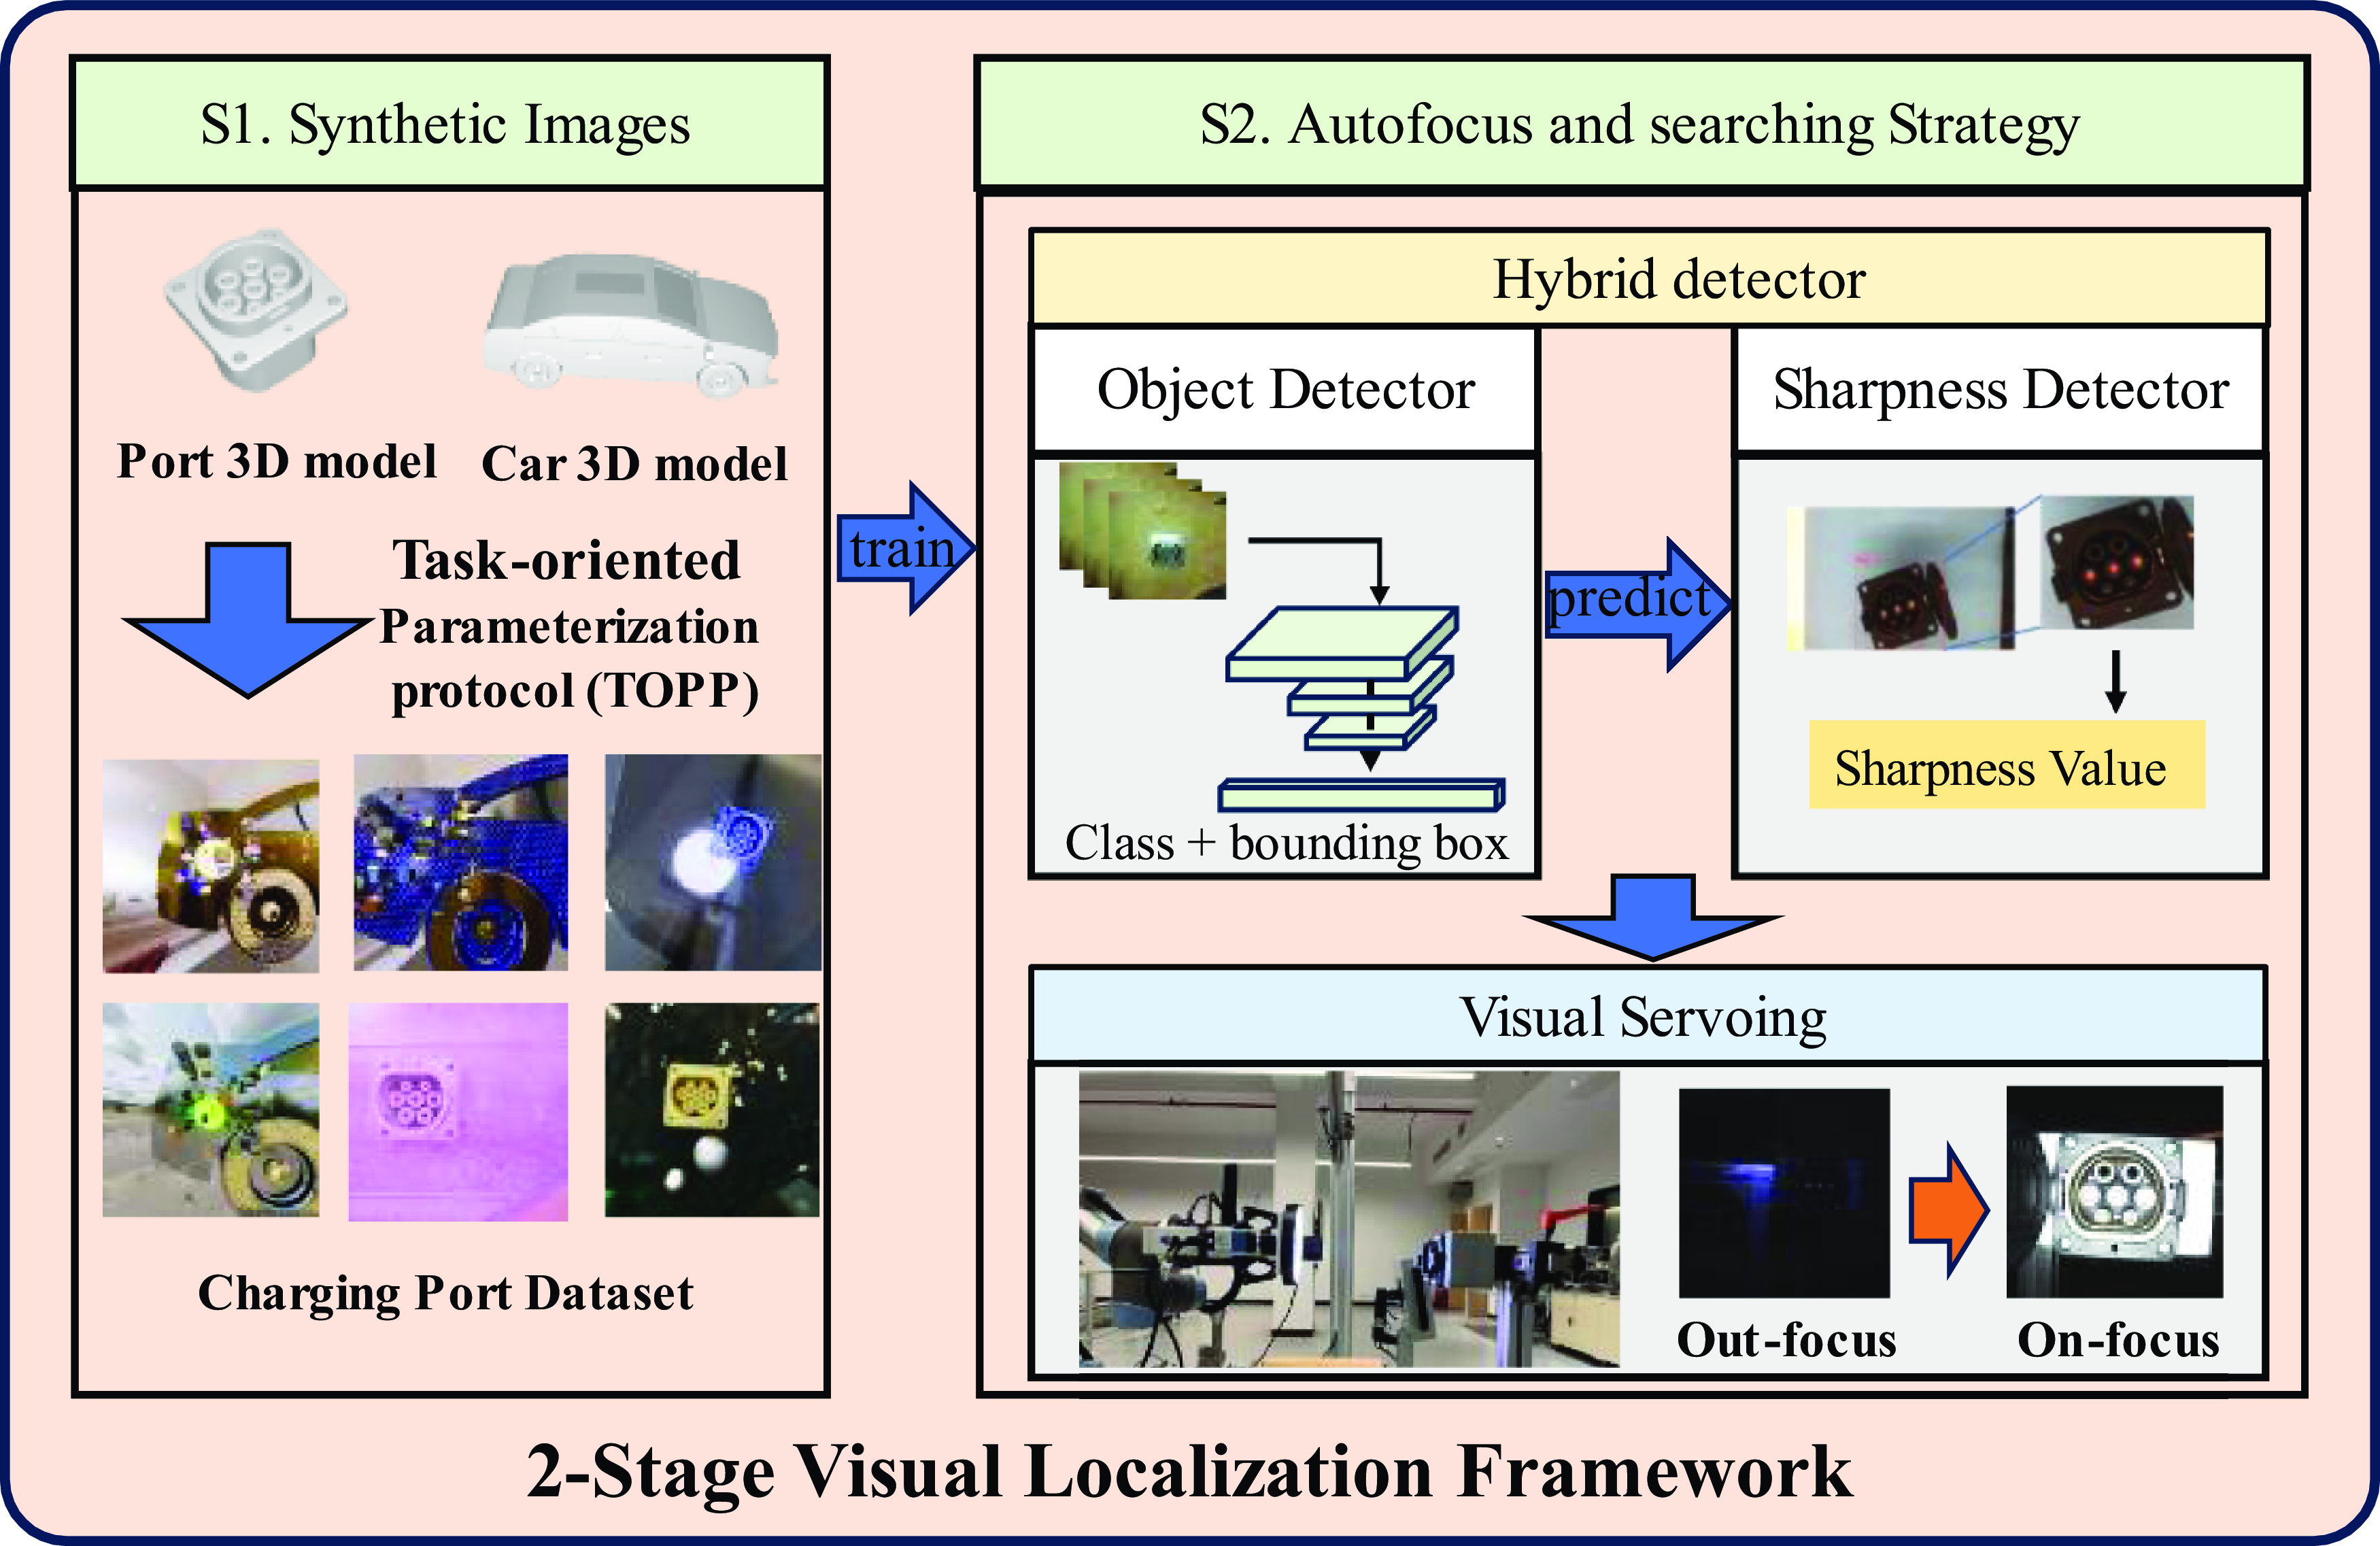
In this work, a 2-stage visual localization solution was proposed to improve the efficiency and robustness of the automatic charging process in uncertain environments (Figure 1). The main contributions of this paper include:
-
(1) A 2-stage visual-based solution is proposed for the localization of EVs charging ports in uncertain and complex environments.
-
(2) A task-oriented parameterization protocol (TOPP) is proposed for generating a charging port dataset based on domain randomization. It optimizes synthetic images’ composition and generation speed and improves the localization performance.
-
(3) A dynamic autofocus strategy consisting of a hybrid detector and visual servoing is proposed, which is resistant to interference and can move the robot accurately and efficiently from the out-focus position to an on-focus, clear imaging position.
-
(4) Validating the sim2real effects of synthetic data and real-world experiments was conducted to verify the efficacy of the auto-charging system.
Framework of the proposed visual localization method.

2. Related works
2.1. Image-based port recognition
EVs charging Port image-based recognition has been widely deployed in previous works, such as convolutional neural networks (CNN) [Reference Pan, Sun, Liu and Wang2], template matching [Reference Lv, Chen, Hu and Lou3], and shape-feature-based methods [Reference Tadic4]. Quan et al. [Reference Quan, Lou, Lin, Liang and Di5] employed the Hough transformation to identify and extract the region of the charging port. They then utilized the Canny operator to extract contour information and precisely fit an ellipse. Their experiments found that the positioning error mainly originates from factors such as lighting, defocusing, and wear of the charging port. Furthermore, they proposed a clustering template-matching algorithm to improve the robustness of identification under different lighting conditions [Reference Quan, Lou, Lin, Liang, Wei and Di6]. To address the challenge of recognizing charging ports, Lv et al. [Reference Lv, Chen, Hu and Lou3] proposed a template-matching approach to identify the icon on the charging port. Compared to the charging port itself, the icon has more distinctive color and shape features. Based on the recognition results, the robot is guided to open the cover and collect force data during the insertion stage. A classifier determines the contact status to ensure safe insertion. Pan et al. [Reference Pan, Sun, Liu and Wang2] collected a dataset of charging ports with varying degrees of occlusion and lighting in a laboratory environment. They used a CNN network to classify the charging ports and adjusted the robot’s position and light source based on the recognition results. They then obtained the precise posture of the charging port through elliptical feature recognition and completed the charging gun insertion through position control. Asha et al. [Reference A.R.G. and L.P.P.7] used YOLOv4 to recognize the charging port and completed the charging gun insertion process using a flexible manipulator to reduce the interference caused by visual positioning errors. Zhang et al. [Reference Zhang, Geng, Xu, Li, Zhang, Liu, Nie, Yu and Song8] used an RGB-D camera to locate the charging port. They first obtained the approximate region of the charging port based on the depth image, and then accurately located the charging port using an improved Canny edge detection algorithm and a combination of shape recognition algorithms.
The aforementioned research solely addressed the accuracy localization problem when the charging port is clearly imaged without accounting for defocused situations. Moreover, many studies rely on one-time localization results to guide robot movement [Reference Lv, Chen, Hu and Lou3, Reference Guo, Xie, Yu, Wang and Xiong9]. However, studies also show that in the presence of defocus blur and noise, the localization accuracy of the model can be compromised [Reference Ding, Pei, Yang and Chen10], resulting in reduced servo efficiency or even failure. Therefore, studying the localization and dynamic search problem in out-focus and blurry imaging is necessary.
2.2. Virtual image synthesis technology
By generating image data within virtual environments, it’s possible to generate high-quality data for training object detection models at a reduced cost. However, the discrepancy in distribution between virtual and real images presents the challenge of the sim2real gap. To mitigate this gap, techniques such as domain adaptation (DA) [Reference Csurka11] and domain randomization (DR) [Reference Tobin, Fong, Ray, Schneider, Zaremba and Abbeel12] are frequently employed.
DA aims to transfer the model by evaluating the data distribution of the source and target domains, narrowing the distribution gap between them, or projecting the data into a common space. Computer graphics rendering [Reference Tsirikoglou, Kronander, Wrenninge and Unger13], GAN-based methods [Reference Niu, Li, Wang and Lin14–Reference Jing, Qian, Jianu and Luo16], and copy-paste strategies [Reference Chen, Wan, Matsushita, Kotaka and Harada17–Reference Zeng, Teoh, Zhu, Toh and Chen20] are often used to generate photorealistic images. However, generating photorealistic images demands substantial computational resources, thus impeding the generation speed. The above methods, such as GAN-based and copy-paste, require the collection of numbers of real images, the generated images are closely related to the collections and do not completely resolve the issue of data limitations [Reference Gong, Liu, Wang, Liu and Hu21].
On the other hand, DR expands the distribution range of the source domain by employing a large number of randomized parameters. With a large number of target images generated by random parameters to train the model, the model can learn more general features, such as shape features, without overfitting to specific domains, thus improving the generalization ability across different domains. Recently, DR has been used in robotic grasp [Reference Todorov, Erez and Tassa22], assembly [Reference Triyonoputro, Wan and Harada23, Reference Xiao, Yang, Jiang and Zhang24], and object detection [Reference Barisic, Petric and Bogdan25–Reference Singh, Seneviratne and Hussain27]. In the traditional DR, randomization of obstacles, textures, camera, light source, and noise is commonly used. However, it should be noted that these graphic renderings will significantly burden the computer, leading to low efficiency. Some studies reduce this burden by replacing the physics engine [Reference Kollar, Laskey, Stone, Thananjeyan and Tjersland28] or setting up a structured random environment [Reference Prakash, Boochoon, Brophy, Acuna, Cameracci, State, Shapira and Birchfield29]. Besides, it’s found that not all the randomization parameters are beneficial to the results. Redundant parameters exist [Reference Tobin, Fong, Ray, Schneider, Zaremba and Abbeel12]. Therefore, it’s necessary to analyze specific application scenarios and task characteristics, reduce randomization parameters, and improve the quality and efficiency of image generation.
2.3. Autofocus strategy
Precise focus is crucial for obtaining clear and accurate images. Without accurate focus, images appear blurry and fail to reflect the true scene information. The autofocus strategy dynamically adjusts the distance between the camera and the object to capture clear images based on the sharpness evaluation function, which is mainly based on the edge features [Reference Qin-zhang30] or gradient [Reference Li, Chen, Wan, Li, Lin, Tan, Shi, Zomaya, Yan and Cai31]. The sharpness evaluation function exhibits unimodal characteristics, and the mountain-climbing approach is commonly employed to search for the optimal focus position, which involves initially moving forward and then backward to ascertain the clearest position with a maximum sharpness value [Reference Jia, Zhang, Wu, Zhou and Guo32]. However, when this technology is applied to robot automatic charging systems, it may come with two problems: 1) collisions, when the camera moves forward within very close working distance and 2) low efficiency.
Our method is different from existing methods. Firstly, in contrast to current charging port detection techniques, the proposed method considers the localization issue in blurry imaging conditions. In addition, it employs synthetic image data to train the DCNN, thereby reducing the cost of data collection. Conversely, current visual localization techniques for charging ports are developed under the premise of clear imaging, and necessitate the acquisition of a substantial quantity of real-world images for training and validation. Secondly, regarding image synthesis techniques, current DR methods incorporate excessive randomized parameters, potentially resulting in redundancy and diminished detection performance. The proposed TOPP method is task-oriented, enhancing the efficiency of image synthesis and ensuring that the generated images align more closely with task features, thus augmenting the performance of the trained object detector. Ultimately, regarding the focusing strategy, current sharpness evaluation algorithms rely on the entire image, whereas our method estimates based on the object area. This transforms the sharpness estimation problem based on mountain-climbing into a threshold comparison problem. Through the design of visual servoing, the overall process becomes more efficient and stable.
3. Methodology
In this section, the proposed visual localization framework is introduced. A TOPP is first designed to generate a high-quality dataset. Then, an autofocus strategy that consists of a hybrid detector and visual servoing module is developed, while the detector determines the sharpness and location of the current charging port and provides the result to the visual servoing module.
3.1. TOPP for port image synthesis
In this section, DR is used to generate charging port images, which will provide a large number of images with complex backgrounds and blur and noise characteristics. The traditional DR method randomizes an unordered and large number of parameters, which is inefficient and may have a negative impact on the detection results. For specific scenarios, targeted randomization parameters can be designed to improve synthetic data’s sim2real performance and efficiency.
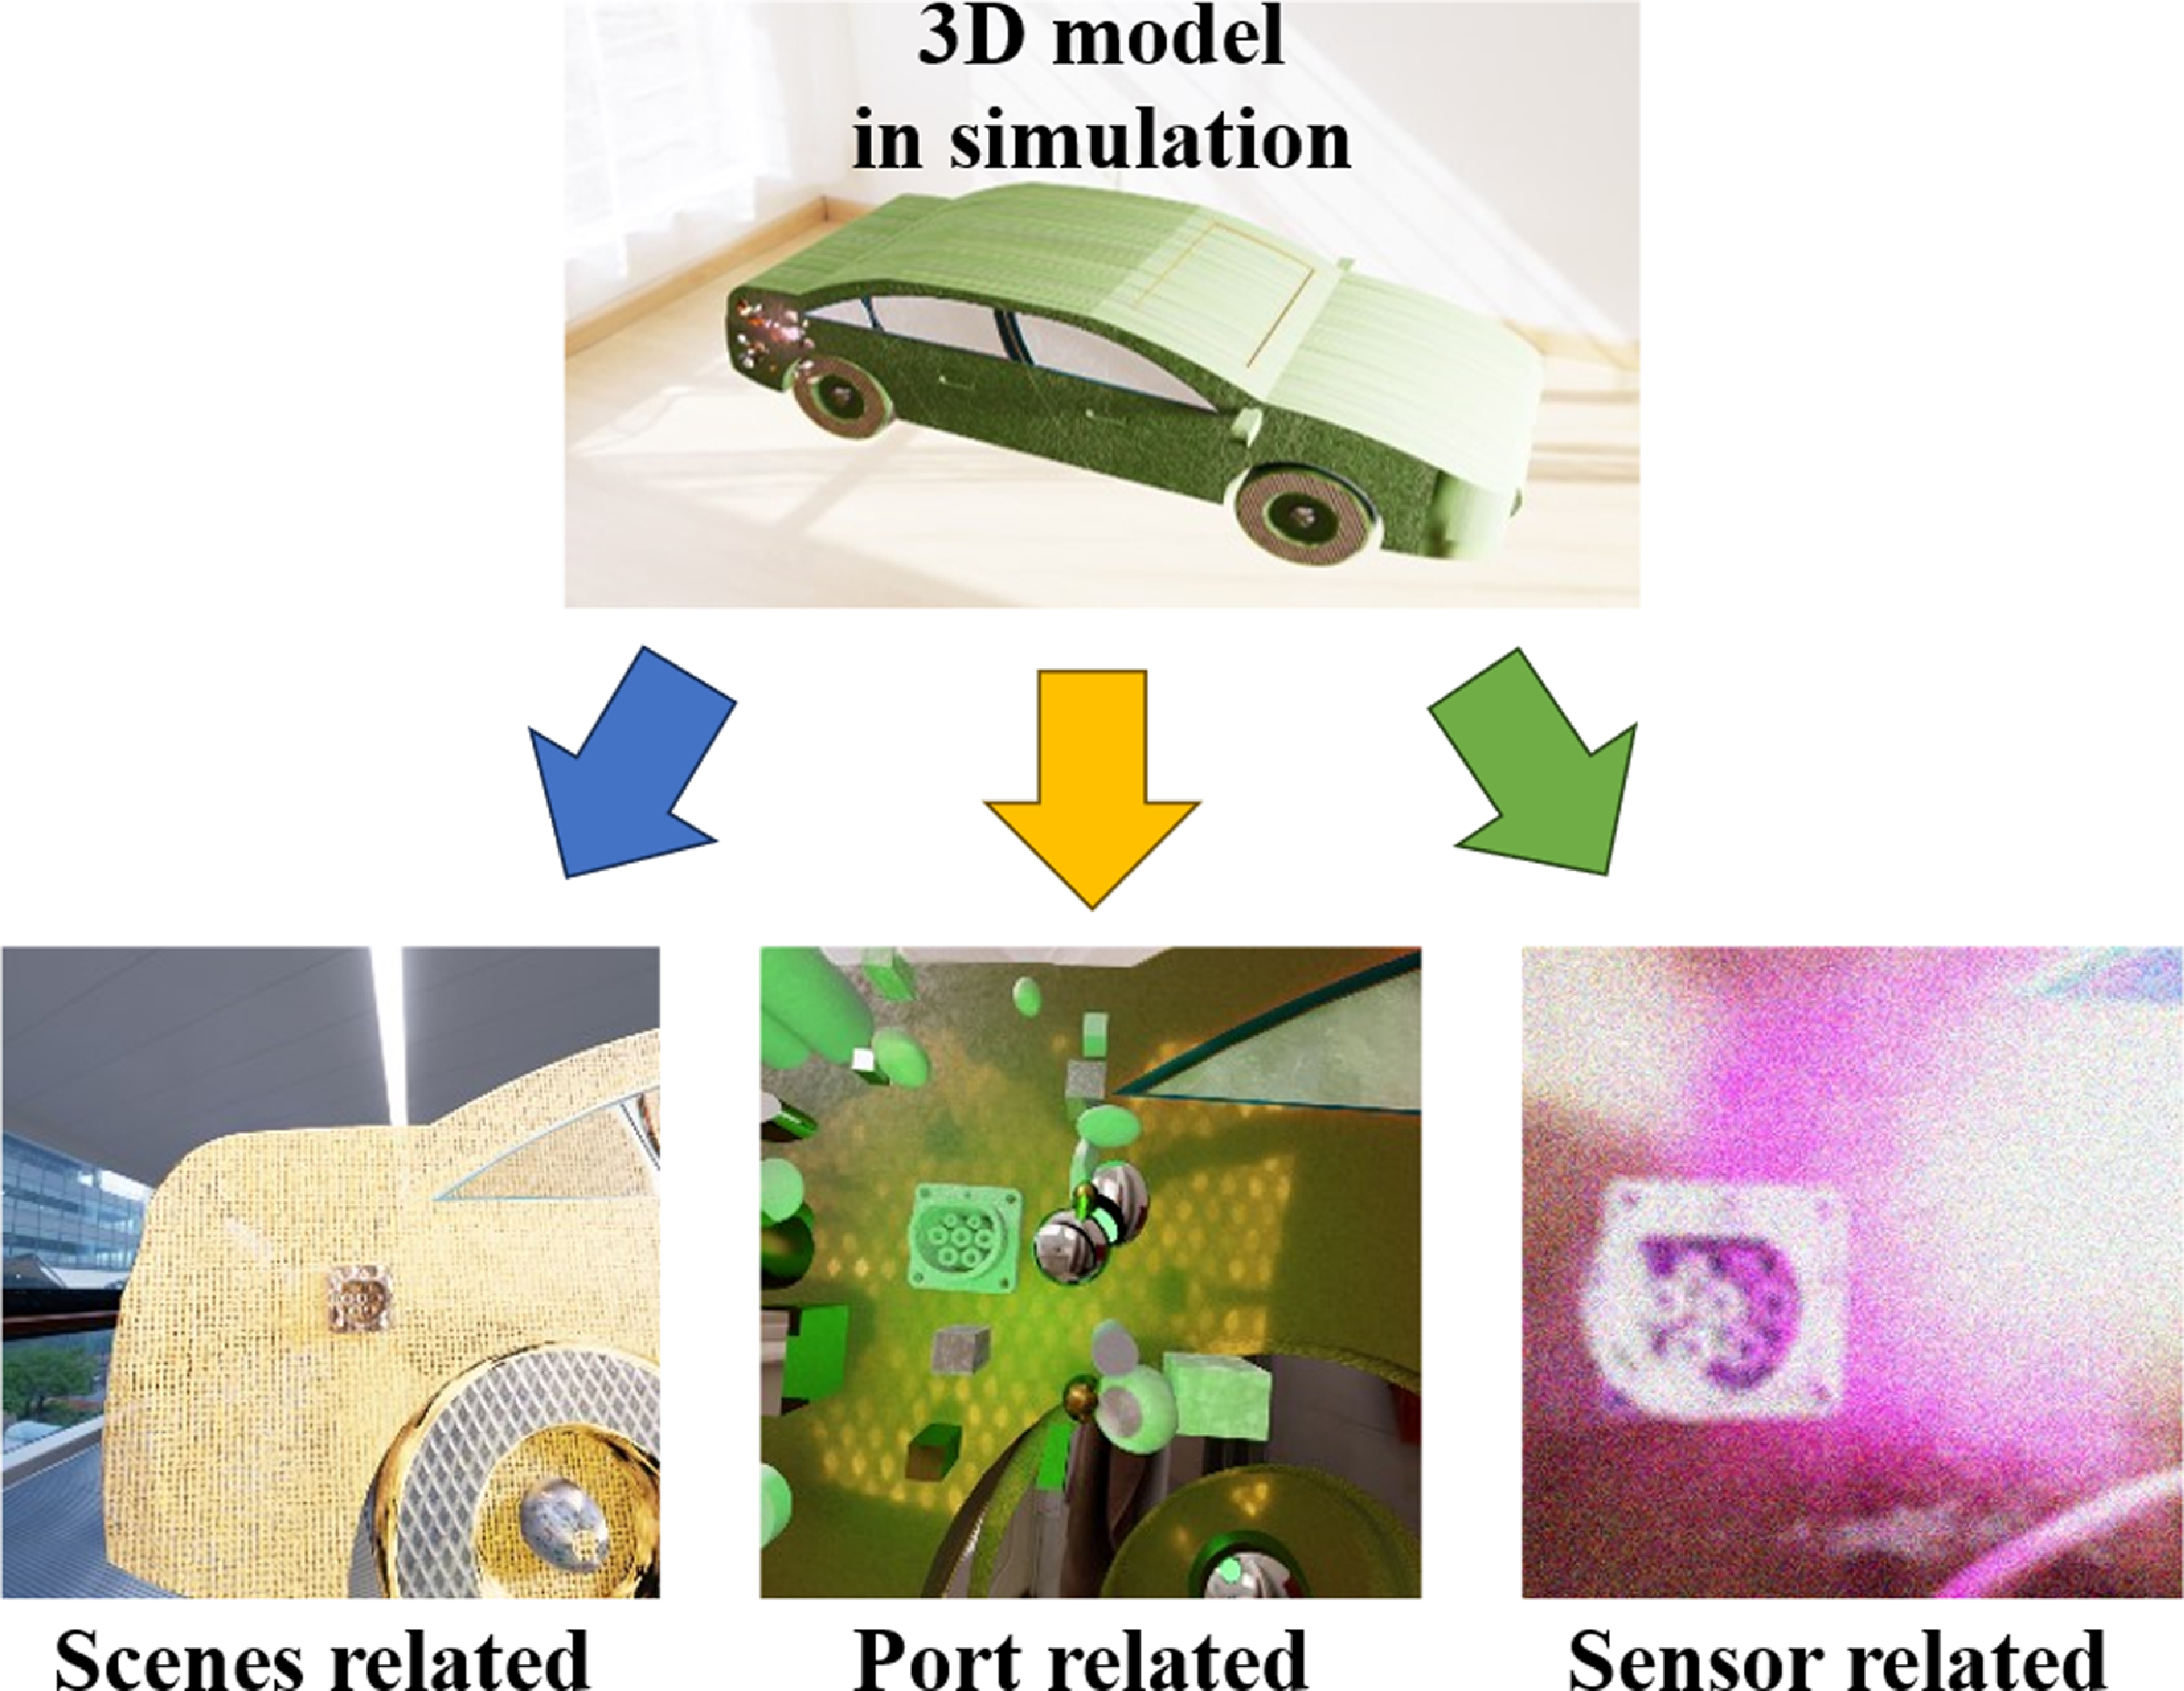
An efficiency TOPP is proposed by analyzing the EVs charging scenario, which divides the randomization parameters into three parts related to the scene, port, and sensor of the task, as shown in Figure 2.
Parameterization protocol for port images.

-
• Scene-related design:
A 3D model of the car is imported into the virtual environment and divided into three parts: the body, wheels, and windows, which enable the camera to collect more types of textures. In addition, the 3D model of the GB/T 20,234 standard AC charging port is fixed at the rear side of the car, and a background is added to simulate different environments. Global and local light sources are also set up, with the former being used to simulate sunlight or indoor lighting while the latter shines directly on the charging port to simulate strong, close-range lighting, such as an eye-in-hand light source.
-
• Port-related design:
Shape-based representations are important in object detection. Previous works use randomization of a large number of textures to make the detector pay more attention to the geometric shape of the object [Reference Barisic, Petric and Bogdan25] or with random flying distractors to make the detector focus on the object of interest [Reference Tremblay, Prakash, Acuna, Brophy, Jampani, Anil, To, Cameracci, Boochoon and Birchfield33]. In order to reduce randomization parameters to improve generation speed while maintaining detector performance, it’s possible to analyze the shape of the charging port and design the shape of distractors in a more targeted manner.
The charging port is composed of regular shapes such as cylinders and cubes, which are commonly presented in the images as circles, ellipses, rectangles, and so on. Some distractors in the real world can also represent these common geometric shapes, such as logos, car lamps, and stickers. It’s necessary to generate a dataset that contains similar shape distractors. The 3D port shape-related distractors are added to the scene, including cones, cylinders, and rectangular prisms, with random position, number, scale, and texture.
-
• Sensor-related design:
The localization utilizes a camera for dynamic searching. Thus, a camera is placed in front of the charging port, and at each step of the simulation, its angle and position are randomly altered. To ensure the charging port remains within the camera’s field of view, the variable parameters are adjusted based on the distance between the camera and the charging port. The angle is adjusted according to the distance between the camera and the charging port, with a minor angle variation for closer distances and a more significant variation for farther distances. In addition, the obtained images are post-processed using Gaussian noise and mean filtering, while the mean and variance of the Gaussian noise and the size of the mean filtering convolution kernel are randomly varied to simulate different camera and lens configurations. The parameter range can be empirically determined by comparing synthesized results with a range of real-world images collected under typical operating conditions. To ensure generalizability, a slightly extended parameter range can be used to cover the variations and uncertainties commonly encountered in real-world environments.
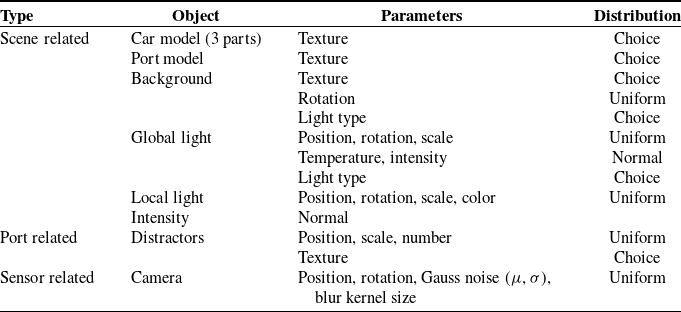
Table I presents the types and distributions of DR objects and parameters in the data generation process. The Choice distribution randomly selects a type from the candidate pool for display. The Uniform distribution samples numerical values uniformly within a certain range, while the Normal distribution samples values according to a Gaussian distribution.
Domain randomization parameters.

3.2. Autofocus and port searching strategy
By generating images using TOPP, the system can localize the charging port in complex, noisy environments. However, when the working distance is outside the optimal range, noise and blurriness appear in the images. This adversely affects localization accuracy, because the features of the charging port become indistinct. Therefore, it is essential to design autofocus and search strategies. These strategies should guide the robot to positions with clear imaging and will facilitate precise localization.
3.2.1. Design of hybrid detector
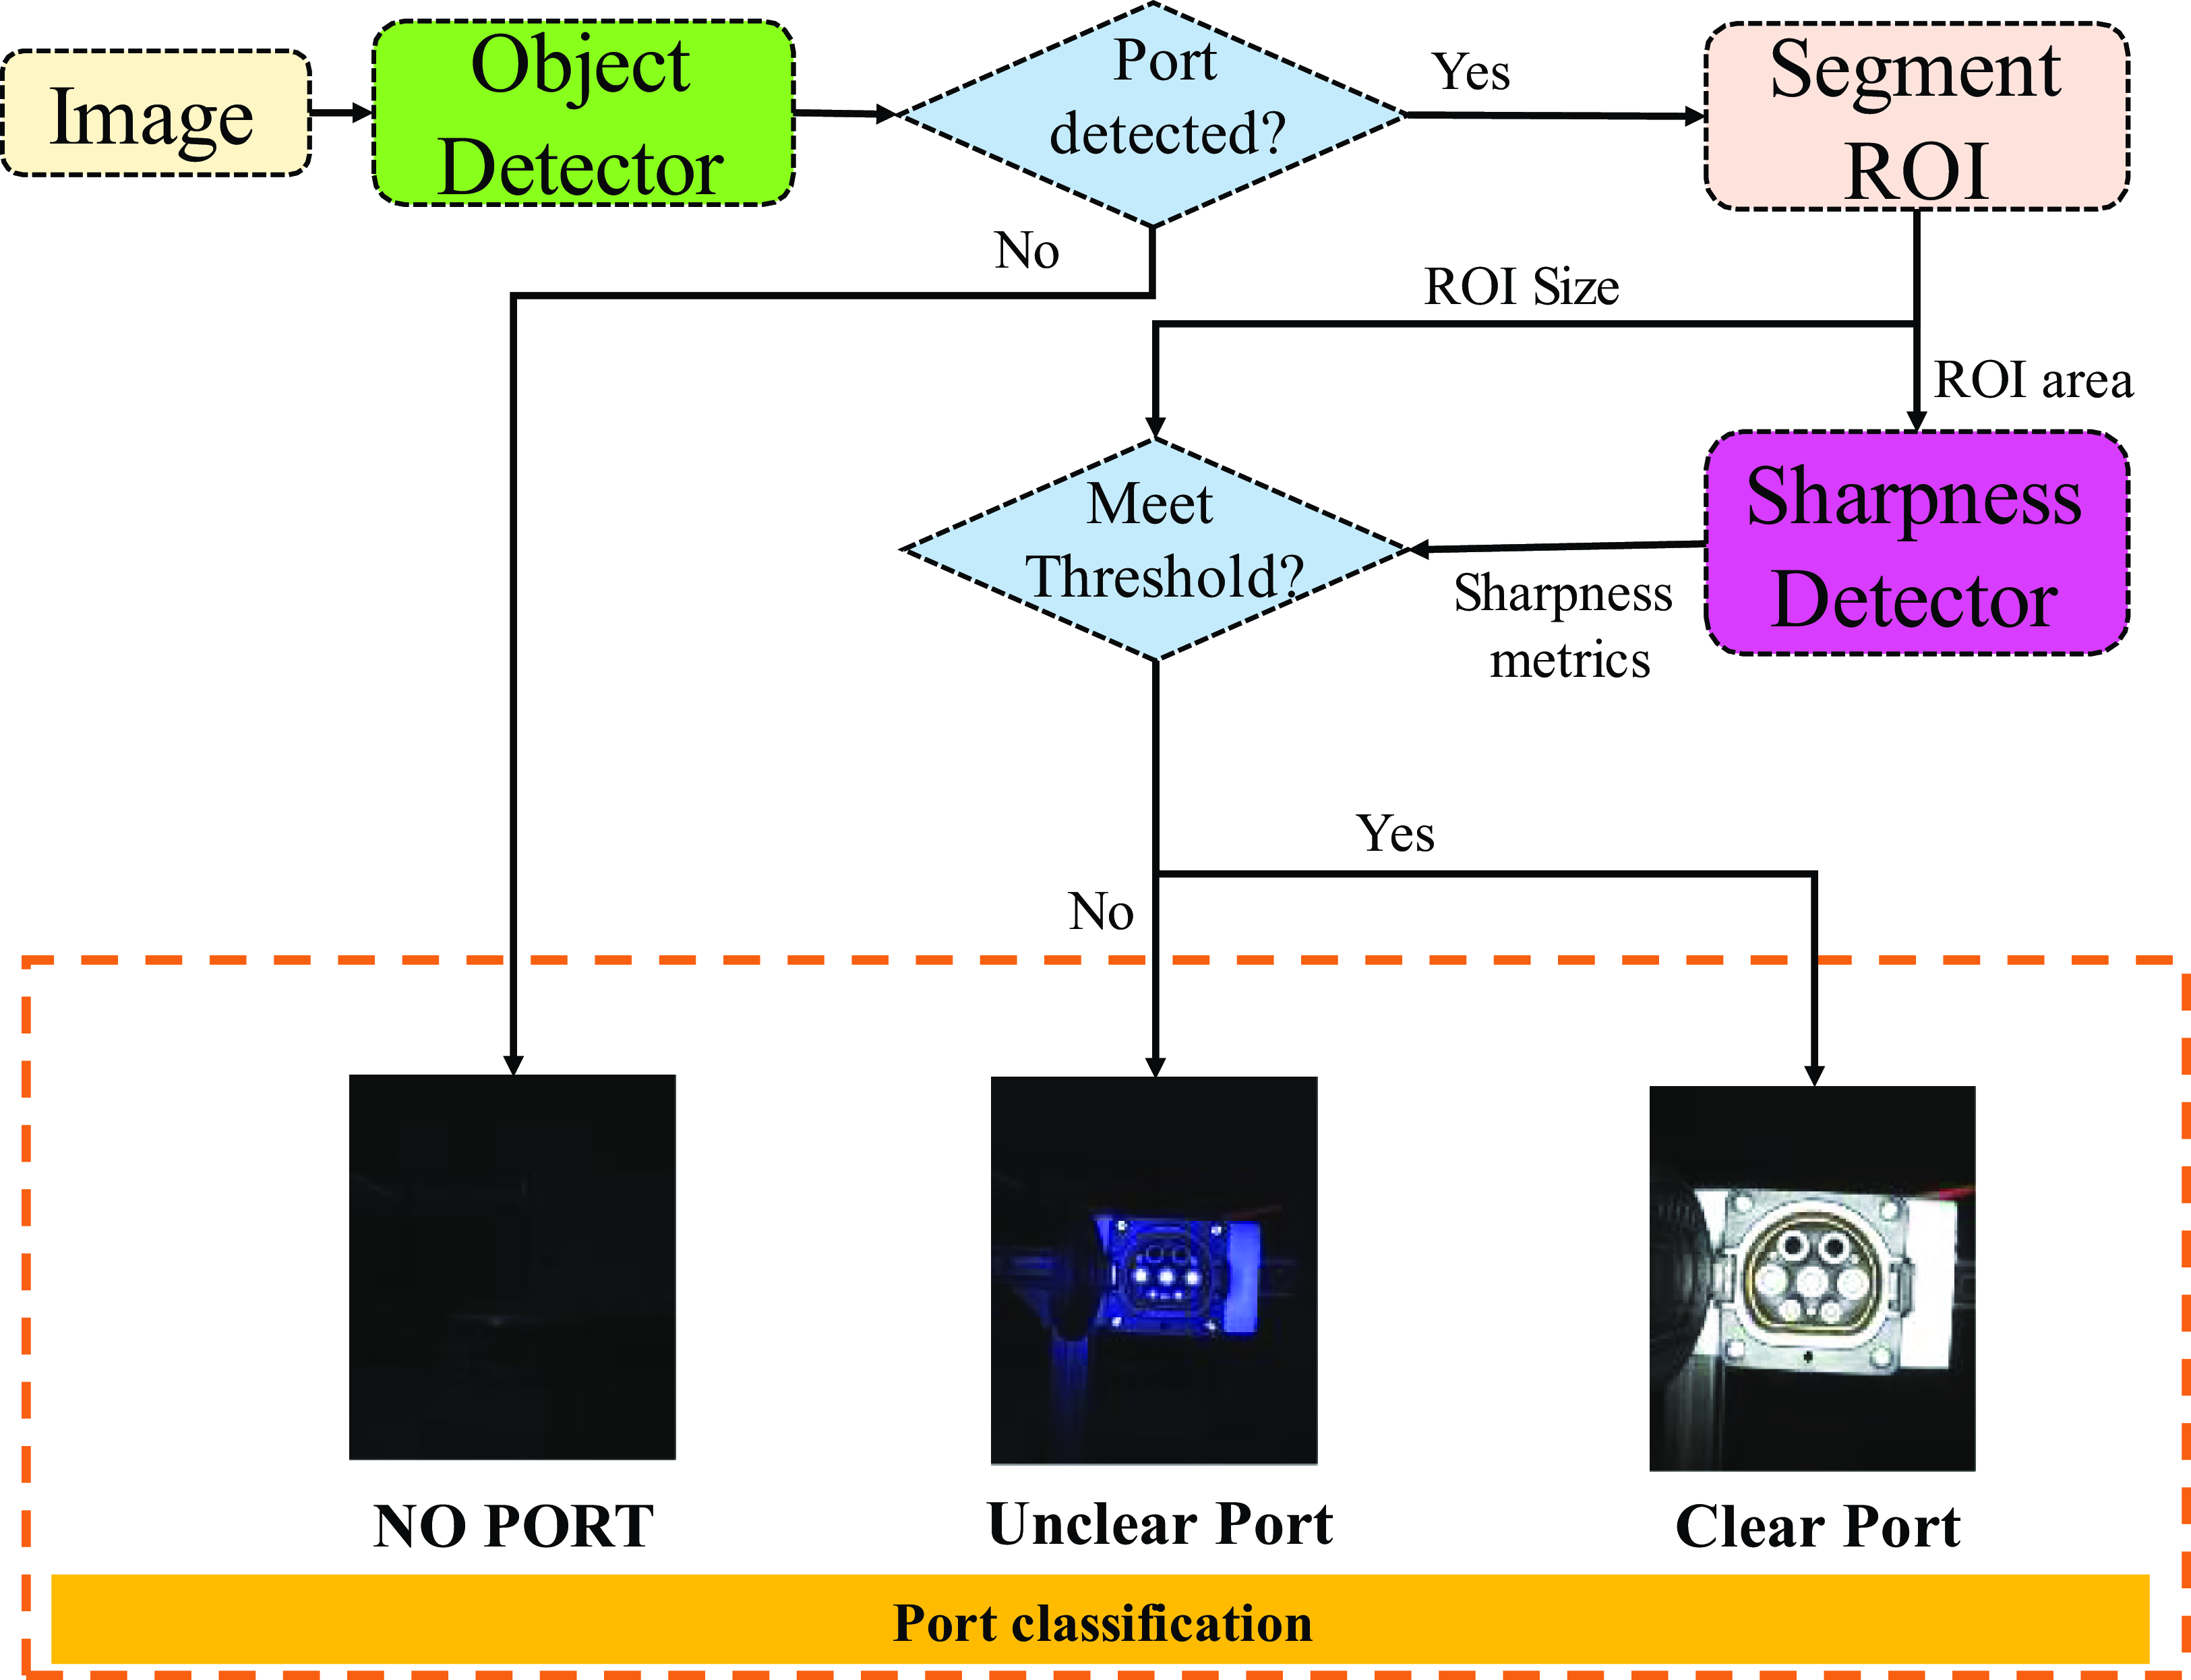
The traditional mountain-climbing focus search strategy involves two problems, primarily due to uncertainty in the sharpness evaluation window and background interference. If the window can be determined, the optimum sharpness value in the window can be calibrated in advance, and the maximum sharpness value search question can be converted into a threshold comparison problem without the need for a mountain-climbing approach. In this section, a hybrid detector is designed to assess sharpness within the port ROI and classify the port type, as shown in Figure 3.
Design of hybrid detector.

The detector consists of an object detector and a sharpness detector, which jointly output the position and type of the charging port. The object detector is based on a DCNN model that trains on the images and labels generated in the virtual environment, and it outputs the position information, including the center coordinates and the size (i.e., length and width) of the port’s bounding box. Then, the sharpness detector is responsible for determining the sharpness of the object to determine whether it’s clear enough. The hybrid detector works as follows:
-
• Segment target region: Obtain the output bounding box of the object detector and extract the image inside the box as the ROI area.
-
• Calculate sharpness metrics: A gradient-based algorithm is used to extract edges in the ROI area, the sharpness value
 $\textit{S}$
is calculated as:

 \begin{equation} S=\frac{1}{N}\sum _{x}\sum _{y}\left| \nabla I\left(x,y\right)\right| \end{equation}
where
 $I$
is the grayscale image of ROI and is processed by the image filter (e.g., Gaussian filter),
 $\nabla I$
is the gradient of pixels (x, y) computed using the Sobel operator. Both the ROI selection and the filtering process help suppress noise and enhance the robustness of the sharpness metric against interference.
 $\textit{N}$
is the actual number of pixels in the ROI. Therefore, the larger the value S, the clearer it is in the ROI area.
-
• Classify the port: The number of pixels in the ROI area and edges will be compared with the threshold. Let
$N_{{\textrm{ROI}}}$
and
$S_{{\textrm{ROI}}}$
denote the actual number of pixels and sharpness value in the detected ROI, while
$N_{\text{threshold}}$
and
$S_{\text{threshold}}$
denote the ones in the threshold. The classification can be defined as: (1) If
$N_{{\textrm{ROI}}}\gt N_{\text{threshold}}$
and
$S_{{\textrm{ROI}}}\gt S_{\text{threshold}}$
, the category is set to “Clear Port.” (2) If
$N_{{\textrm{ROI}}}\lt N_{\text{threshold}}$
or
$S_{{\textrm{ROI}}}\lt S_{\text{threshold}}$
, the category is set to “Unclear Port.” (3) If no bounding box is detected, implying
$N_{{\textrm{ROI}}}=0$
, the category is set to “No Port.”


The hybrid detector that integrates position and sharpness assessments offers enhanced stability over single-threshold methods (such as solely comparing ROI area or sharpness values). When the camera is far from the object, the edge detection algorithm is susceptible to illumination variations and image blur, while the bounding box is more reliable. However, when the distance is relatively close, the illumination (mainly by the light source) and environment features will be relatively stable, and the sharpness can be calibrated in advance. The detection algorithm can accurately calculate the results and determine whether a clear image has been obtained, avoiding background interference.
3.2.2. Stable visual servoing
In this section, a visual servoing method based on the hybrid detector results is designed, making the camera move from the out-focus position to the on-focus position, with only forward motion. It can stop as soon as it reaches the clear imaging position, while motion filtering is used to reduce noise interference for stable servoing.
Velocity control based on image pixel information will be utilized to guide the robot’s movement toward the charging port, with the control variables limited to the three translation directions. Since the charging port is typically installed horizontally on the car with only a slight angle deviation, the angle adjustment can be performed during the precise positioning step.
The goal of localization is to move the robot to make the target appear in the center of the image. Given the coordinates
 $(x_{p},y_{p})$
of the target location in the image, the moving velocity
 $V=(\alpha x_{p},\alpha y_{p})$
is obtained by multiplying the current coordinates with a velocity coefficient
 $\alpha$
. The velocity is then transformed into the TCP coordinate system, which is parallel to the camera coordinate and established at the end center of the charging gun. Single Exponential Smoothing (SES) is adopted to ensure smooth motion and reduce the interference caused by missed or incorrect detections during the detection process. Therefore, the velocity along the X and Y directions is determined by
 \begin{equation} V_{t+1}={\alpha} V_{t+{\alpha}} \left(1-{\alpha} \right)V_{t-1} + \cdots +{\alpha} \left(1-{\alpha} \right)^{k}V_{t-k} \end{equation}
While the motion in the Z direction is classified by the two cases in (3).
 \begin{equation} V_{zt}=\left\{\begin{array}{ll} \text{SES }, &\quad {if}\ {class }= { unclear\ port\ or\ None}\\ 0, &\quad {if\ class}= { clear\ port} \end{array}\right. \end{equation}
When an unclear charging port is detected, it indicates that the camera has not yet approached the charging port. The robot is driven to move forward along the camera’s optical axis. When a clear charging port is detected, the motion stops. If the output category is none due to missed detection in some frames, Eq. (2) is used to allow the robot to continue moving for a certain distance.
By using this method, the camera can move from a far distance to a closer observation distance, ensuring that the image of the charging port is clear enough and contains more detailed information when the rough localization movement is complete. In the subsequent steps, the precise relative position between the charging port and the charging gun can be accurately obtained by the Perspective-n-Point (PnP) algorithms or the calibrated coefficient k(mm/pix). There have been many studies on the accurate visual localization of the charging port, such as references [Reference Pan, Sun, Liu and Wang2, Reference Quan, Lou, Lin, Liang, Wei and Di6], and this step will not be discussed in detail in this paper.
4. Experiment and analysis
The port detection effect was evaluated first (in Section 4.1), followed by a charging port search experiment in the real-world environment (in Section 4.2).
4.1. Evaluation of port detection effect
In this section, the experimental setup is first introduced in Section 4.1.1, including the hardware platform, the composition of the real-world testing dataset, and the composition of synthetic datasets used for training. Then, in Section 4.1.2, the DCNN model is trained on different synthetic datasets, and the corresponding training and detection results are presented. This includes analyses of precision, recall, detection failures, dataset generation efficiency, and visualization-based interpretation. Finally, Section 4.1.3 provides a comparative study between the proposed image generation method and other synthetic data generation approaches.
4.1.1. Experiment setup
-
a. Hardware platform:
-
A real-world image capture system and a program for synthetic image generation were established. In order to capture the defocus blur images, a mono camera (Imaging source DFK-33GX264) with a ring light source was installed on the mount. Synthetic images were generated in Nvidia-Isaac-Sim using an i7 CPU and RTX 3070 GPU computer.
-
b. Real-world dataset for testing:
-
The real-world testing dataset was only used to test the performance of the object detector in the testing stage. Considering that the searching process is dynamic and the camera is required to detect the charging port from different observation distances in real time, the dataset should include images captured at various distances. Based on the depth-of-field range of the camera and lens system, the image acquisition distances were set to approximately 10, 20, and 30 cm. At these distances, the charging port occupies approximately 50%, 30%, and 20% pixels in the image, respectively, introducing sufficient variation in scale. Furthermore, the changes in observation distance led to noticeable differences in visual characteristics such as background complexity and lighting reflections, thereby improving the diversity and realism of the dataset and ensuring better adaptability to real-world scenarios. Besides, the lens parameters and camera attributes, such as exposure and gain, were adjusted to produce images with blur and noise. Complex scenes with distractors and lights were added to test whether the detection model can recognize the charging port from a complicated background.
-
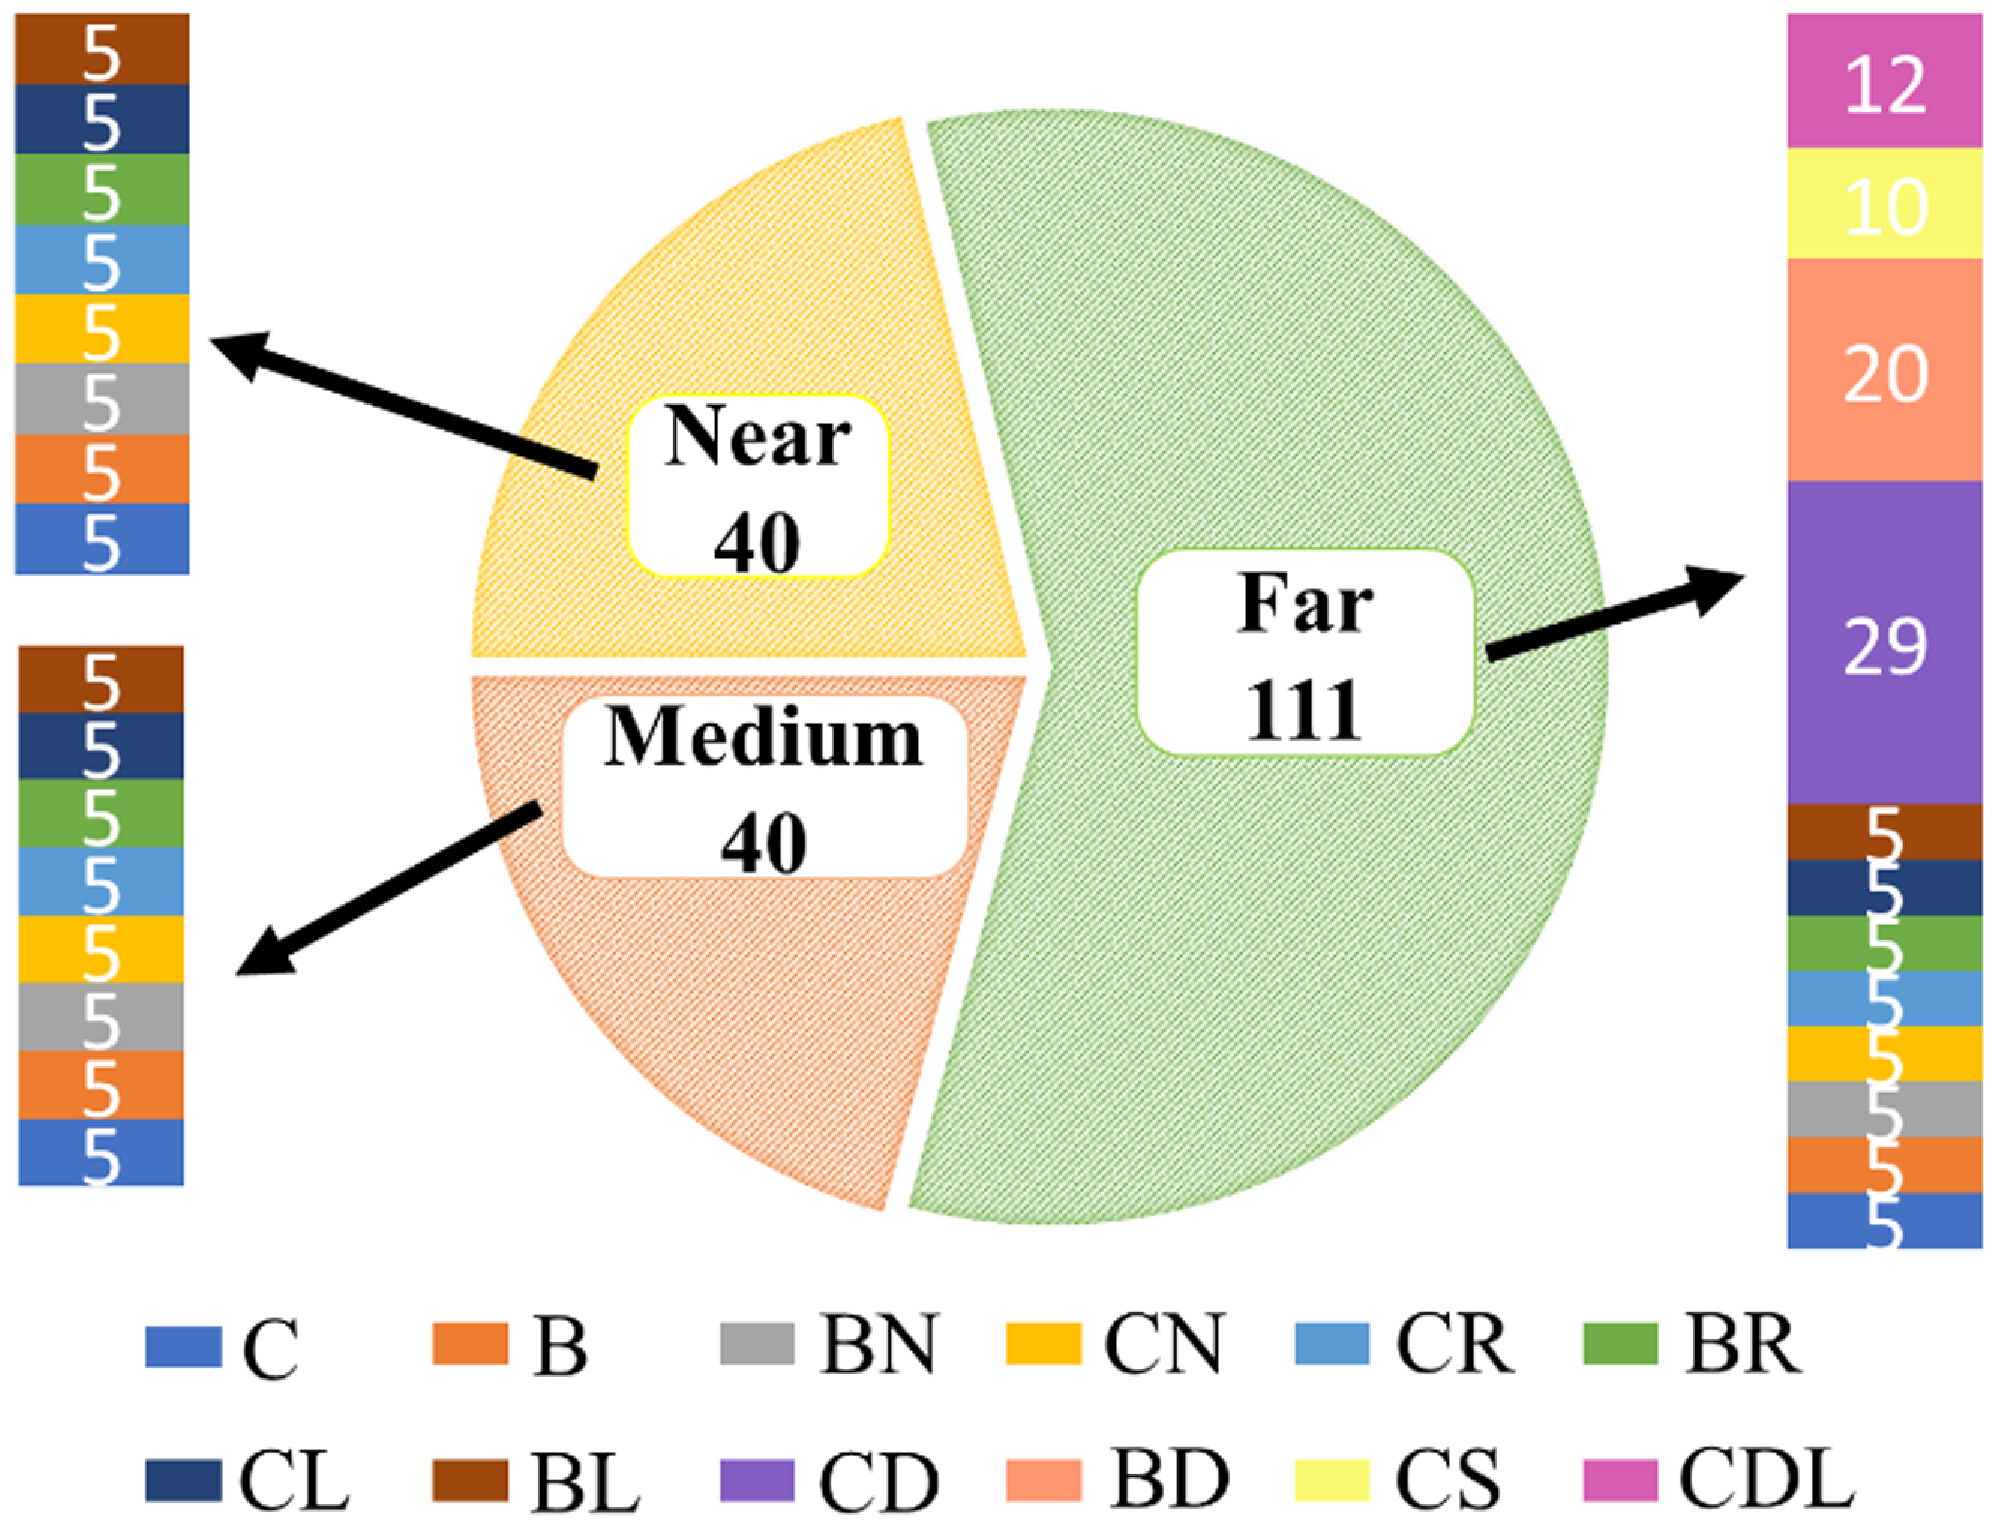
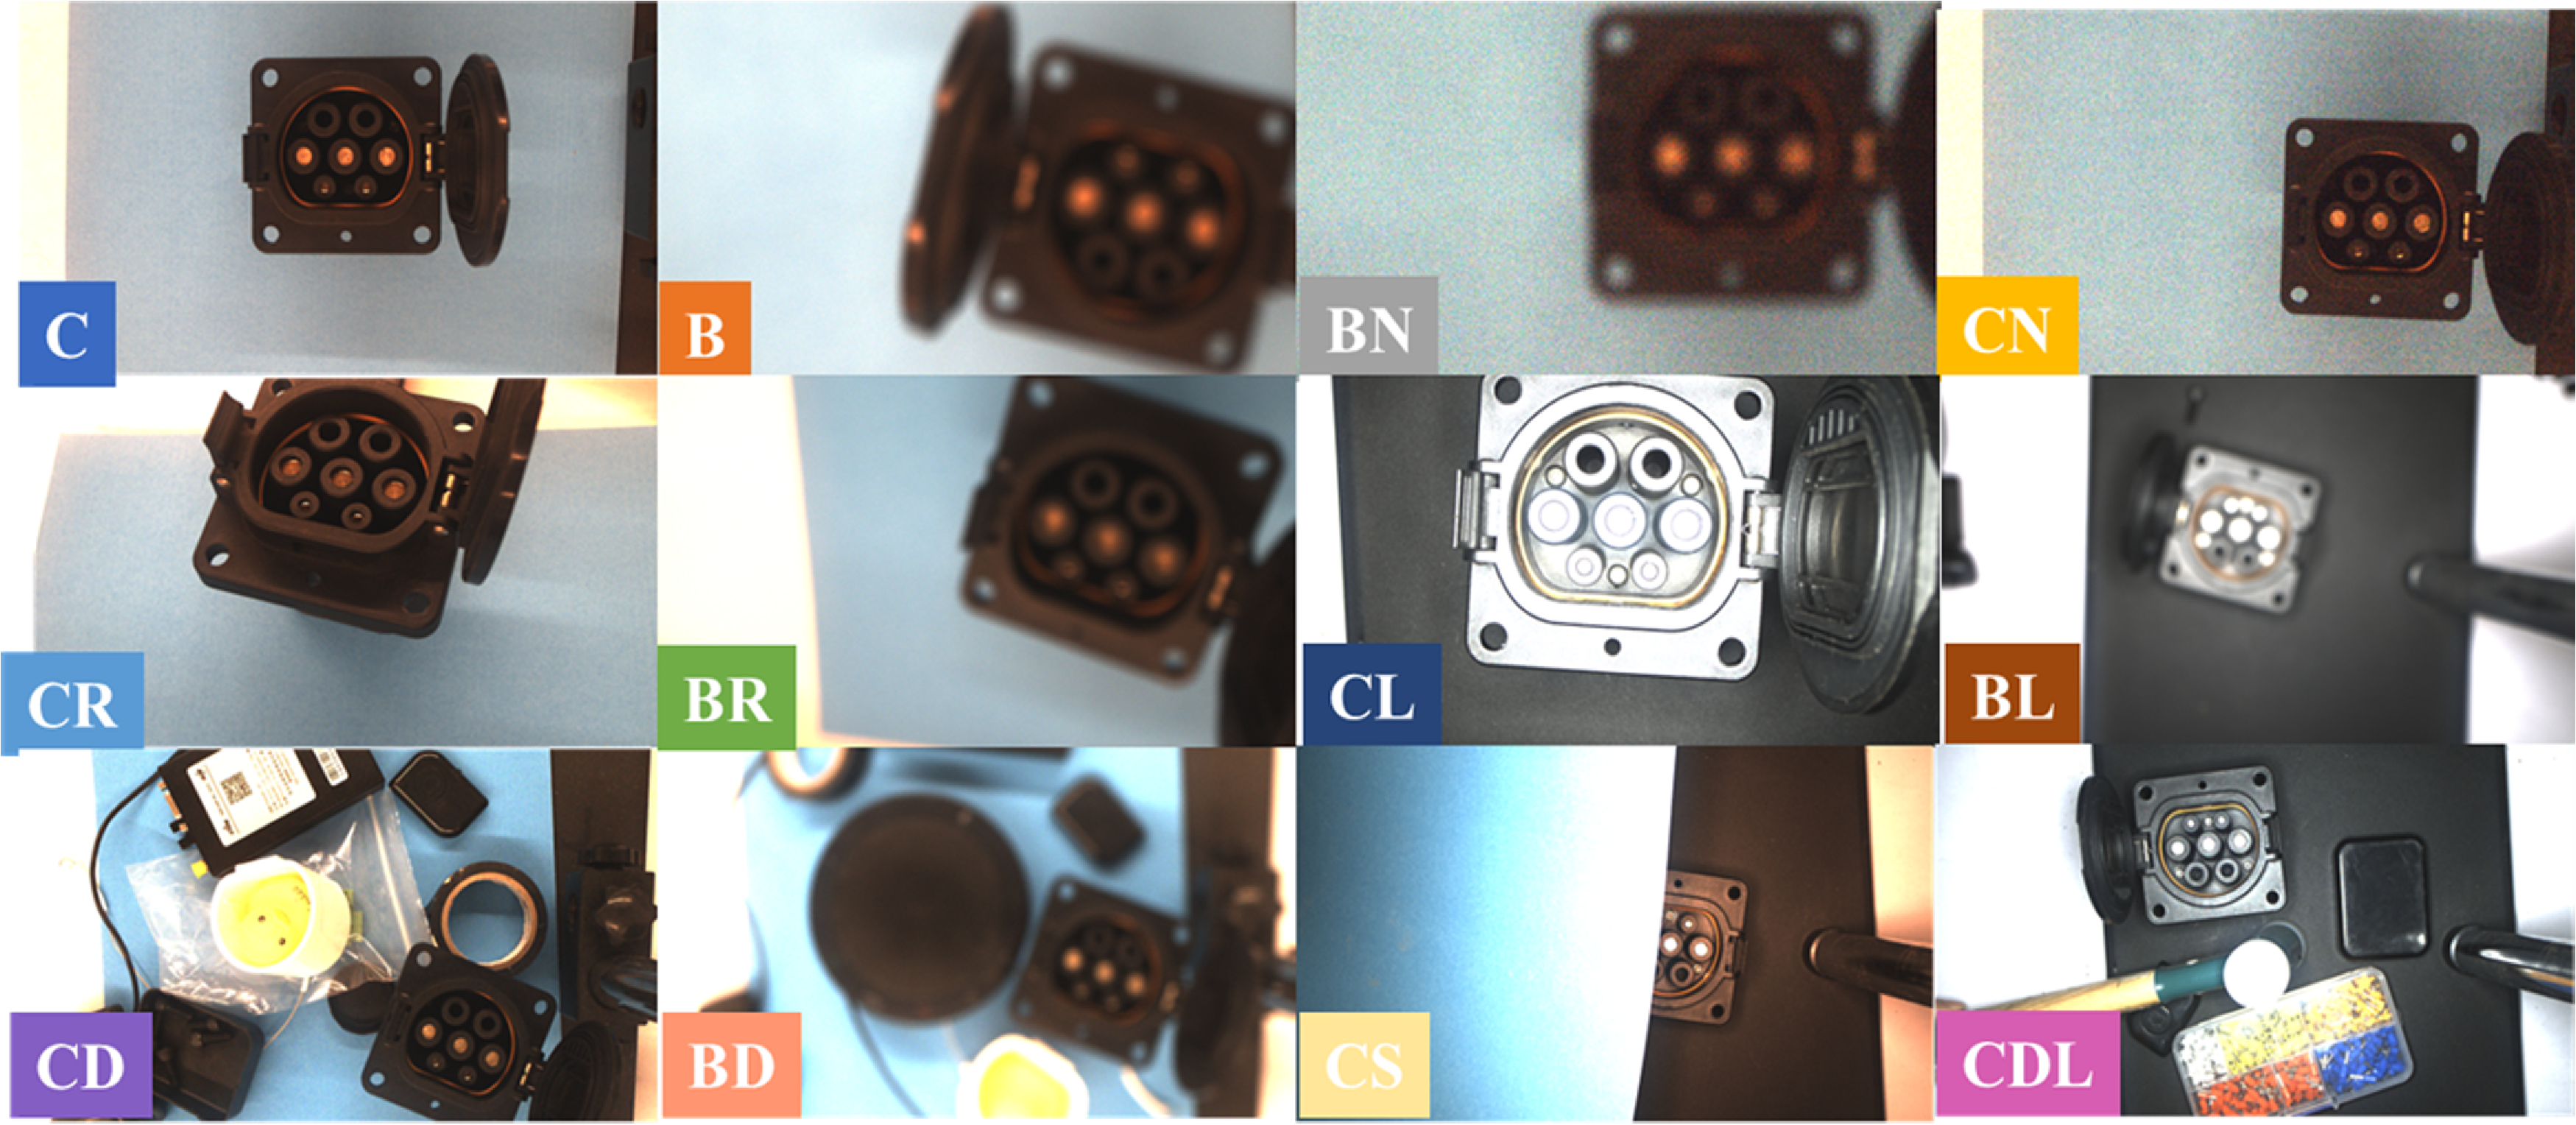
The testing dataset contains a total of 191 images, including 40 near (10 cm), 40 medium (20 cm), and 111 far (30 cm) images, the proportions of images from different distances in the testing dataset are 21%, 21%, and 58%, respectively. Besides, according to the collected environment and camera configuration, it can be divided into 12 different types of data. As shown in Figure 4, where “C,” “B,” “N” denote a clear, blurred, or noisy image, “R” denotes an angle deviation on the X and Y axes, “D” denotes the presence of distractors near the charging port, “L” denotes the use of a light source, and “S” denotes partial obstruction of the charging port. The 12 data types are “C,” “B,” “BN,” “CN,” “CR,” “BR,” “CL,” “BL,” “CD,” “BD,” “CS,” and “CDL,” and their proportions in the test dataset are about 7.8%, 7.8%, 7.8%, 7.8%, 7.8%, 7.8%, 7.8%, 7.8%, 15.1%, 10.4%, 5.2%, and 6.2%. Their quantities are 15, 15, 15, 15, 15, 15, 15, 15, 29, 20, 10, and 12. Some samples from the dataset are shown in Figure 5. Although it consists only of 191 real images collected in the laboratory environments, it covered a wide range of complex scenarios. Notably, the complexity of backgrounds and the level of occlusion present in these images were significantly more challenging than those typically encountered in real world.
-
c. Synthetic dataset for training:
-
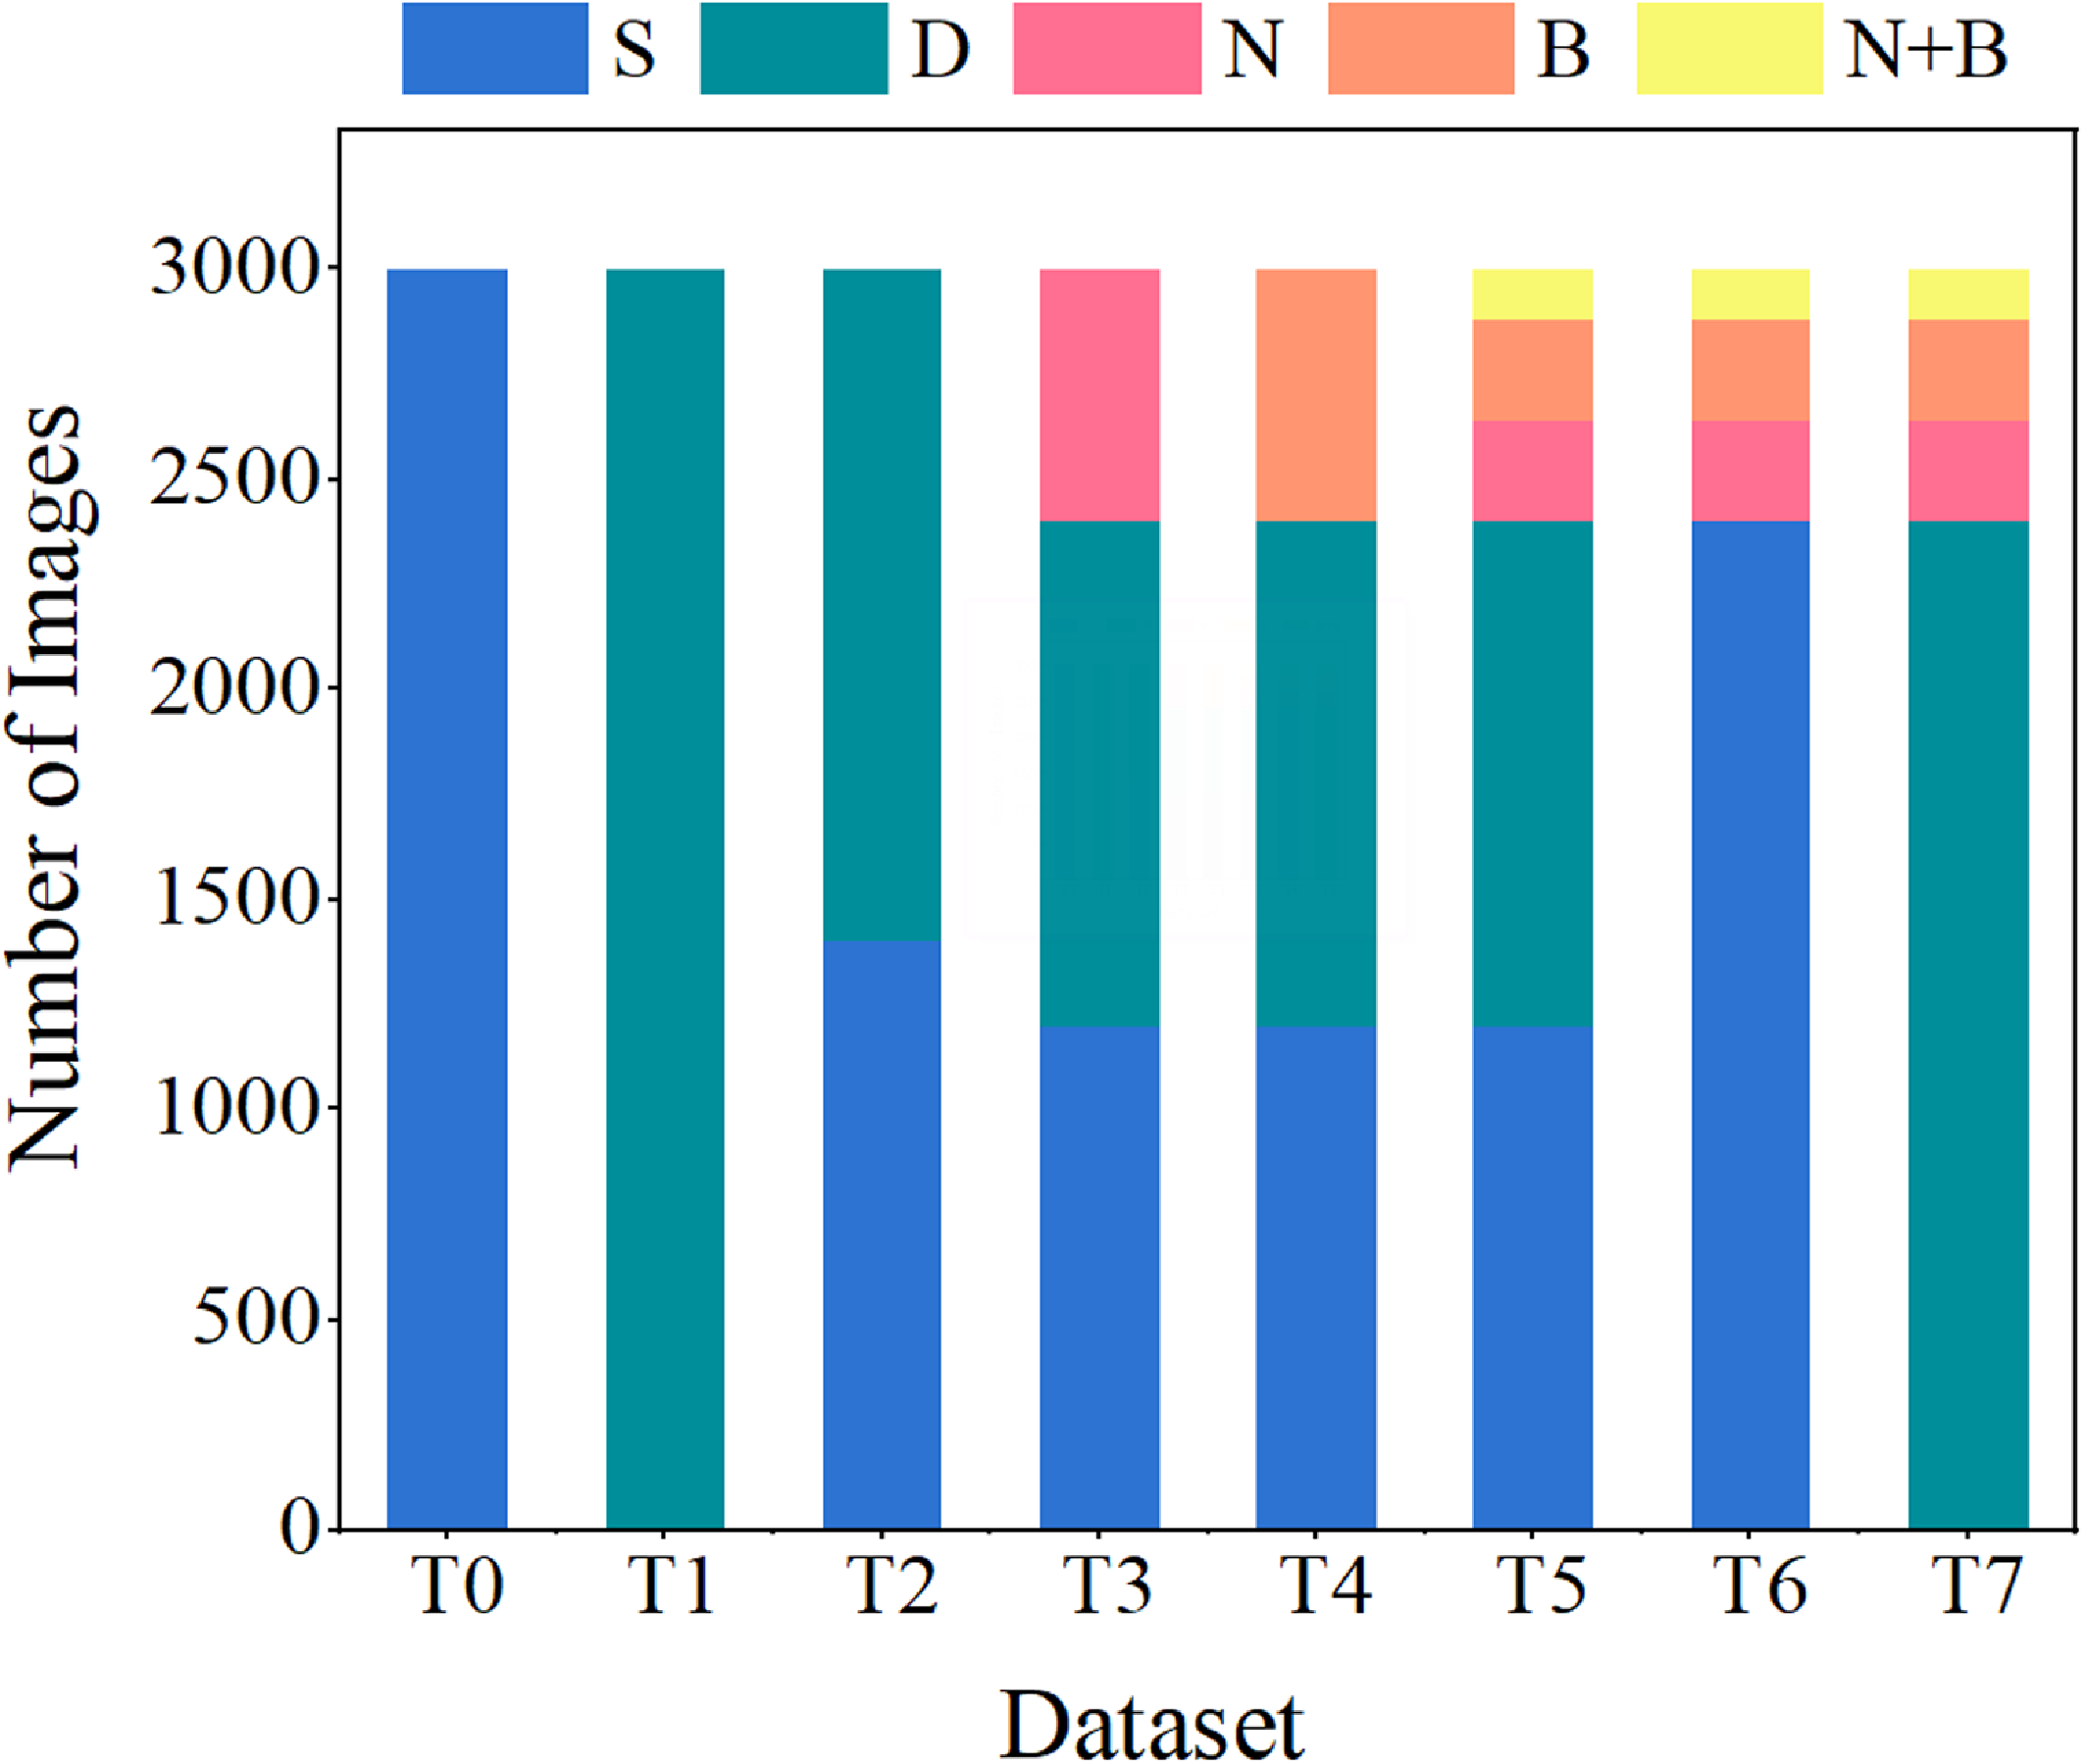
In order to study the efficiency of TOPP and its impact on the performance of the object detector, eight different simulation environments were designed in Nvidia-Isaac-Sim, and datasets with different components were generated in the environment. The composition of the different datasets is shown in Figure 6, each dataset contains 3000 images. The description is as follows:
Composition of real-world dataset for testing. The dataset was collected at three different distances, under varying lighting conditions, with diverse distractors, camera parameters, and other real-world factors.

Image samples in the real-world testing dataset. Images were collected in varied conditions. Reflecting the complexity and diversity of the testing dataset.

Composition of synthetic datasets for training. Eight different datasets were generated in the simulation to compare the training performance.

-
• T0: T0 is the baseline dataset (labeled S) used for training, which included scene-related parameters to simulate changes in texture and lighting. The quantity of “S” is 3000.
-
• T1: In the T1 dataset (labeled D), both scene-related and port-related parameters are included. The quantity of “D” is 3000.
-
• T2: The T2 dataset is a fusion of T0 and T1. The quantities of “S” and “D” are 1400 and 1600. The proportions of “S” and “D” are about 46% and 54%.
-
• T3: 20% of the images are randomly selected from the T2 dataset and added with Gaussian noise. Gaussian noise was added using parameters with a mean of 0 and a randomly selected variance ranging from 0 to 50. These noisy images are labeled with “N.” The quantities of “S,” “D,” and “N” are 1120, 1280, and 600. The proportions of “S,” “D,” and “N” are about 37%, 43%, and 20%.
-
• T4: 20% of the images from the T2 dataset are randomly selected and blurred using mean filtering with kernel sizes between 11 and 25, and these blurred images are labeled with “B.” The quantities of “S,” “D,” and “B” are 1120, 1280, and 600. The proportions of “S,” “D,” and “B” are about 37%, 43%, and 20%.
-
• T5: The T5 dataset is generated according to TOPP. It randomly selects 20% of the images from the T2 dataset, applies the blur effect, and selects 20% of the images to be added with Gaussian noise. Therefore, the images in the T5 dataset have four types: unprocessed, processed with Gaussian noise or blur, and processed with both Gaussian and blur. The quantities of “S,” “D,” “N,” “B” and “N+B” are 1120, 1280, 240, 240, and 120. The proportions of “S,” “D,” “N,” “B” and “N+B” are 37%, 43%, 8%, 8%, and 4%.
-
• T6: Generated by post-processed with sensor-related operations on T0. The quantities of “S,” “N,” “B,” and “N + B” are 2400, 240, 240, and 120. The proportions of “S,” “N,” “B,” and “N + B” are 80%, 8%, 8%, and 4%.
-
• T7: Generated by post-processed with sensor-related operations on T1. The quantities of “D,” “N,” “B,” and “N + B” are 2400, 240, 240, and 120. The proportions of “D,” “N,” “B,” and “N + B” are 80%, 8%, 8%, and 4%.
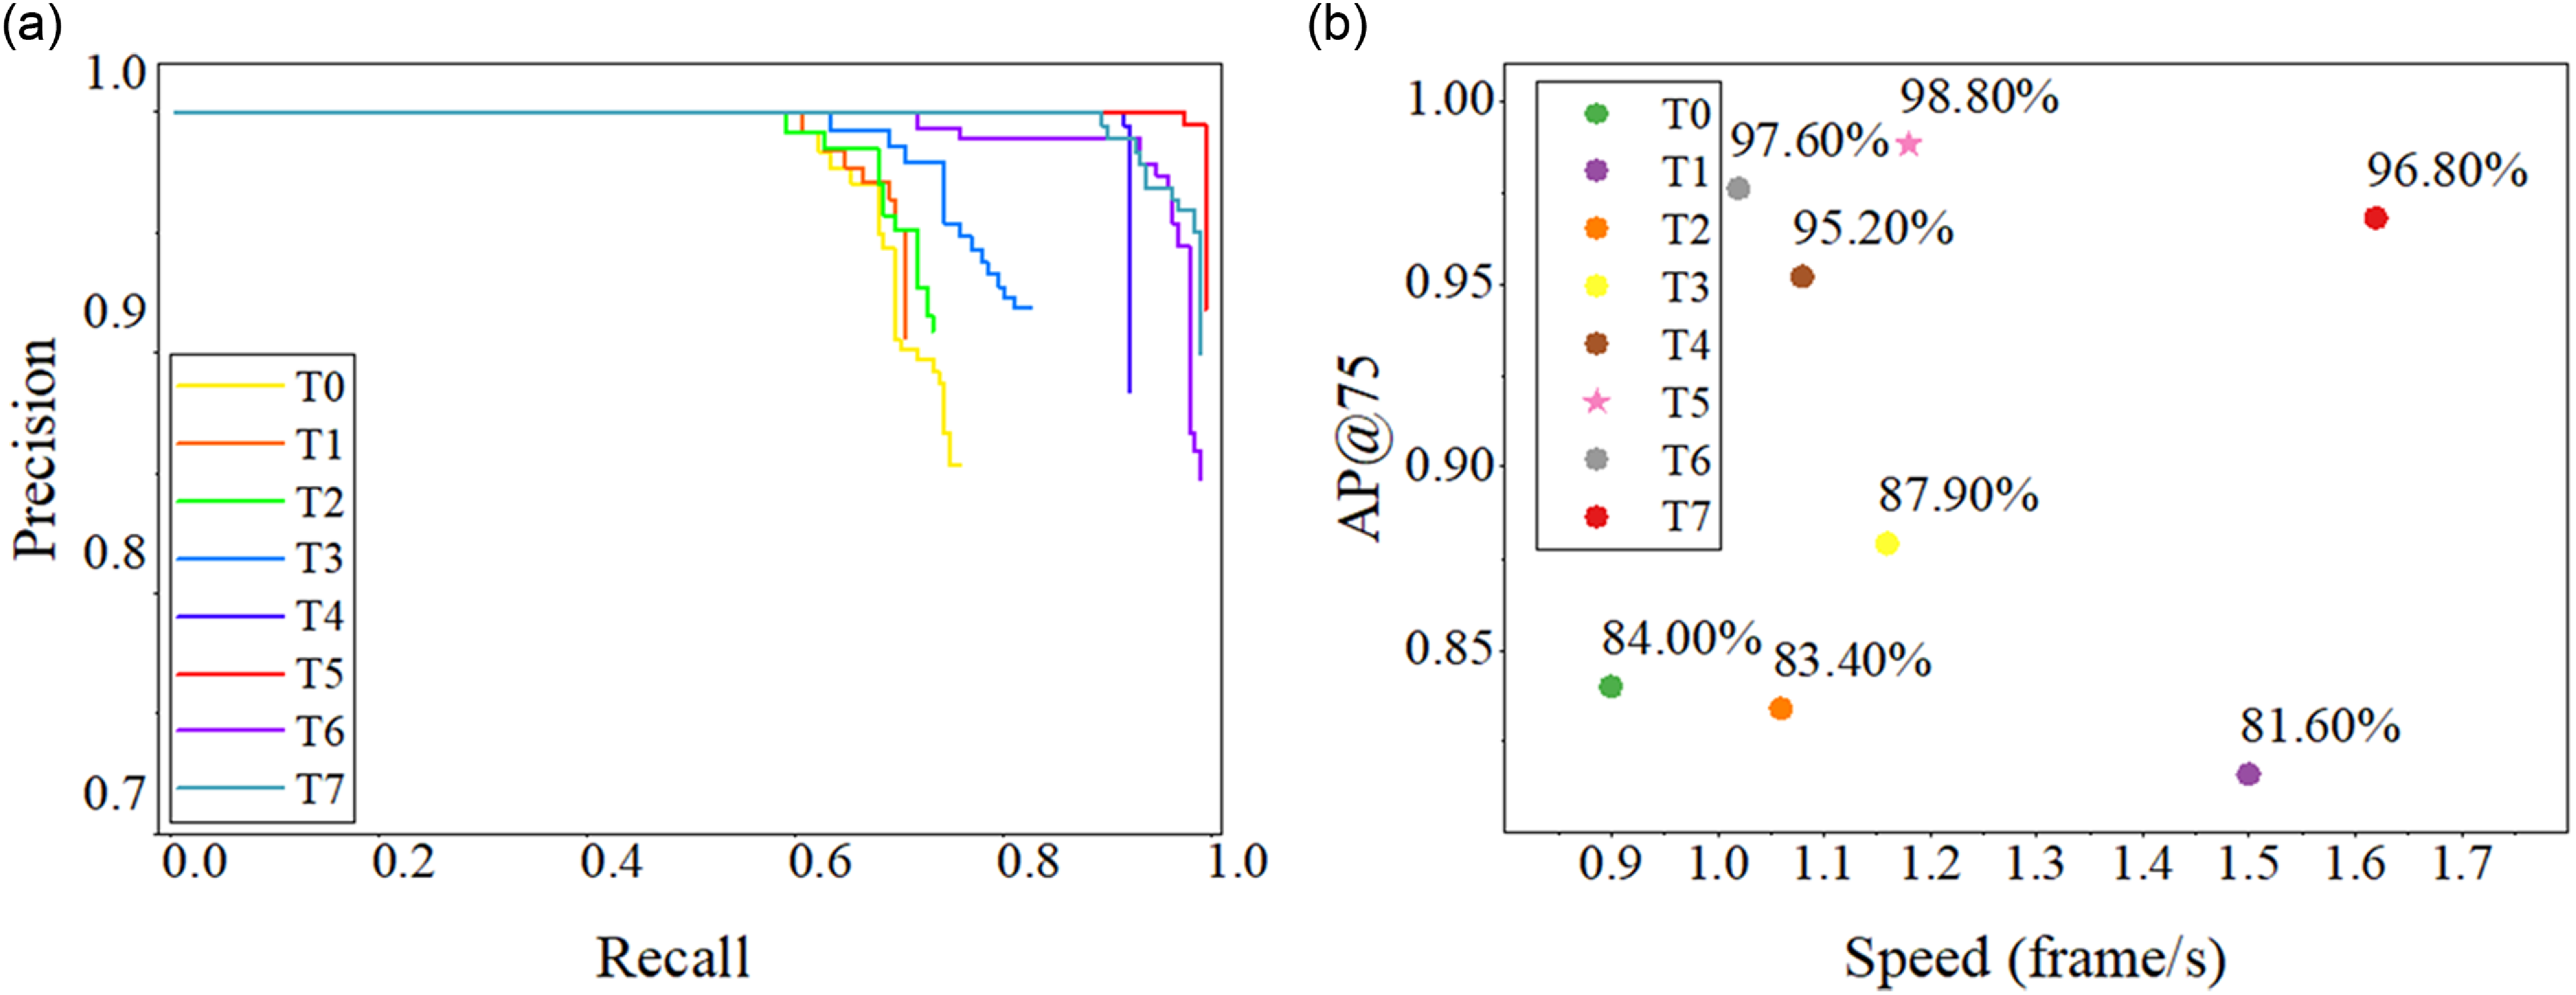
(a) Is the PR curve of model training on different datasets. (b) Is the generation speed and AP@75 of different datasets.

4.1.2. Sim2real detection result and parameter comparison
This section demonstrates the performance of the object detector trained on different training datasets.
-
a. Evaluation criteria and detector configuration:
YOLO-based object detector is selected as the object detector because its network structure allows the model to have a high inference speed (approximately 5–10 ms/frame), which can meet the real-time feedback control requirements of visual servoing. The model was trained using the synthetic dataset mentioned above. It is noteworthy that real-world images were not involved in the training process. The validation set consists of 335 additional synthetic images. Upon completion of the training process, the best-performing weights on the validation set will be selected for testing on the 191 real-world images. To evaluate the model’s transferability to real-world scenarios, bounding boxes with an Intersection over Union (IOU) greater than 75% will be considered true positives, rather than using a 50% threshold. In the visual search task, the localization results directly influence the motion, which requires the bounding boxes to cover the entire object as much as possible.
-
b. Comparison results of port detection:
The object detector (DCNN model) trained on different synthetic datasets was tested on the real-world testing dataset, and the results are shown in Figure 7(a) and Table II. The model trained on the T0 dataset performed poorly, achieving only 85.2% accuracy and a 75.9% recall rate. Adding distractors to the T1 dataset improved the model’s accuracy but reduced the recall rate. By combining T0 and T1 in the T2 dataset, the recall rate was slightly improved while maintaining accuracy. Most of the missed detections were on images with noise and blur. The T3 dataset added noise, which enabled the model to handle images with noise. Similarly, the T4 dataset added blur, significantly improved the recall rate, and the detection accuracy was already close to 1. The T5 dataset, including noise and blur, achieved recall and accuracy rates of over 98%, indicating that the model can transfer to real-world environments. Finally, the results of T6 and T7 show that scenes-related, port-related synthetic images are necessary. The lack of scenes-related-only or port-related images will impact the detection effect.
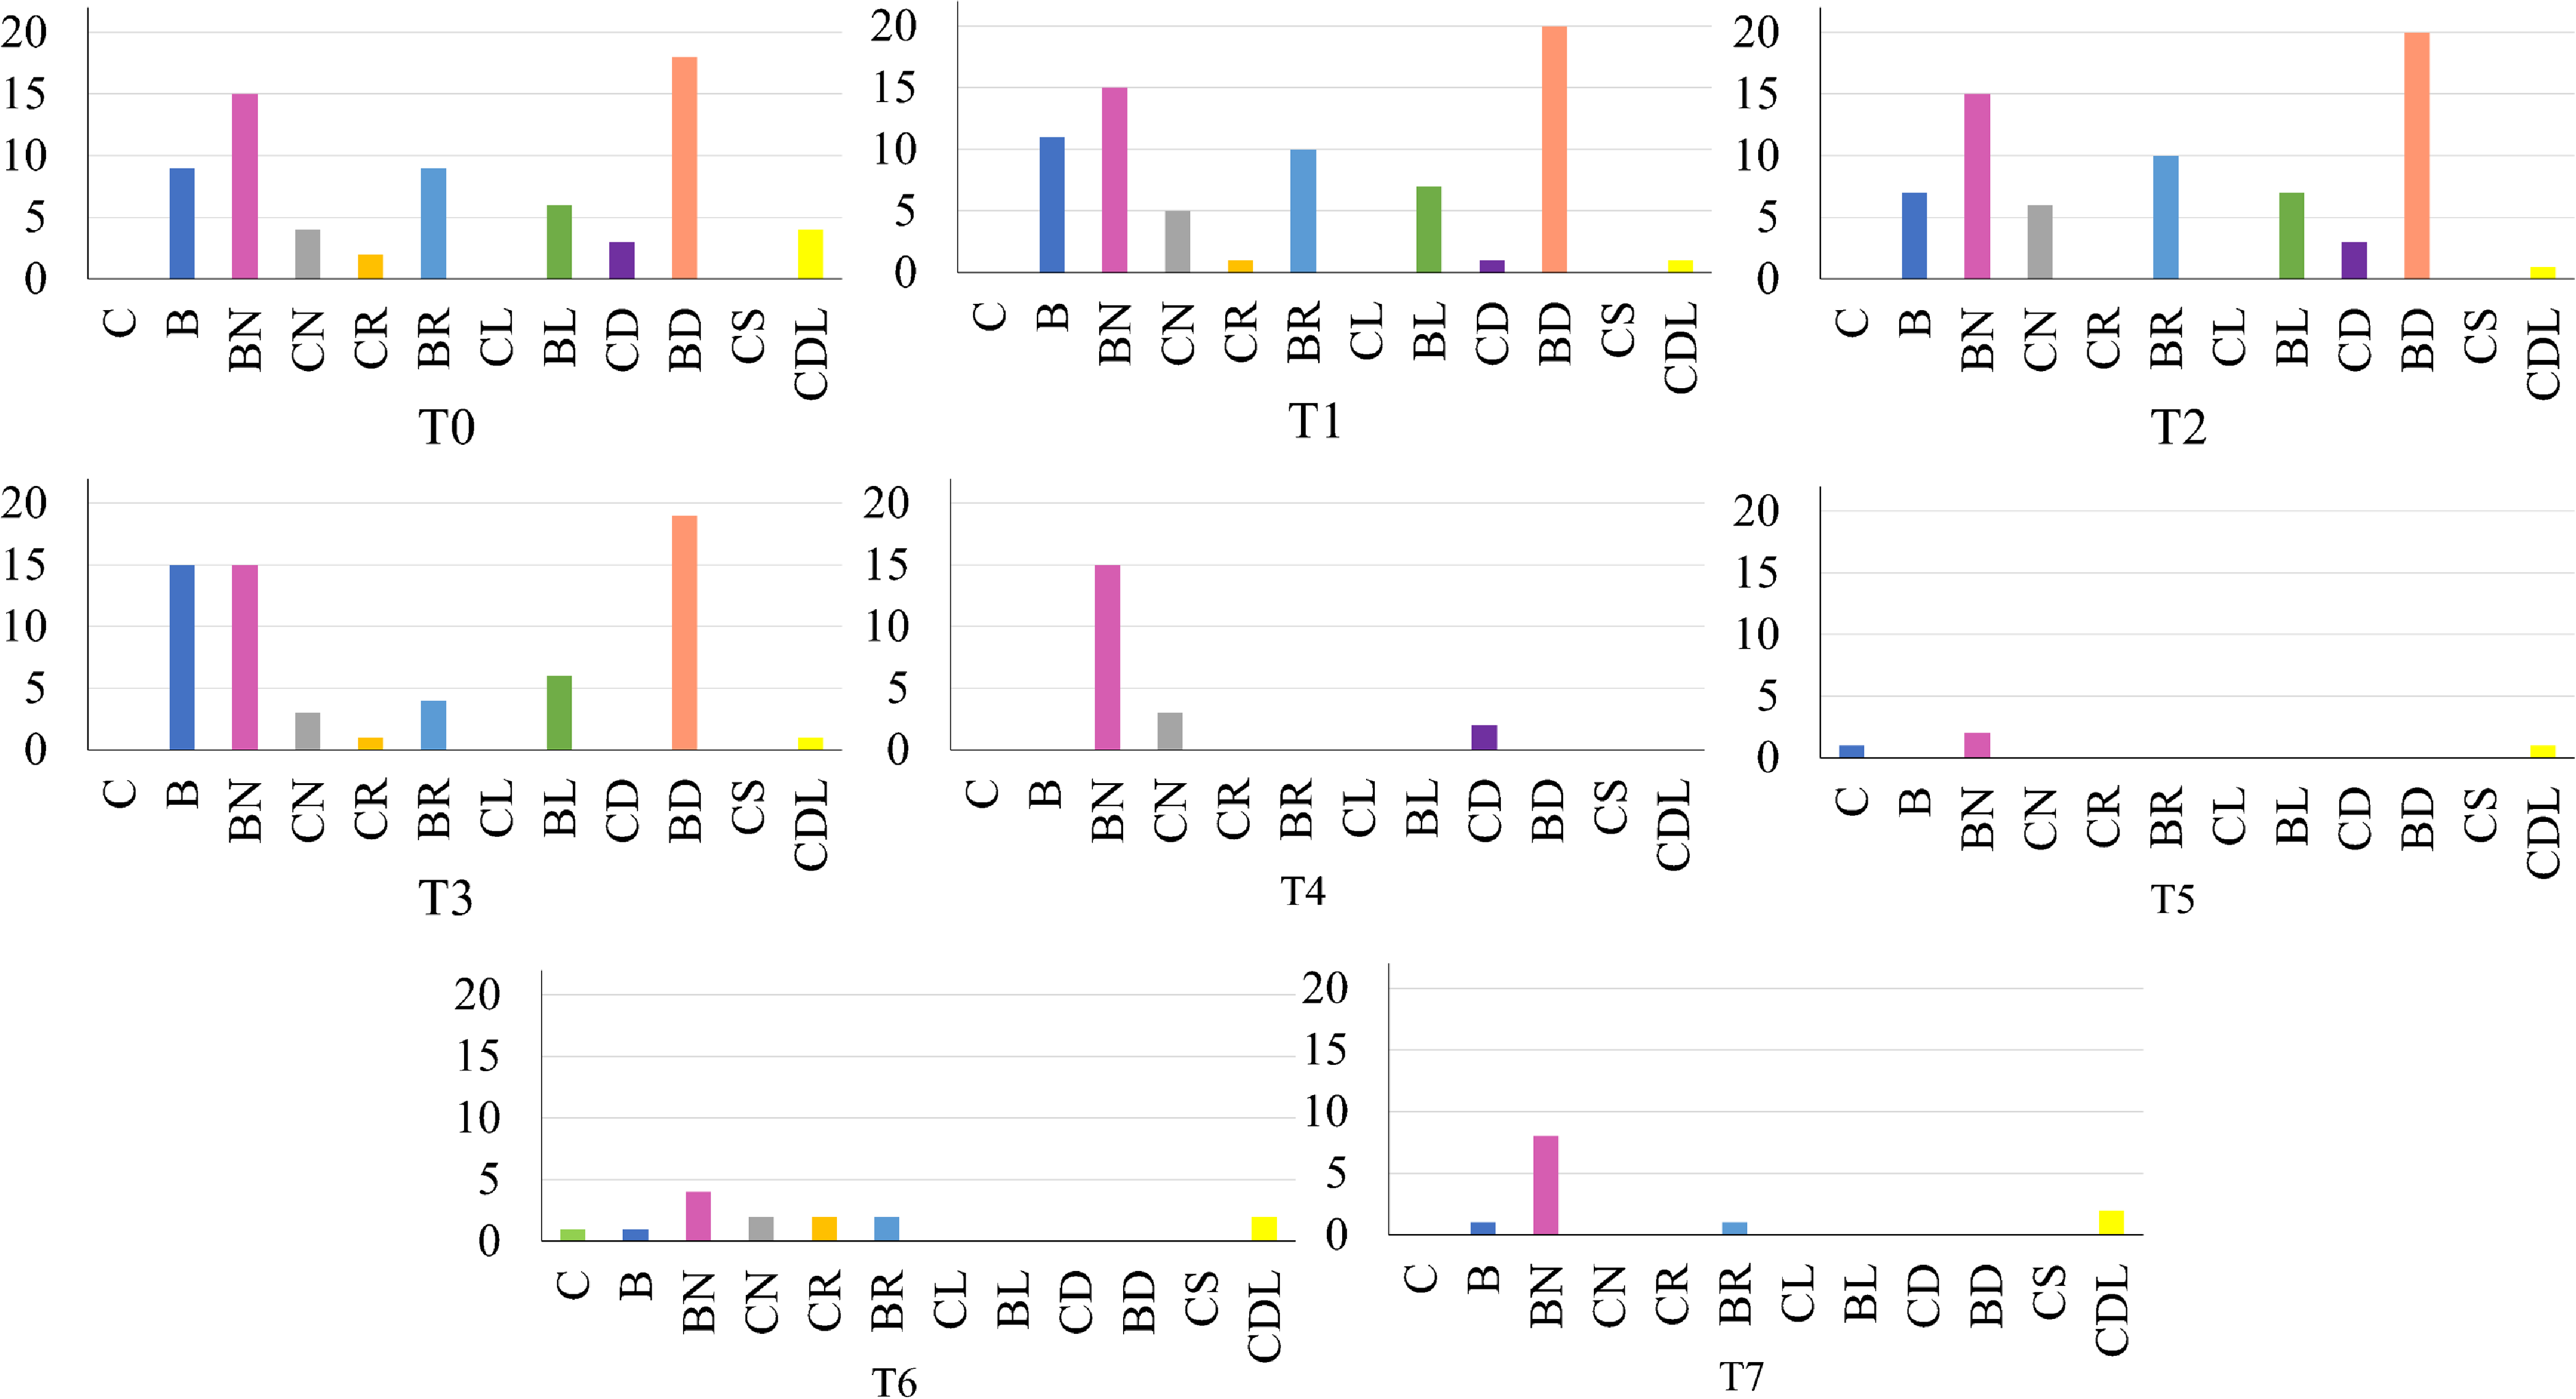
To further analyze the detection results, we present the number and type of failed detection (including both false positives and false negatives) images in Figure 8. For clear images ("C," “CN," “CR," “CL," “CD," “CS,” and “CDL"), all models trained from T0 to T7 achieved well performance, suggesting that DR was generally effective under clear imaging conditions. The most challenging image types were those involving blur, noise, and distractor objects – specifically, the types “BN,” “BD,” “BL,” “B,” and “BR,” which represent the primary challenges for automated charging port recognition in real-world scenarios. Models trained with T0 to T3 struggled to detect blurry images, showing high failure rates. In contrast, T4 to T7 included blur images in the training data, which improved detection performance under these conditions. Notably, the model trained on the T5 dataset generated with the proposed TOPP achieved the best results.
-
c. Comparison results of generation speed:
Furthermore, the generation speed was analyzed in the experiment. As shown in Figure 7(b), T0 only randomly varies the scene-related objects, requiring the least time for data generation, approximately 0.9 frame/s. With an increase in distractors, the number of objects that require texture changes also increases, resulting in a more significant burden on software rendering, thus significantly increasing the time. In T1, the image generation speed is about 1.5 frame/s. In the post-processing stage, adding Gaussian noise and blur processing takes about 0.5 and 0.02 s per image, respectively. T5 combines scene-related, port-related, and sensor-related objects and has a generation speed of approximately 1.18 frame/s but achieves the best performance. T6 did not randomize the port-related objects, resulting in an increase in generation speed but an inferior transfer effect compared to T5. Finally, T7 included distractors in all images, reducing the speed of data generation and resulting in an inferior transfer effect compared to T5 and T6.
-
d. Visualization and explanation:
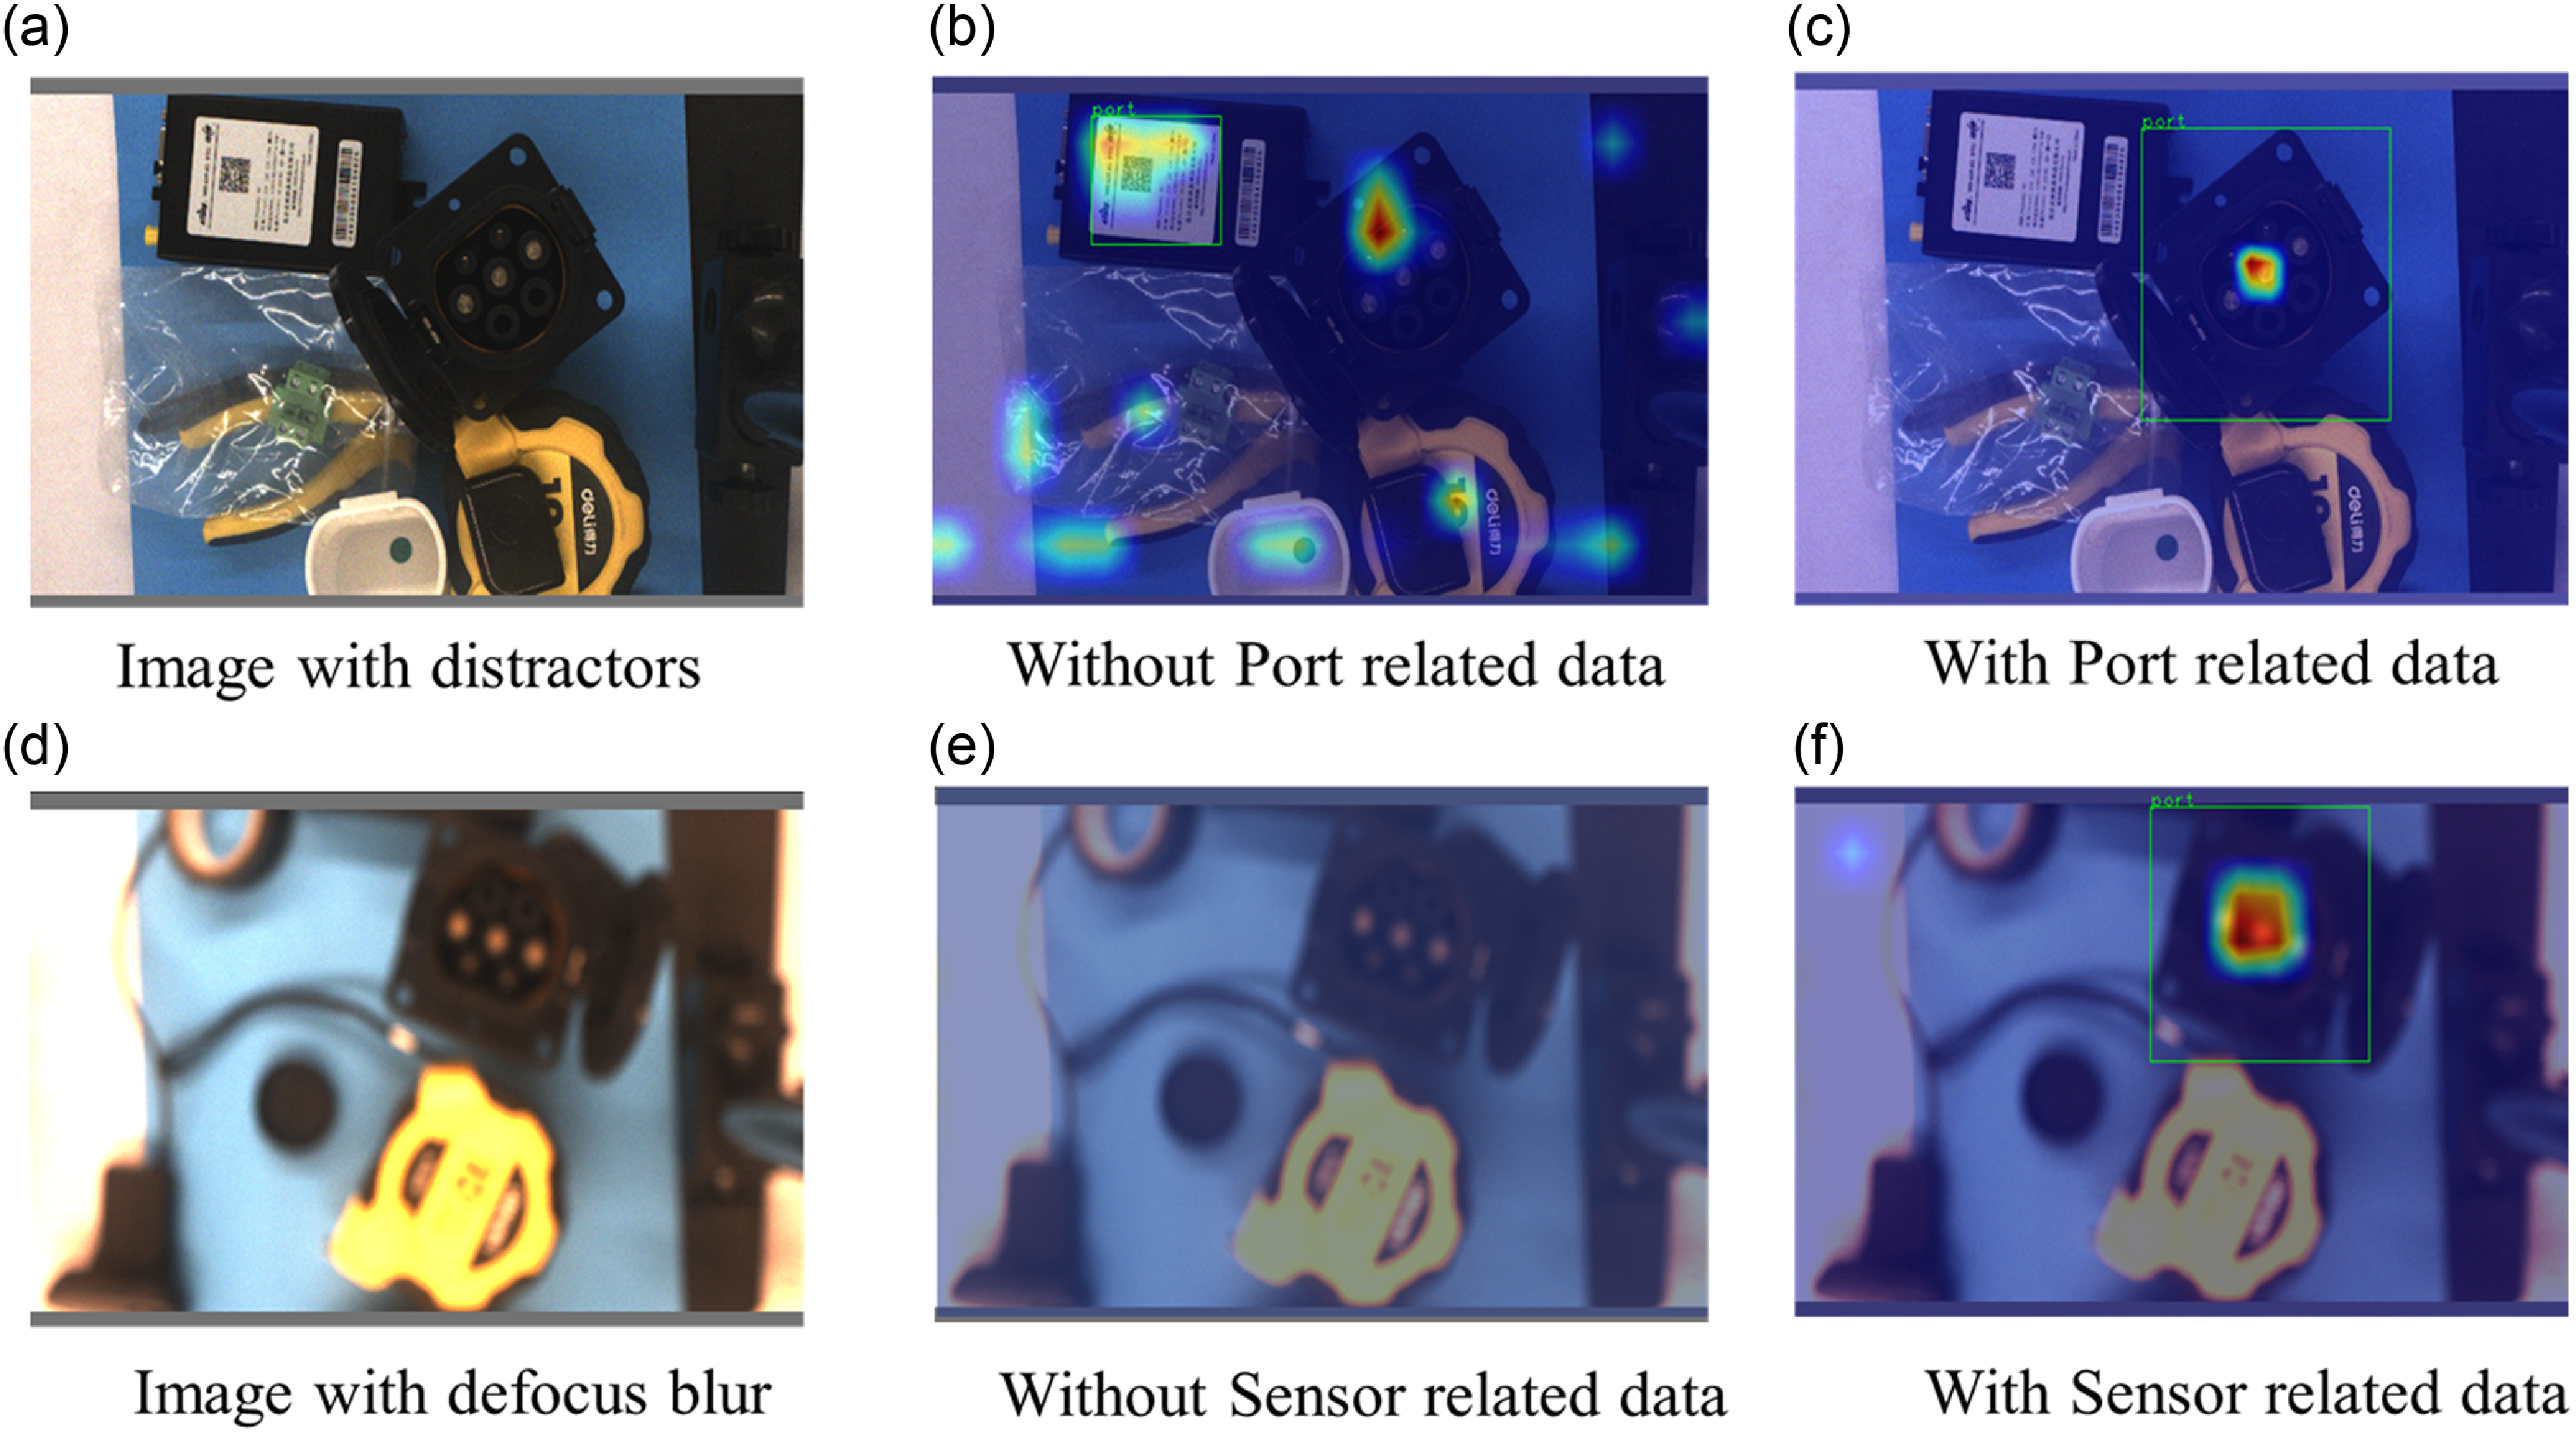
Grad-CAM [Reference Selvaraju, Cogswell, Das, Vedantam, Parikh and Batra34] was used to explain how the training dataset affects the object detector visually. As shown in Figure 9, two images with obvious distractors were selected to show the results. In Figure 9(a), distractors were placed around the charging port, object detector trained with T0 mistaken the square label for a charging port (Figure 9(b)). In Figure 9(d), the camera was not at its best working distance which caused the defocus blur, and the detector trained with T3 was unable to find the port (Figure 9(e)). In both images, detector trained with T5 can focus their attention on the port and find the charging port successfully (Figure 9(c), (f)).
The above experiment demonstrated that more complex scenes are not necessarily better when using DR technology for randomization. On the one hand, the generation of complex scenes requires rendering a large number of textures, which would increase the time required for data generation. On the other hand, textures cannot provide the imaging features of the camera, which also makes DCNN unable to adapt to blurred and noisy images. By mixing different types of synthetic images, TOPP can improve the performance of the DCNN detector. Besides, generating sensor-related images through post-processing reduces the average generation time of images.
Results of DCNN object detector trained on synthetic dataset. The boldfaced values represent the results of the proposed method.

Number of failed detections for each type of images in test dataset. Including both false positives and false negatives.

Visual explanations of the detected result. (a) and (d) are images from the testing dataset. (b), (c), (e), (f) are the detected results with heat map.

4.1.3. Comparative study
In the comparative analysis, we evaluated the performance of our proposed synthetic image generation method against other approaches. To demonstrate the effectiveness of our method, two baseline approaches were compared:
-
• Baseline1: The cut-paste method was employed to generate charging port images. According to the method described in refs. [Reference Chen, Wan, Matsushita, Kotaka and Harada17, Reference Dirr, Bauer, Gebauer and Daub18], the charging port area was cut and pasted to the iSAID dataset [Reference Waqas Zamir, Arora, Gupta, Khan, Sun, Shahbaz Khan, Zhu, Shao, Xia and Bai35] with random position and angle, and then Gaussian blur and noise were added.
-
• Baseline2: Adopting the idea in ref. [Reference Bang, Lee and Kang15], a new dataset was generated based on the baseline1 by adjusting the contrast, saturation, and brightness and augmenting the images.
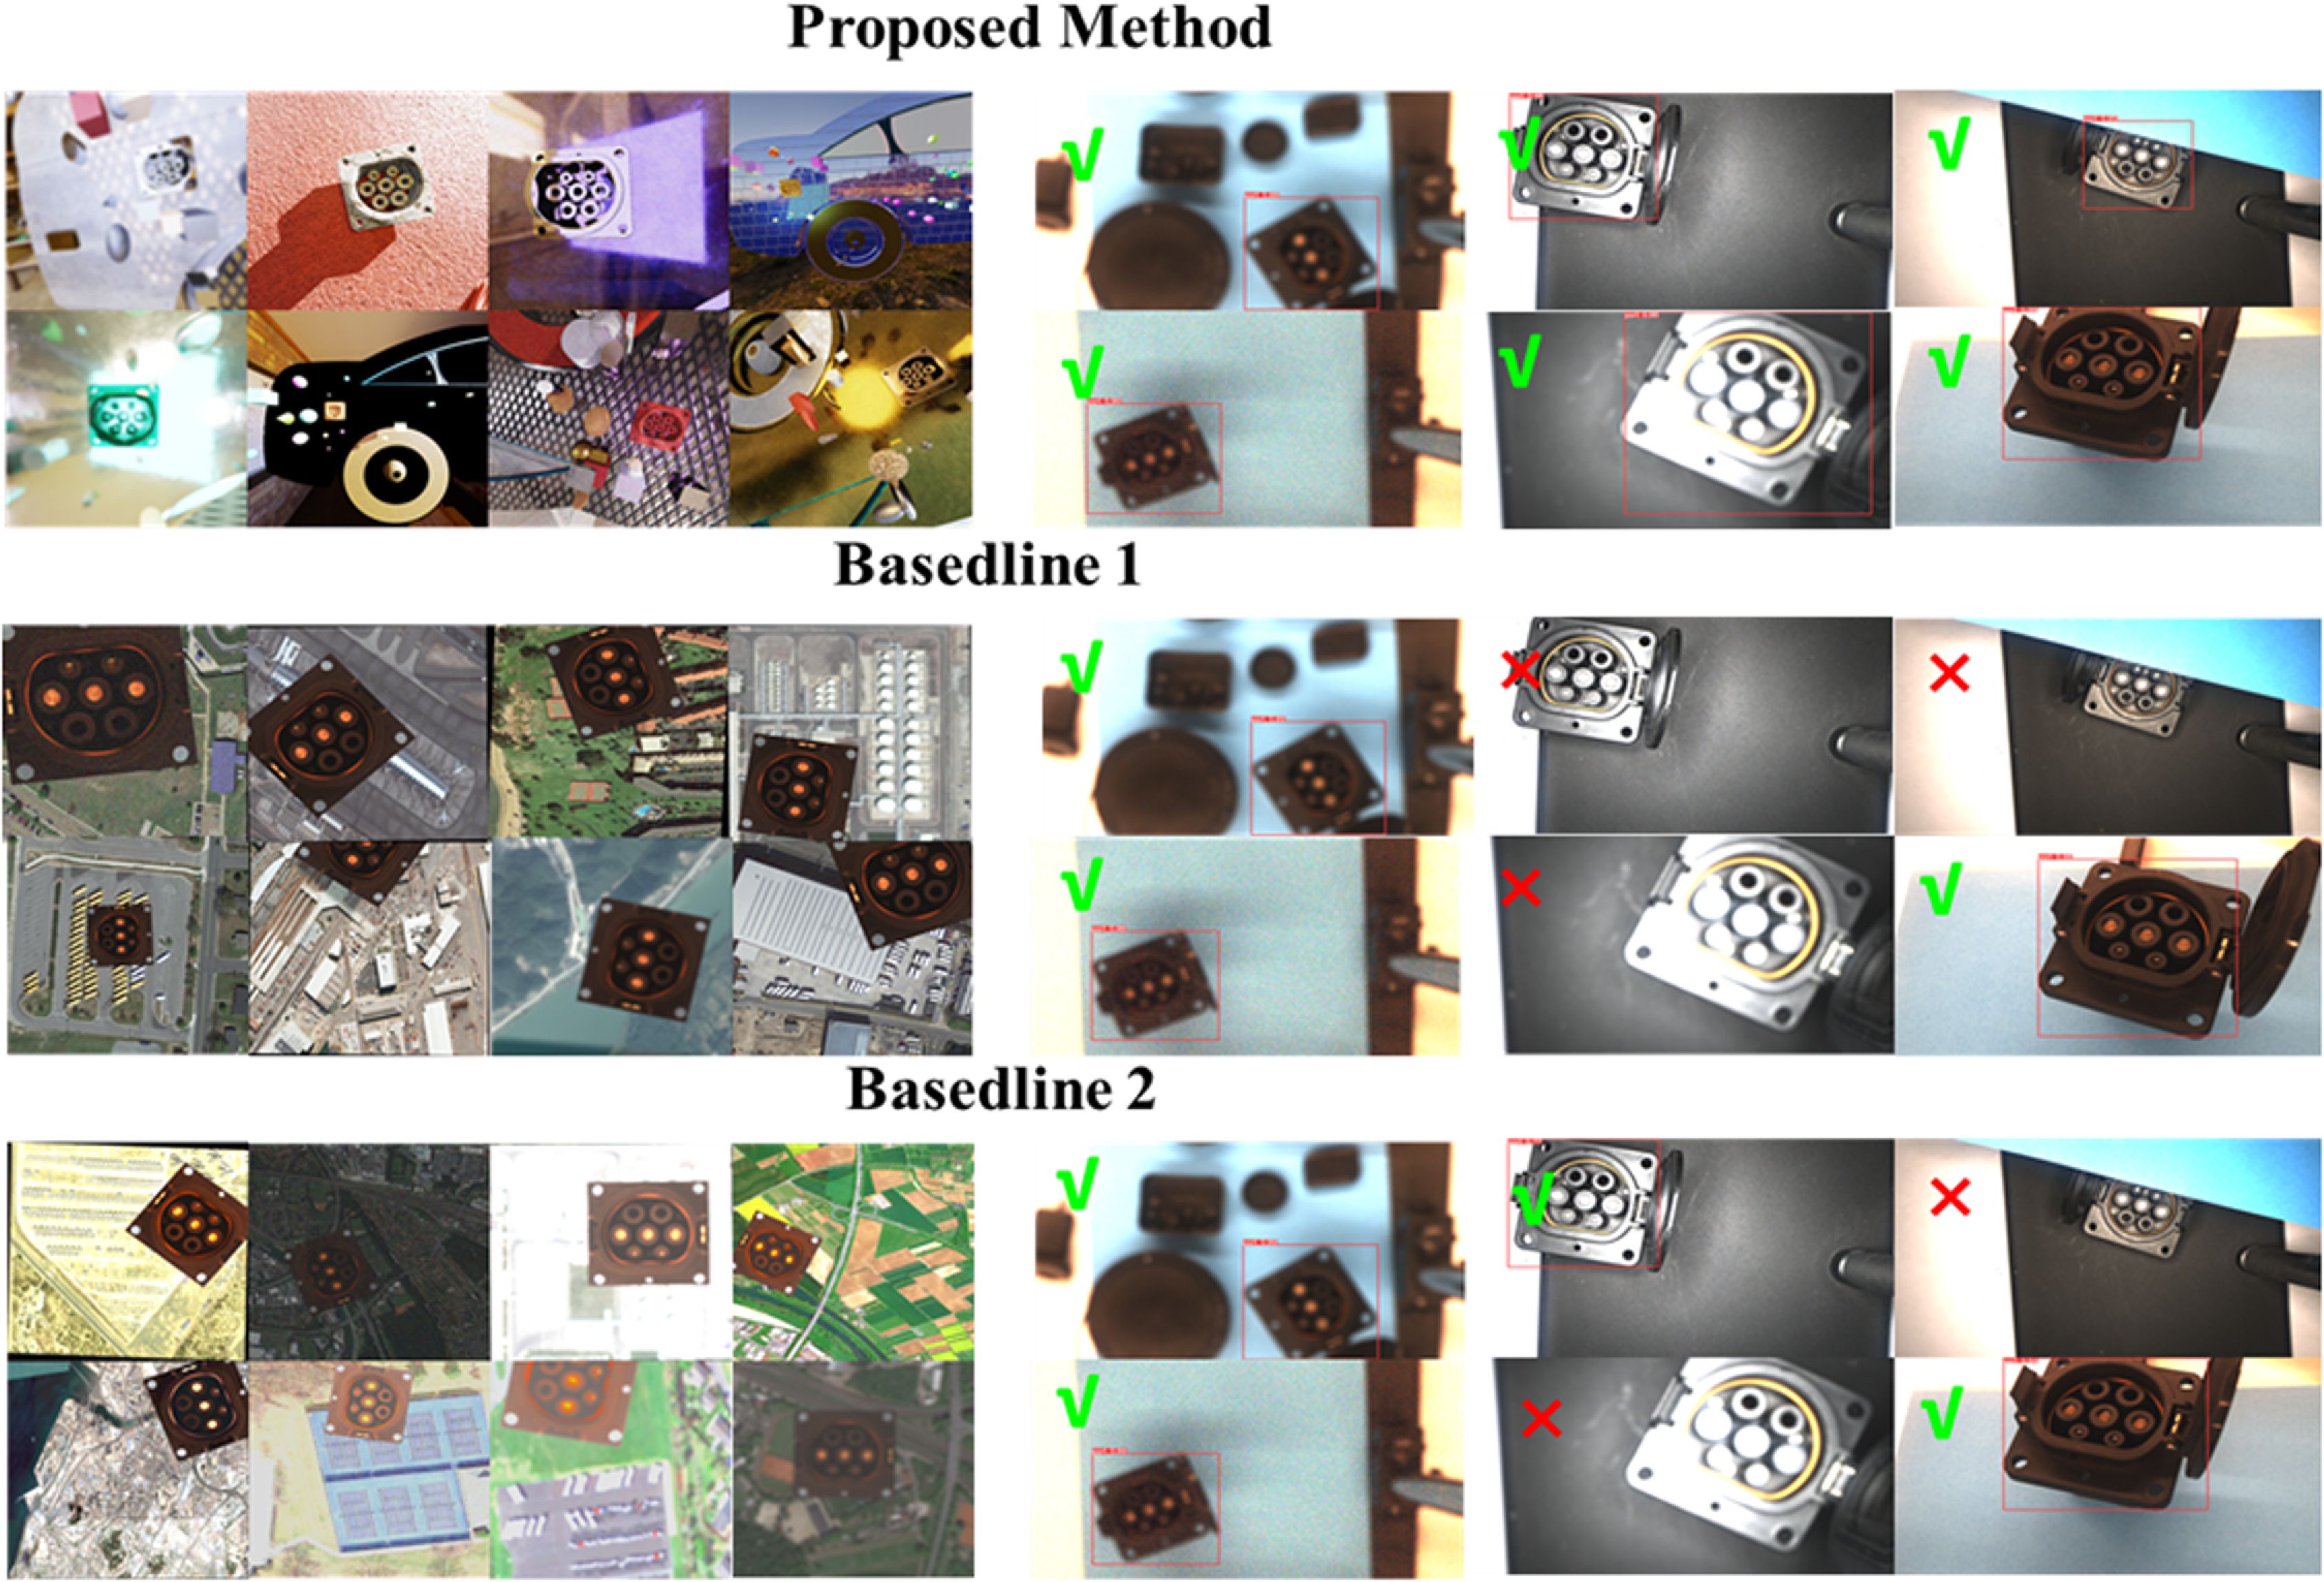
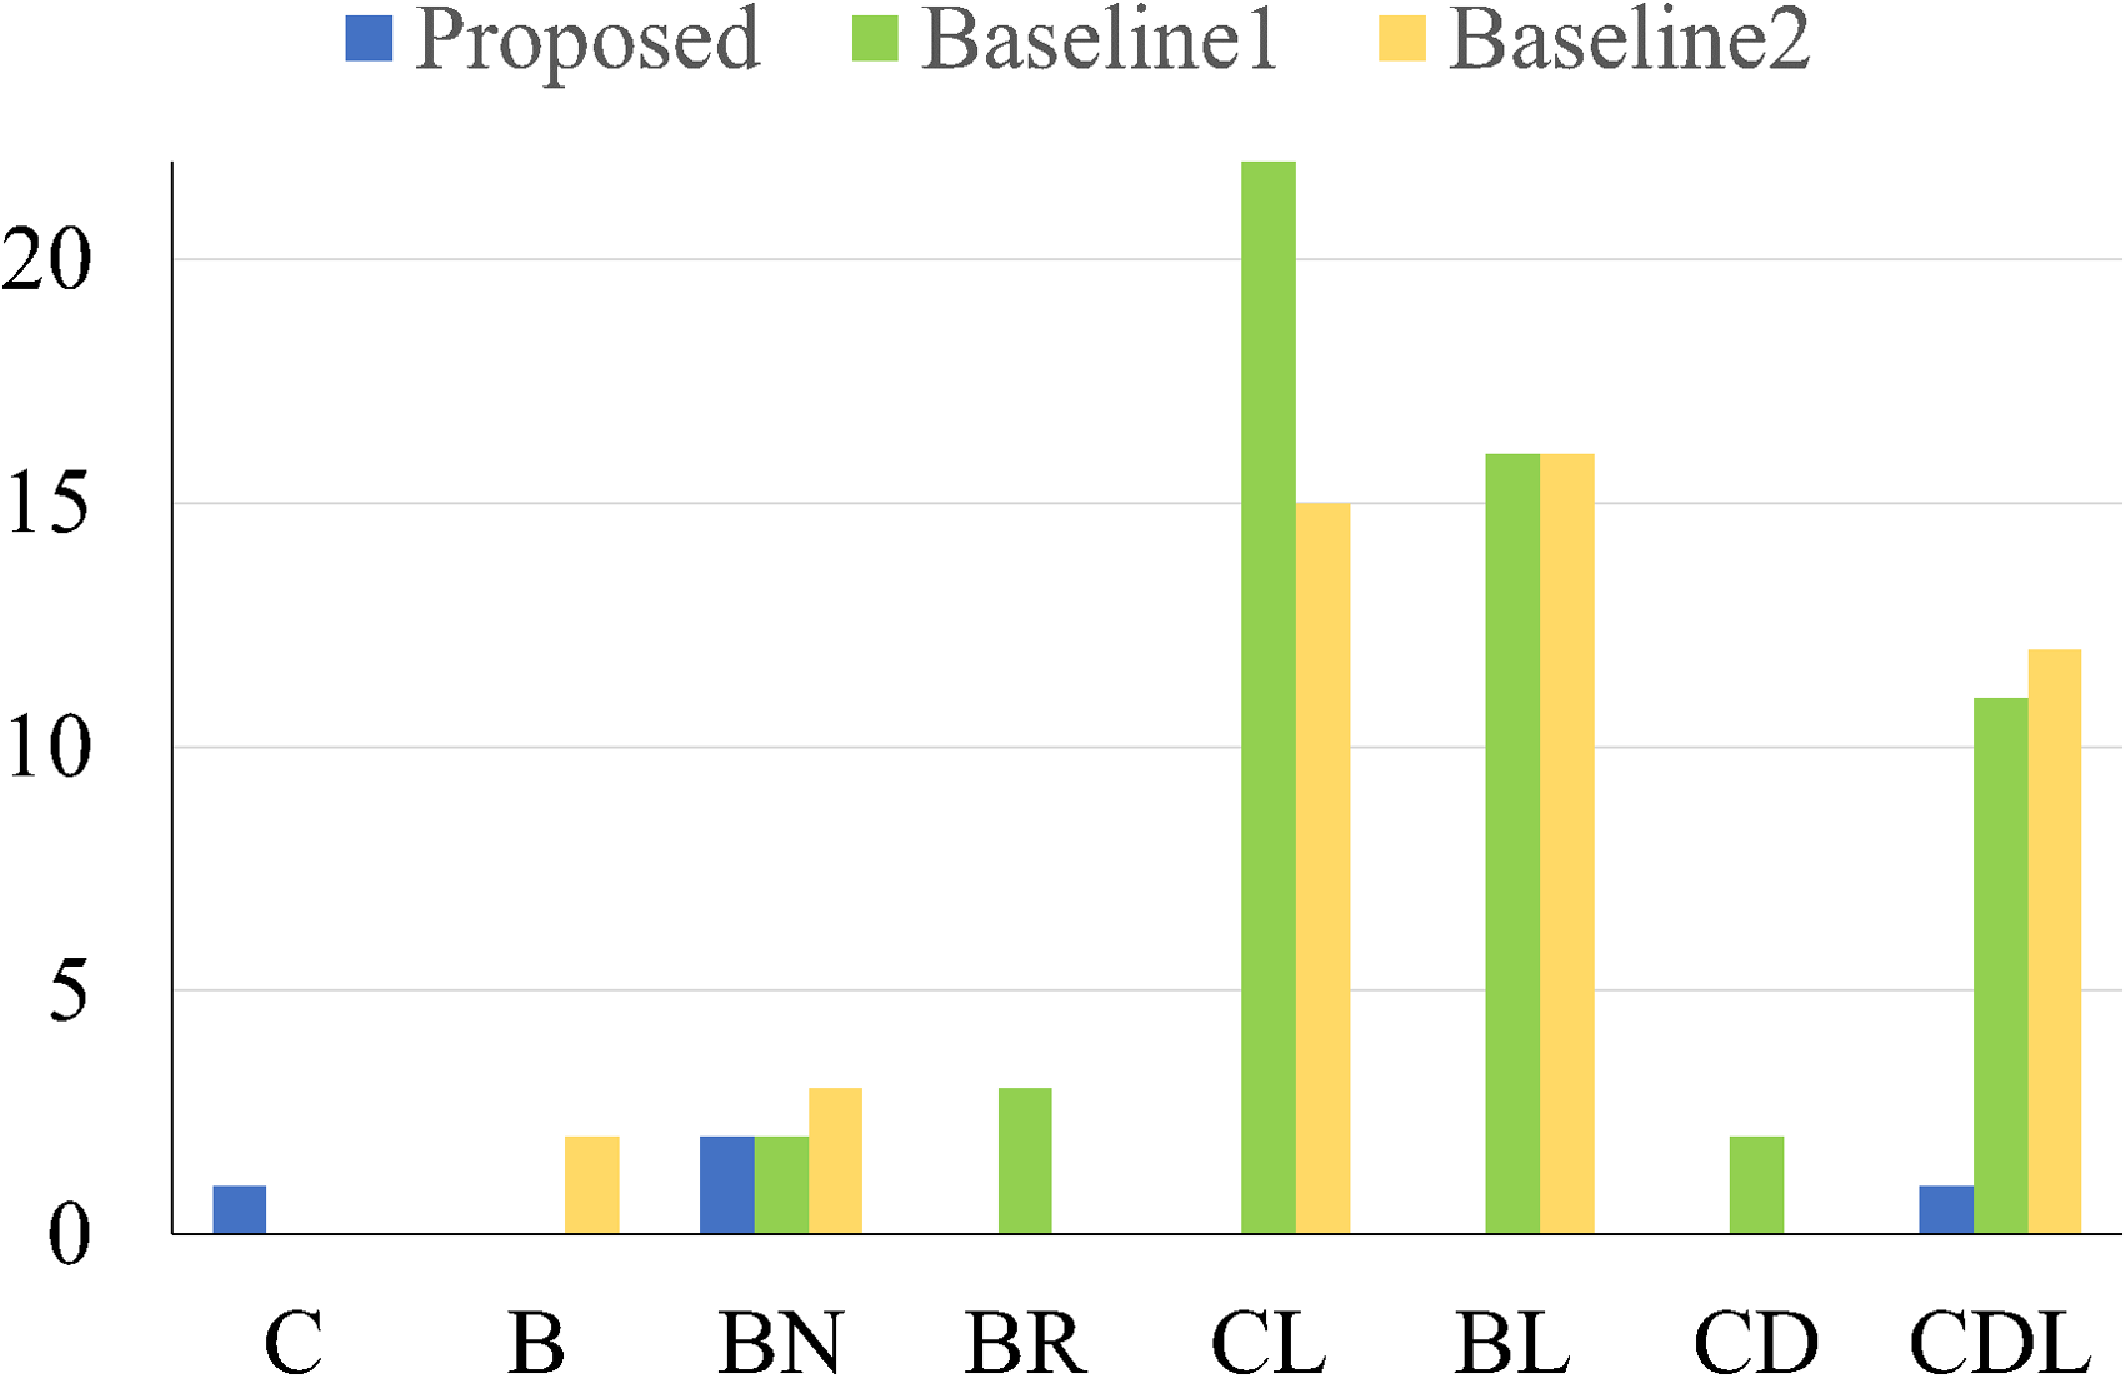
The left part of Figure 10 shows the synthetic images generated by different methods. The right part of Figure 10 and Figure 11 show the detected result. The results show that both the compared methods struggled to adapt to variations in lighting conditions. Although Baseline2 adjusts the image brightness, it still fails to simulate the reflections on the port accurately caused by light source illumination. This issue deserves attention in practical applications, as high-intensity light sources are often required to ensure the stability and accuracy of recognition. In fact, both the comparison methods were a form of data augmentation applied to the original collected images, and the final detection performance largely depends on the quantity and type of the real-world collected images. It is challenging to collect images under different lighting conditions, as surface reflections can be influenced by factors such as the light source’s size, intensity, color, and angle.
Synthetic images with difference method (left side). Exemplary port detect results (right side).

Distribution of failed detection images.

In contrast, the proposed method does not require the acquisition of real images, as all images are synthetically generated in simulation. Although there were differences from real-world conditions, randomized parameter settings allowed the detector to generalize to unseen scenarios in the real world.
4.2. Port search in the real world
In this section, the real-world port search experiments were conducted. In Section 4.2.1, the experimental setup was introduced, including the hardware and software configurations of the platform. In Section 4.2.2, the port search procedure was performed and the results were reported in terms of success rate and average search time. In Section 4.2.3, the search performance under lighting noise interference was evaluated to examine the robustness and efficiency of the proposed method. In Section 4.2.4, an insertion experiment was conducted to validate the system.
4.2.1. Experiment setup
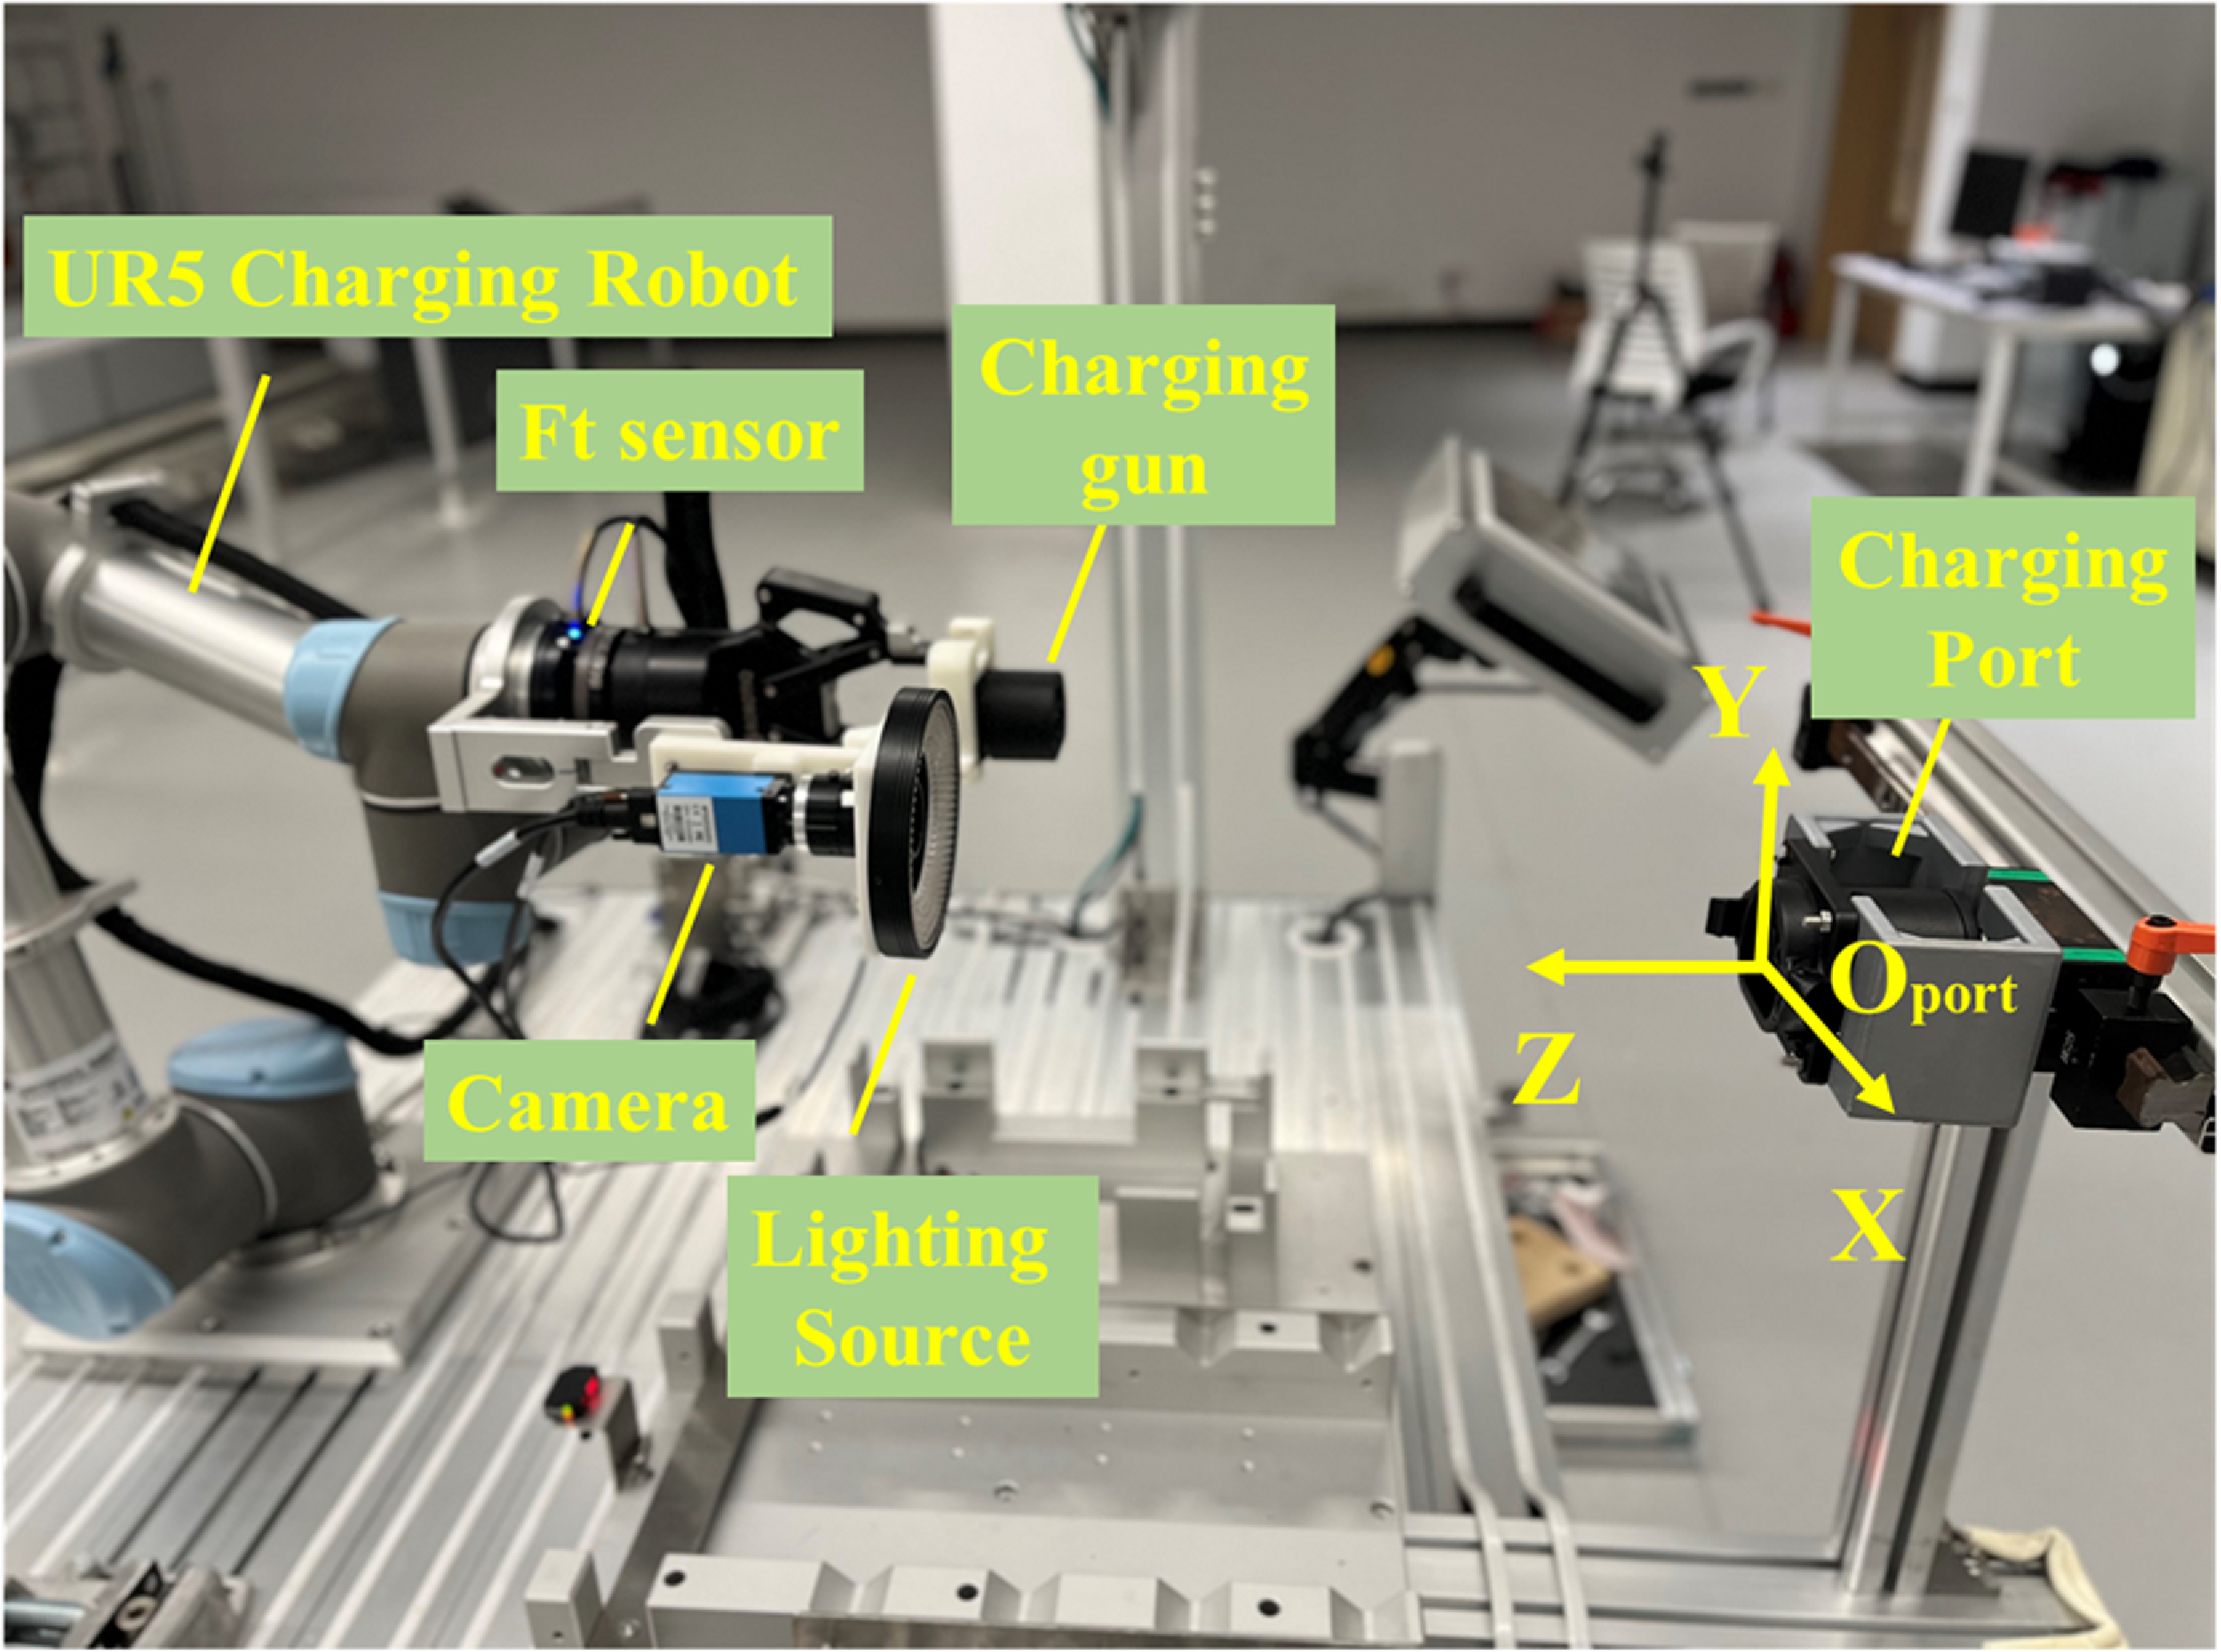
A charging platform for visual servoing search verification was built, as shown in Figure 12. A mono camera with a small DOF (depth of field) and light source was mounted on the end effect of a UR5 robot, and a charging port was fixed on the bracket. The control system was run on the laptop with i7 CPU and RTX 1060 GPU. Real-Time Data Exchange Interference was used to control the robot at a frequency of 125 Hz, and the sampling frequency of the camera was 30 Hz.
Automatic charging robot testing in the laboratory.

4.2.2. Port search experiment
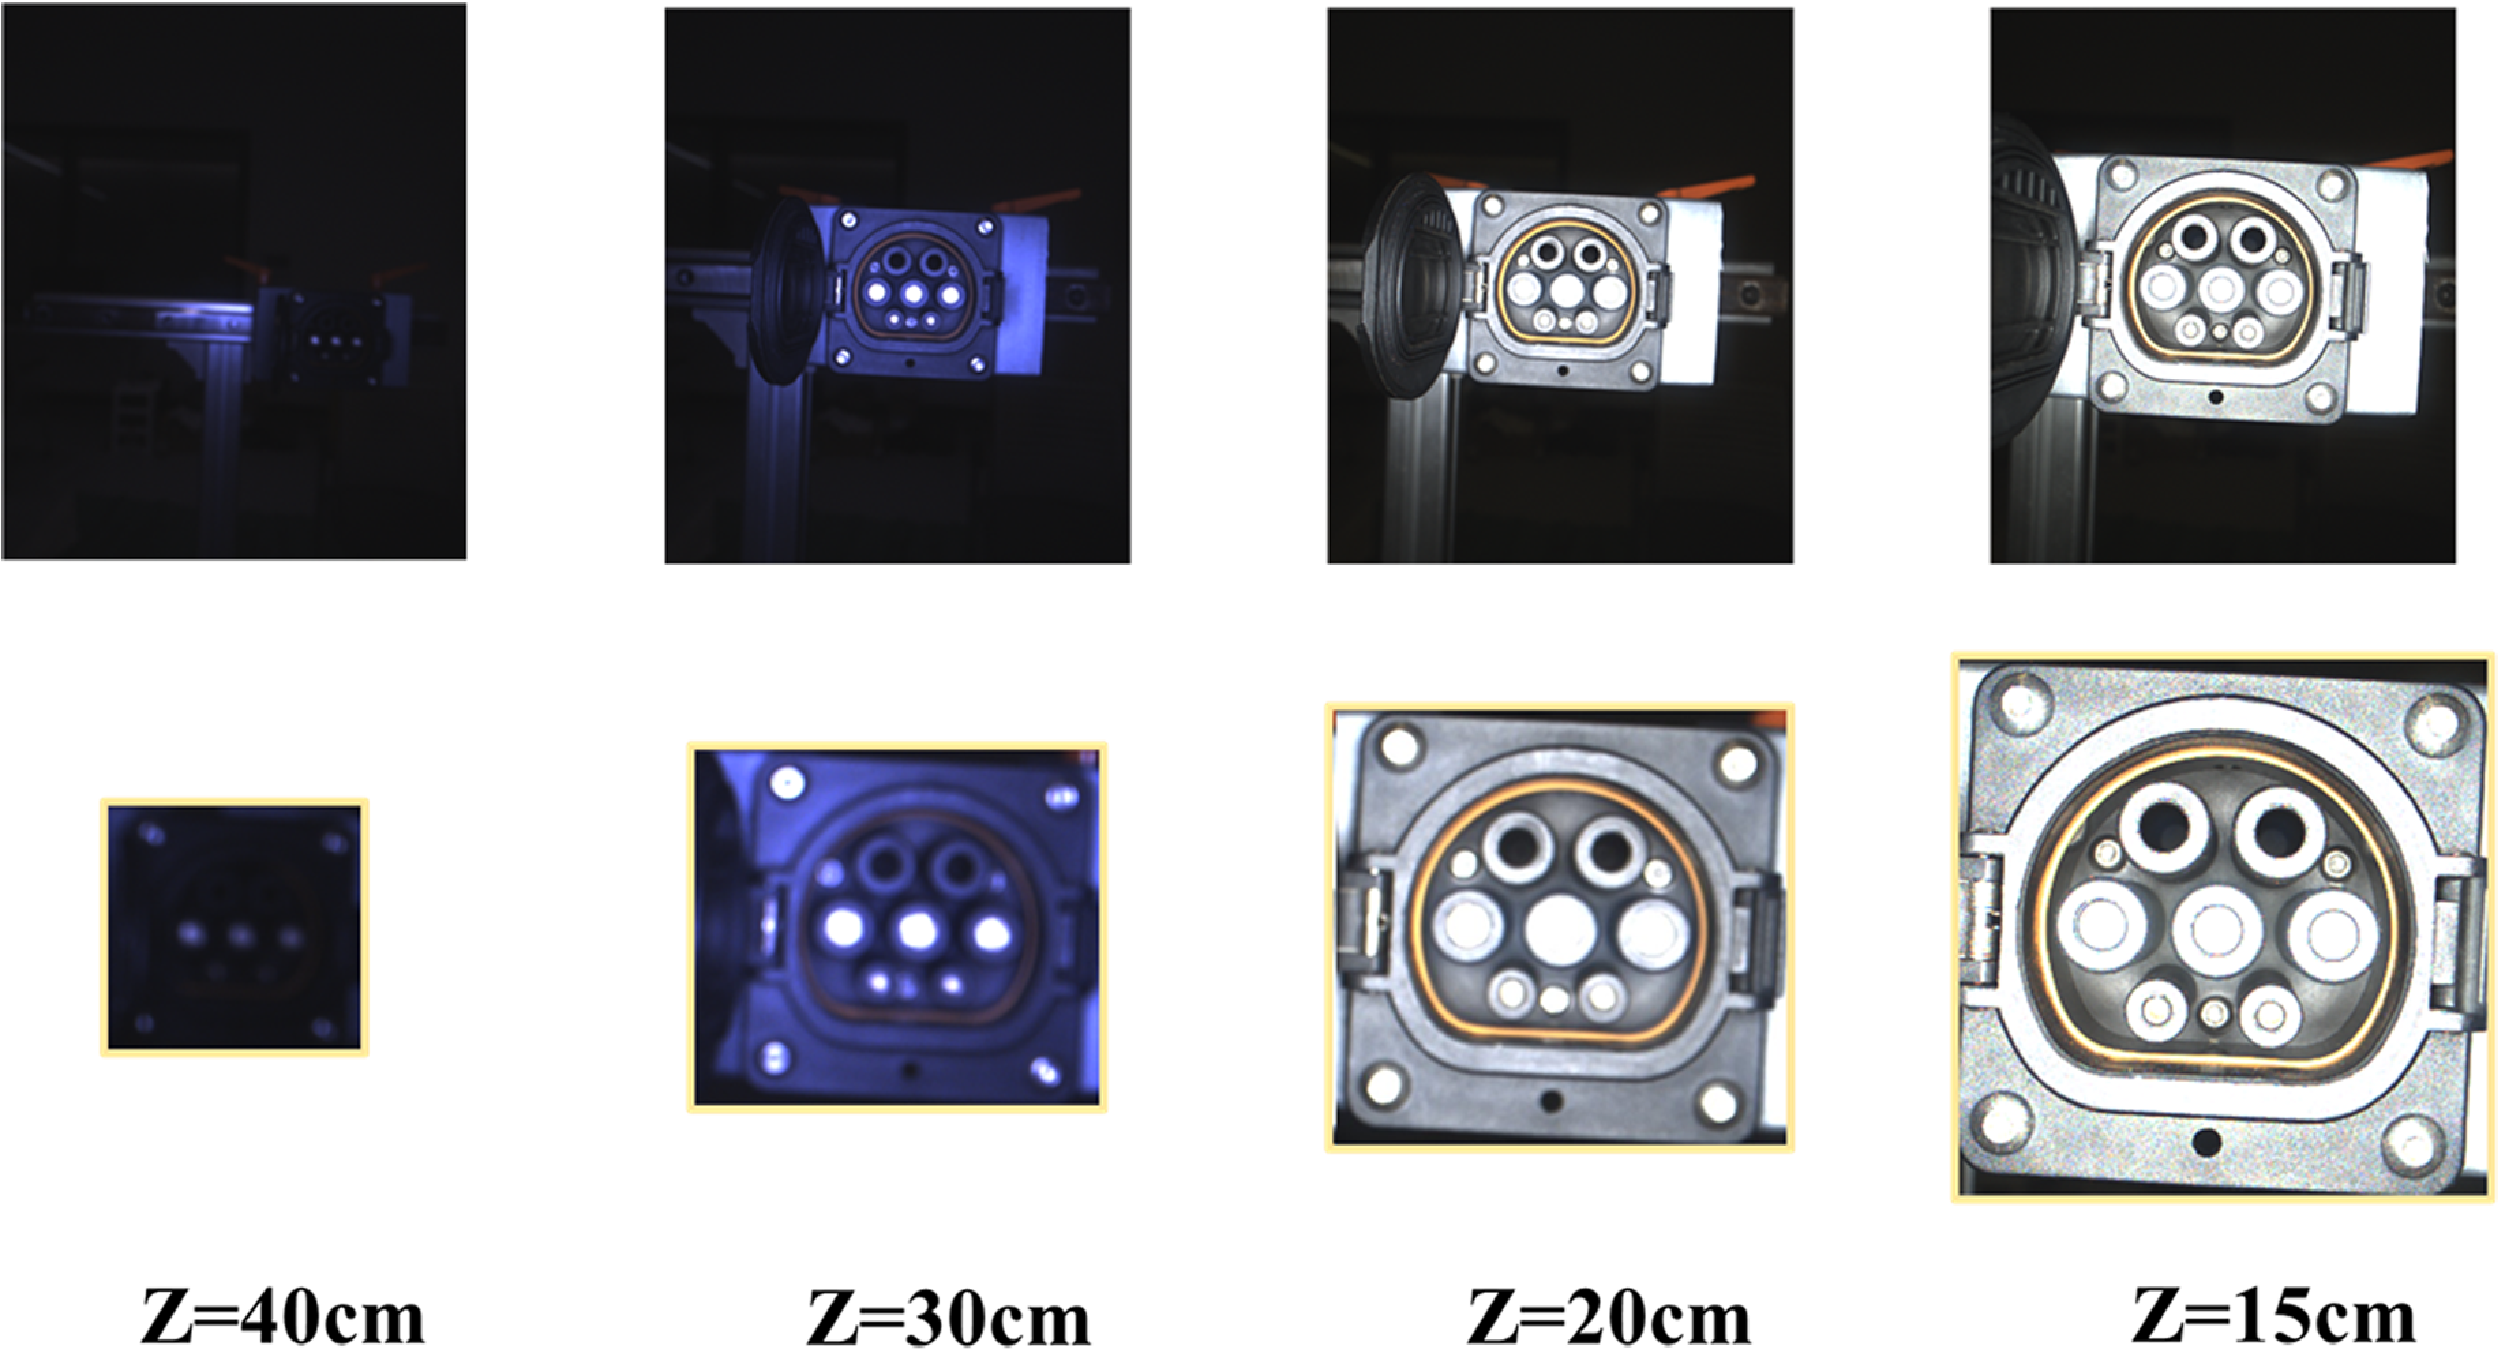
A series of experiments were conducted to verify whether the proposed method can effectively guide the robot to move to the target position. The camera’s initial position is set on the plane 50 cm away from the charging port, with 30 positions randomly selected on the plane for testing (The initial point must be able to see the charging port). The range of values for x and y is set to ±3 cm and ±20 cm from the origin of the charging port. The camera can obtain a clear imaging working distance between 13 and 15 cm. Within this range, the calibration information of each pixel is about 0.12 mm/pix, which meets the assembly clearance of the charging port and the precision positioning requirements. Therefore, when the robot stops servo motion, and the camera stays within this range, it is considered that the coarse positioning search is successful.
Table III shows the success rate, average time, average stop distance in the Z direction (Average S-disZ) and average errors in the X and Y directions (Average ERR-XY) under different search ranges. The experiment results show that the proposed method can achieve a success rate of 100% and finish servoing in the average time of about 16s. The average position of the camera when it stops moving is around 14 cm, which falls within the working distance range for clear imaging. As shown in Figure 13, the robot can finally stop at a certain position and capture the clear charging port image. Besides, most research only studies the localization algorithm in the clear position (e.g., in this case, Z = 14 cm), but the proposed method focuses on the stage before moving to the clear position, and few works can be found to make a comparison. In addition, the average ERR-XY were approximately 1.4 mm, which was caused by the bounding box and servoing errors. To further reduce the final ERR-XY, adjustments must be made in conjunction with the actual physical pixel dimensions at the on-focus plane. This was discussed in Section 4.2.4.
Results of search experiments.

Images and detected ROI in difference distance. The robot moves from a blurred imaging position to a clear imaging position.

4.2.3. Port search with lighting noise
In addition, the search efficiency under lighting noise interference was verified. When the distance between the camera and the charging port is greater than 25 cm, set the light source intensity to 50% and control the light source to flash at a frequency of 12.5 Hz. When the distance is less than 25 cm, it is considered that the light source intensity is sufficient to cover the external light image. At this point, stop flashing and adjust the light source intensity to its maximum. The reason for simulating this type of noise is that industrial environments often have multiple workstations, and there may be some light source interference between different workstations.
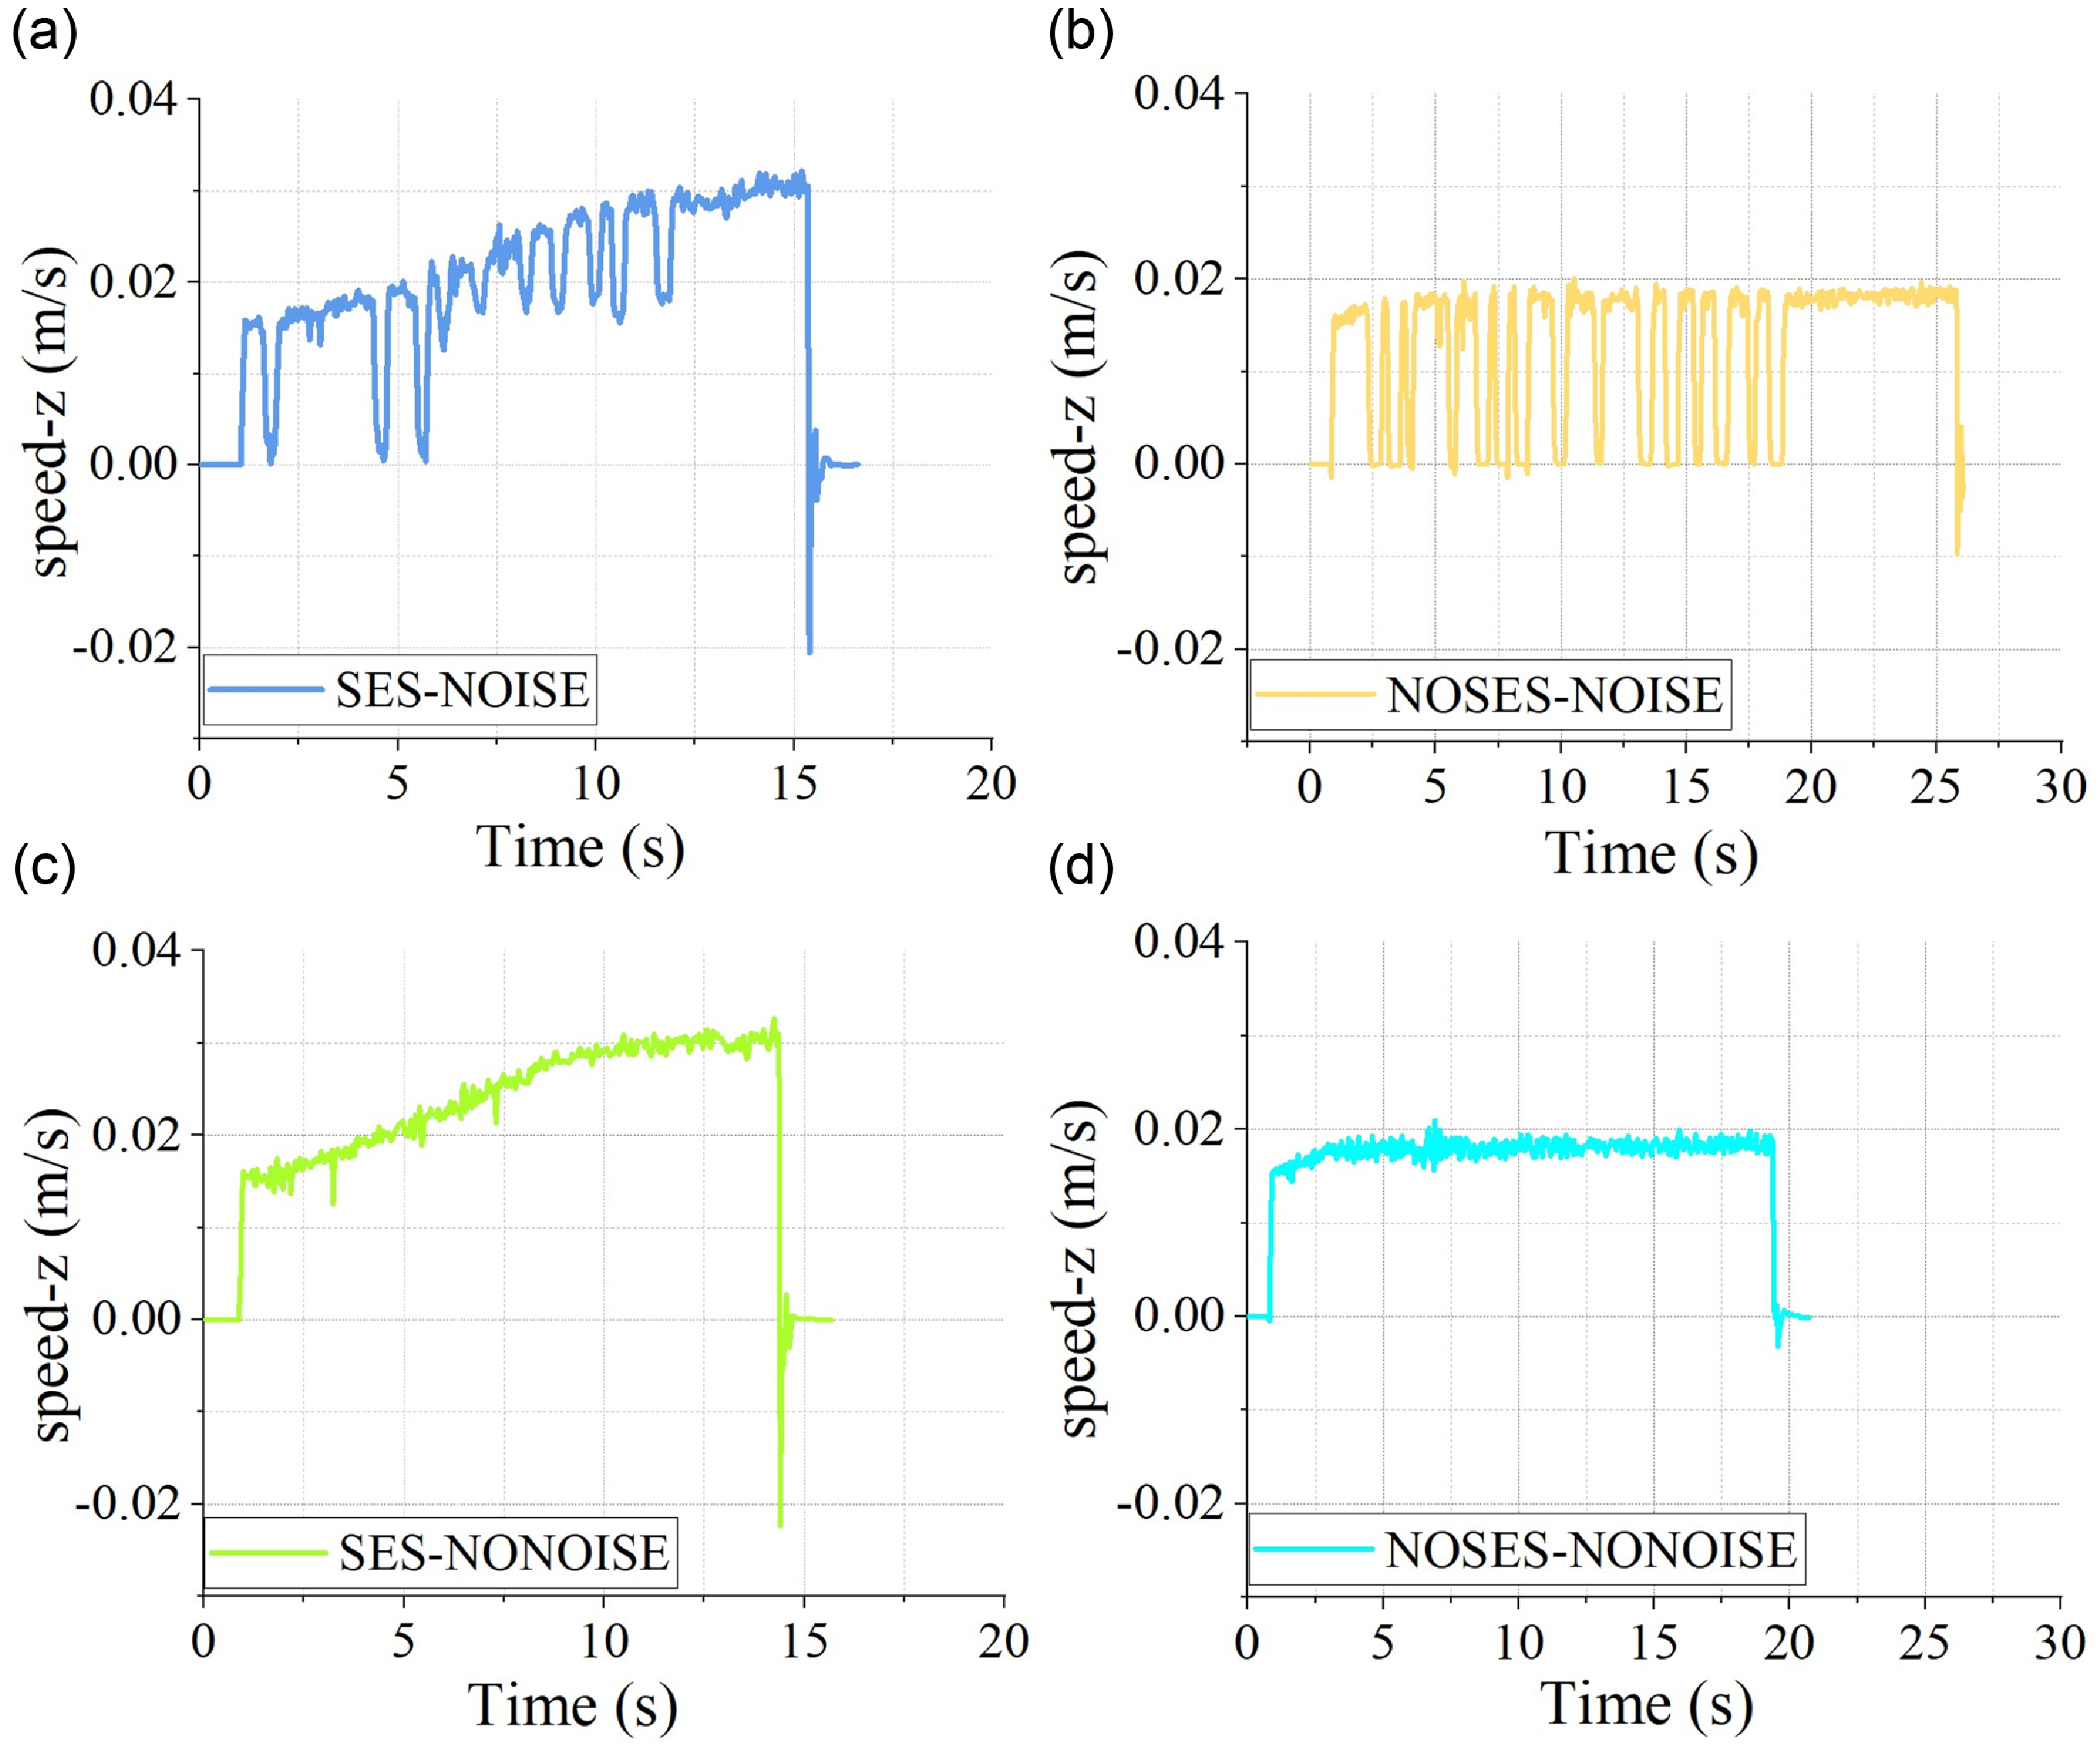
As shown in Figure 14, the motion speed along the Z direction was recorded. It can be seen that the robot stops servoing as soon as it meets the threshold, while the method with SES is not significantly affected by noise interference, and the servo motion time is close to the situation without noise interference. On the other hand, the method without SES is heavily affected by noisy images. When the target detector fails to detect, the speed will directly decrease to 0, resulting in discontinuous motion and an increase in overall time.
Result of visual servoing motion in real world. (a) servoing with SES and lighting noise. (b) Servoing without SES and with lighting noise. (c) Servoing with SES and without lighting noise. (d) Servoing without SES and lighting noise.

4.2.4. Plug-in experiment
Finally, an insertion experiment was conducted to validate the auto-charging system. After the visual servo system stopped, there remained a certain error between the charging port center and the image center due to the bounding box output error from the object detection algorithm. To address this, we again performed image localization on the charging port and calculated the actual offset based on the localization result and the calibrated coefficient k (0.12 mm/pixel). Then, moved the robotic arm in X and Y directions to bring the charging port closer to the image center, and repeated the above steps five times to ensure the charging port was accurately centered in the image. By utilizing the calibrated offset between the camera and the charging gun, it was able to control the robot to align the charging gun with the charging port. In the 30 insertion experiments, the average localization error in the X and Y directions was 0.76 mm. Combined with the compliant force control, the final insertion success rate was 100%.
5. Conclusion
This paper presents a 2-stage vision-based localization solution for EVs charging ports in uncertain environments. The proposed approach incorporates TOPP for synthetic image generation to train the robust DCNN model. Meanwhile, an autofocus and dynamic servo control mechanism is designed to operate effectively in uncertain environments.
The proposed TOPP formulates DR parameters based on the characteristics of the task, considering the scene, shape features of the EV port, and the imaging characteristics of the sensors. Unlike complete random generation, this approach reduces the range for randomization, leading to more targeted synthetic images and enhanced generation efficiency. Meanwhile, the dynamic servo control mechanism accounts for blurred imaging and noise interference caused by uncertainties in real-world scenarios. A hybrid detector trained with synthetic images can provide port ROI in complex environments to evaluate sharpness. Enabling sharpness assessment can be achieved through threshold comparison without being affected by background interference. In visual servoing, by using SES to fuse the speeds of k time steps, a certain speed can still be maintained when missed detection is caused by noise, maintaining the smoothness of motion. The result shows that the robot can complete localization, move to the target location with the proposed framework in a noisy environment, and successfully execute the charging gun insertion tasks.
In future work, we will explore using different image synthesis techniques to improve the system’s stability and accuracy further. Moreover, the system’s application will provide solutions for autonomous assembly.
Author contributions
Material preparation, data collection, and writing were performed by Qi Chen. Conception and design, writing, and review were performed by Kai Wu. Review and editing were performed by Mingfeng Wang, Yong Zhong and Weihua Li. All authors commented on previous versions of the manuscript. All authors read and approved the final manuscript.
Financial support
Funding Research supported by the State Key Laboratory of Digital Manufacturing Equipment and Technology, Grant No. DMETKF2021018. GJYC program of GuangZhou, Grant ID. 2024D03J0005. Chunhui Project Foundation of the Education Department of China, Grant No. 202201789.
Competing interests
The authors declare no competing interests. The authors have no relevant financial or non-financial interests to disclose.
Data availability statement
The data that support the findings of this study are available from the corresponding author upon reasonable request.
Ethical approval
Not applicable.