

I. INTRODUCTION
Currently, the increasing demand for transportation of oil and natural gas over long distances calls for high performance pipeline steels which feature not only high strength but also good low-temperature toughness.Reference El-Danaf, Baig, Almajid, Alshalfan, Al-Mojil and Al-Shahrani1–Reference Liang, Peng, San Juan and Cheng3 Upgrading of pipeline steels from X60 to X100 and even higher grades has been achieved, aiming at the increment of transportation capacity and reduction of cost.Reference Su, Li, Lu, Li, Fletcher, Simpson, Barbaro, Zheng, Bai, Shen and Qu4 With yield strength higher than 480 MPa, X70 pipeline steel has already been widely used in numerous fields with high pressure, large diameter, and long distance transmission pipelines.
During fabrication of X70 pipeline steels, the thermomechanical control process (TMCP) technology has enabled to obtain high strength and good low-temperature toughness. It is well known that anisotropy plays a significant role in microstructural evolution and mechanical properties, and much attention has been focused on control of anisotropy to improve qualities of products.Reference Masoumi, Herculano and de Abreu5–Reference Gao, Wang, Gong, Qu and Lin7 Various morphologies of ferrite microstructures can be assumed in TMCP pipeline steels: polygonal ferrite (PF), quasi polygonal ferrite (QF), granular bainitic ferrite (GF), and bainitic ferrite (BF).Reference El-Danaf, Baig, Almajid, Alshalfan, Al-Mojil and Al-Shahrani1,Reference Shukla, Ghosh, Chakrabarti and Chatterjee8,Reference Zhao, Hanamura, Qiu, Nagai, Shan and Yang9 PF, assuming equiaxed grains with smooth continuous boundaries, forms at the highest temperature and slowest cooling rate; QF with irregular grains and jagged boundaries containing high density of dislocations and sub-boundaries is transformed through short range diffusion across the transformation interface; GF forms at the same temperature as BF but at lower cooling rate. Different combinations of these ferrites depend on the TMCP technology and can directly affect the strength level of pipeline steels.
Generally, yield strength is measured by employing tensile test, and characterization of the fracture mechanism was studied through observation of fracture surfaces of the as-fractured specimen.Reference Shanmugam, Ramisetti, Misra, Hartmann and Jansto10–Reference Joo, Suh and Bhadeshia12 Most of research studies focused on the microstructural evolution of materials surface and surface deformation (Lüders bands) of the tensile sample. Han et al.Reference Han, Lu, Wu, Li, Li, Lu and Gao2 referred that high dislocation density with different pinning effects on solute atoms was influential to the mechanical properties, after the Lüders bands passing during X80 tensile. Sung et al.Reference Sung, Lee, Lee, Kim, Ro, Lee, Hwang and Shin13 reported that the uniform elongation of X60 steel after the thermal aging process decreased with increasing volume fraction of PF, whereas the uniform elongation increased with increasing volume fraction of acicular ferrite (AF). However, for a tensile specimen of pipeline steels, such as a plate-type specimen, the deformation is inhomogeneous, which can be attributed to the plastic instability phenomenon.
In general, the stress–strain curve, microstructure of fracture-section, and thus obtained relative properties and fracture mechanism, which are paid more attention, are deeply analyzed for the tensile testing of metals. Whereas, most of the analyzed specimens were cut from the tensile samples without referring to the detailed locations, which might result in some confused conclusions due to the existence of different microstructures at the different areas for the tensile samples.Reference Shanmugam, Ramisetti, Misra, Hartmann and Jansto10,Reference Pogozhev, Tskitishvili, Matrosov, Klyukvin, Matrosov and Konovalov14 In fact, the microstructural evolutions of different areas for the whole tensile sample indicate a progress from deformation to fracture of metals. For pipeline steel, the microstructural evolution from deformation to fracture under stress is a key factor to understand the failure mechanism. Thus, the objective of this work is to study the anisotropy of X70 pipeline steel by analyzing the mechanical properties along different directions, and then research the microstructural evolutions of different areas following the tensiling axis [along the transverse direction (TD)]. The deformation during tensile testing was observed using the digital image correlation (DIC) system. The microstructural and microtextural evolutions were analyzed using the electron backscatter diffraction (EBSD) analysis.
II. EXPERIMENTAL PROCEDURES
The material used was a commercial X70 pipeline steel (Baosteel, Shanghai, China) supplied in a form of hot-rolled plate with a thickness of 9.5 mm. The microstructure is a coexistence of PF and QF. The chemical composition was determined by inductive coupled plasma-optical emission spectrometry, and the chemical composition obtained in this way is specified in Table I.
Chemical composition of the X70 pipeline steel (mass%).

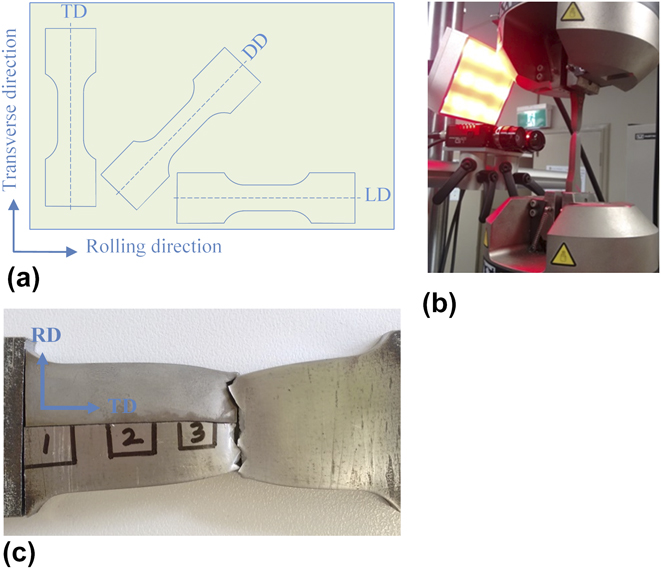
Tensile specimens with a width of 38 mm and a gauge length of 75 mm were prepared as illustrated in Fig. 1(a). Three directions of the X70 plate were conducted as tensile specimens: longitudinal direction (LD), TD, and diagonal direction (DD), and noting that there were three specimens at each direction. The surfaces and edges of the reduced section of the tensile samples were polished using a series of SiC paper from 240 to 800 grits to remove possible oxides. The uniaxial tensile tests were performed at a strain rate of 0.05 s−1 using an Instron machine (Norwood, Massachusetts) with a 100 kN capacity, and the data were recorded at a frequency of 10 Hz. In addition, a DANTEC DIC system was applied to measure strain distribution during tensile tests. Two Phantom 9.0 high speed digital cameras with an optic light source were used to record the images of the entire surface of the gauge section, and as many as 1900 images were finally captured in the 12 Gbyte camera buffer during tensile testing. The total experimental set-up for these tests is displayed in Fig. 1(b), which acquired the images at a frame rate of 1 frame/sec, with a resolution of 256 × 512 pixels (8-bit dynamic range). It should be noted that an increase in frame rate will in general reduce the resolution. Thus, the selected frame-rate and resolution constitute a compromise.
Related experimental procedures: (a) Orientations of tensile specimens, (b) photo of the total experimental setup for the tensile test, and (c) schematically analyzed areas along the TD of the fractured tensile sample.

After tensile testing, wire cutting was used to machine the specimens with a size of 10 × 10 × 9.53 mm in the different zones along the longitudinal cross section of the fractured TD tensile sample. As schematically shown in Fig. 1(c), the different zones were marked 1, 2, and 3, representing different deformation areas along the tensiled samples’ axis direction, which are adjacent to the fillet area, the quarter area of the gauge length, and the necking area, respectively, and the added sample was cut from the as-received material without tensile was defined as zone 0. The specimens analyzed were mechanically ground with a series of SiC papers from 240 to 1200 grit, and then prepolished using diamond pastes (3 and 1 μm), followed by light etching using OP-S silica solution.
Fractured surfaces of different directions for X70 pipeline steel were observed by scanning electron microscope (SEM), and microtexture evolutions of the fractured TD tensile samples were investigated by the EBSD analysis with a Nordlys-II(S) detector attached to JEOL-JSM7001F Schottky field emission gun scanning electron microscope equipment (FEG-SEM; JEOL, Tokyo, Japan), and an accelerating voltage and a probe current of 30 kV and 10 nA were used, respectively. A working distance of 24 mm was maintained constant irrespective of the mapping technique, and a step size of 0.12 μm was used for the scanning of EBSD.
The analysis of acquired data was carried out using Oxford Instruments Channel-5™ software (Abingdon, United Kingdom), where the local misorientation and the orientation distribution function (ODF) in the Euler space were extracted from the EBSD maps. In the noise reduction, an angular resolution for the grain reconstruction was maintained at a constant value of 5° to reduce orientation noise and retain orientation contrast/texture information. Subsequently, grain boundaries can be classified from orientation maps into the low-angle grain boundaries (LAGBs) as misorientation angle defined between 5° ≤ θ < 15°, whereas the high-angle grain boundaries (HAGBs) extend from θ ≥ 15°. Subgrain/grain reconstructions were undertaken using 5° as the minimum misorientation to fix the angular resolution limit and retain orientation contrast information.
III. RESULTS
A. Tensile properties
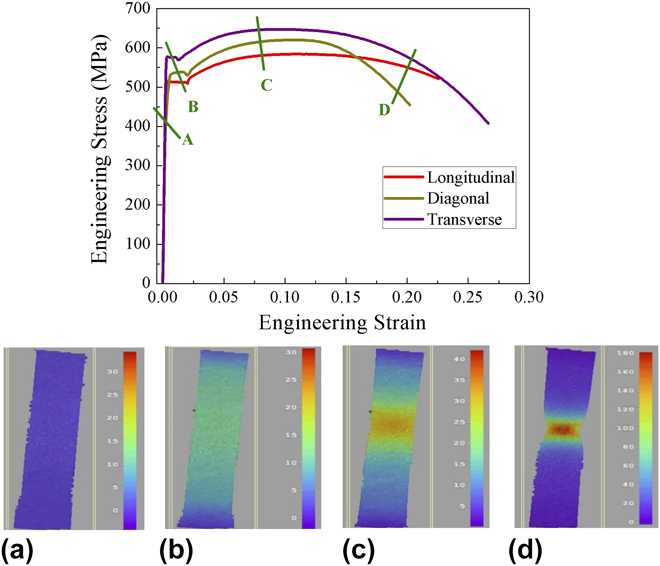
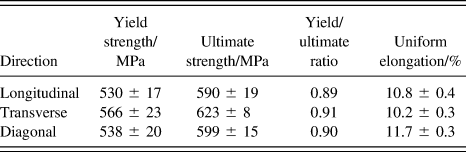
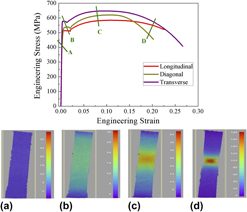
Figure 2 represents engineering stress–engineering strain curves of different directions for X70 pipeline steel and DIC pictures of strain changing of different stages of the TD sample. The obtained mechanical properties of the three directions are listed in Table II. The highest strength values can be observed at the TD, the yield strength is about 576 MPa, and the ultimate strength is up to 623 MPa. Whereas, the uniform elongation is close to 12% at the DD, which is higher than other directions. Therefore, the yield strength/ultimate strength (YS/UTS) ratio can be calculated to be about 0.89, 0.91, and 0.90 for LD, TD, and DD, respectively, which is less than the value of 0.93 for pipeline application recommended by the American Petroleum Institute (API) standards. According to the stress–strain curves, they show the obvious yield platform phenomenon for all the specimens, which is the Lüders behavior. Moreover, the DIC pictures show the evolution of strain changing with duration of tensile deformation, and the Lüders band with relatively higher local strain can be identified. The sustained deformation results in the concentration of strain as shown in Fig. 2(c) and leads to the necking on the strain concentrated area.
Engineering stress–strain curve and DIC pictures of strain changing of different deformation stages (for TD) in the curve of the X70 pipeline steel at a strain rate of 0.05 s−1: (a) elastic deformation-A stage, (b) yield-B stage, (c) plastic deformation-C stage, and (d) fracture-D stage.

Tensile test data representing mean values of three specimens at each direction.

The fracture surfaces of tensiled X70 pipeline steel following three directions were scanned using SEM and display a ductile type of fracture, of which the mechanism can be attributed to the occurrence of microvoid coalescence during tensile deformation (as shown in the Supplementary Material). The microvoids form during deformation and result in the initiation of cracks with stress concentrating on the microvoid locations. With the duration of deformation, the adjacent microvoids connect and coalesce into the dimples, i.e., the dimples in the result of microvoid coalescence, and this progress develops until the occurrence of the final fracture. Comparing with fracture surfaces of the three directions, it should be noted that some large dimples can be observed in the LD samples, and the dimple sizes were smaller in the DD samples, which means that the speed of microvoid coalescence is larger in the LD than that in the DD. In addition, there were not almost obviously large dimples existing in the TD samples, indicating that the propagation of microvoids is slow and homogeneous, and thus which is showing the highest strength values in the TD of X70 pipeline steel.
B. EBSD analysis
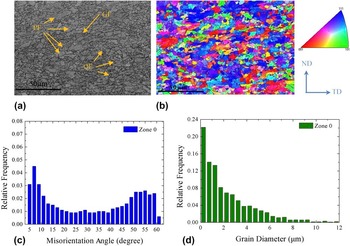
The orientation map, misorientation angle, and grain size distribution of the as-received hot-rolled X70 pipeline steel are shown in Fig. 3. Figures 3(a) and 3(b) depict the micrograph and orientation map, respectively. PF and QF coexisted with a combination of equiaxied grains and elongated grains can be detected. In addition, there should also be GF and BF in the materials, which are difficult to be recognized in the orientation map.Reference El-Danaf, Baig, Almajid, Alshalfan, Al-Mojil and Al-Shahrani1 The detected GF in the as-received steel was marked with arrow, which has been shown in Fig. 3(a). Figure 3(b) also shows a stereographic unit triangle for crystal directions with assigning red, green, and blue to the 001, 011, and 111 corners, respectively, indicating that the (111) is the dominated crystal grains. The misorientation distribution of grain boundaries [shown in Fig. 4(c)] indicates that the fraction of the HAGBs with misorientations above 15° is about 68%, and the thus LAGBs is 32%. It should be noted that misorientation angles smaller than 5° were not represented in Fig. 3(c), as they never corresponded to a packet boundary.Reference Gourgues, Flower and Lindley15 Using a critical misorientation angle of 15° means that grain boundaries with misorientation angle less than 15° are not considered, and the thus obtained distribution of ferritic grain size is displayed in Fig. 3(d).
Microstructure of the as-received hot-rolled X70 pipeline steel: (a) micrograph with misorientation angle above 5°, (b) orientation contrast EBSD imaging map, (c) variation of misorientation angle, and (d) distribution of grain size with a critical misorientation angle of 15°.

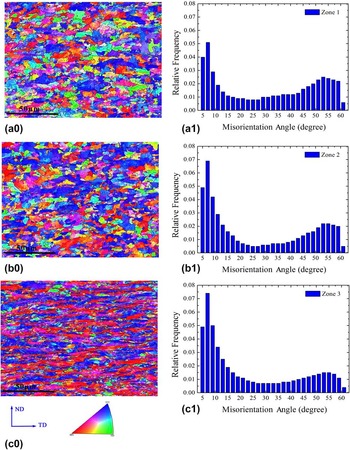
Orientation contrast EBSD imaging maps and inverse pole figures of the different zones [(a0) zone 1, (b0) zone 2, and (c0) zone 3] along the TD of the fractured samples, and distributions of grain boundary misorientations of the three different zones [(a1) zone 1, (b1) zone 2, and (c1) zone 3].

The orientation maps, after tensile testing, of the different zones along the TD of the fractured sample are displayed in Fig. 4. During tensile deformation, it can be found that the deformations of grains in the various locations from the fillet zone to the fracture zone of the tensile sample were obviously different. PF and QF grains were found to be elongated, and the elongation of the grains increased with the decrease in the distance to the fracture zone, indicating that the dislocations slip more easily in PF and QF. All the deformed grains were parallel to the tensile stress direction, and the largest deformations occurred in zone 3 adjacent to the tensile fracture. In zone 3, most of the grains are elongated to be closed to a maximum, which means that the plastic deformation capacity among these grains will become more difficult and finally results in the occurrence of fracture after over the relatively limited plastic capacity of the steel.
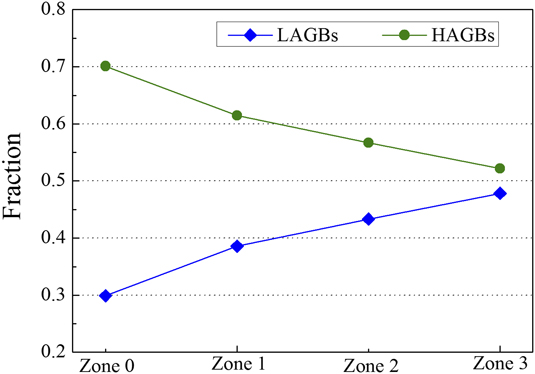
The distributions of grain boundary misorientations of the three different zones for the fractured sample are also displayed in Fig. 4. The tensile deformation in the fillet zone caused the increase of the fraction of 10°–54° boundaries, comparing with the as-received steel [Fig. 3(c)]. The fraction of misorientations in the range from 5° to 10°, obviously, was higher than the fraction from 50° to 55°, and the contrast increased as the location was more adjacent to the fracture, which means that the LAGBs in the fractured sample significantly increase. The fraction of grain boundary misorientation angles of the as-received and the fractured samples is shown in Fig. 5. The ratio between HAGBs and LAGBs in the as-received steel was about 7/3, which means that the grain boundaries of PF and QF are large misorientations. Whereas, the ratio for the different zones of the tensile fractured sample started to decrease, and it was very close to 1 at the fracture zone.
Fraction of grain boundary misorientation angles of the as-received and the fractured samples.

As shown in Fig. 5, the fraction of HAGBs in zone 3 was the lowest in comparison with those in zones 1 and 2, reflecting that the deformation at the fracture zone is larger than other zones. The misorientations of the fracture zone, existing less HAGBs and more LAGBs, is absolutely different with the fillet zone and the quarter zone (shown in Fig. 4), which also reveals the largest deformation in zone 3.
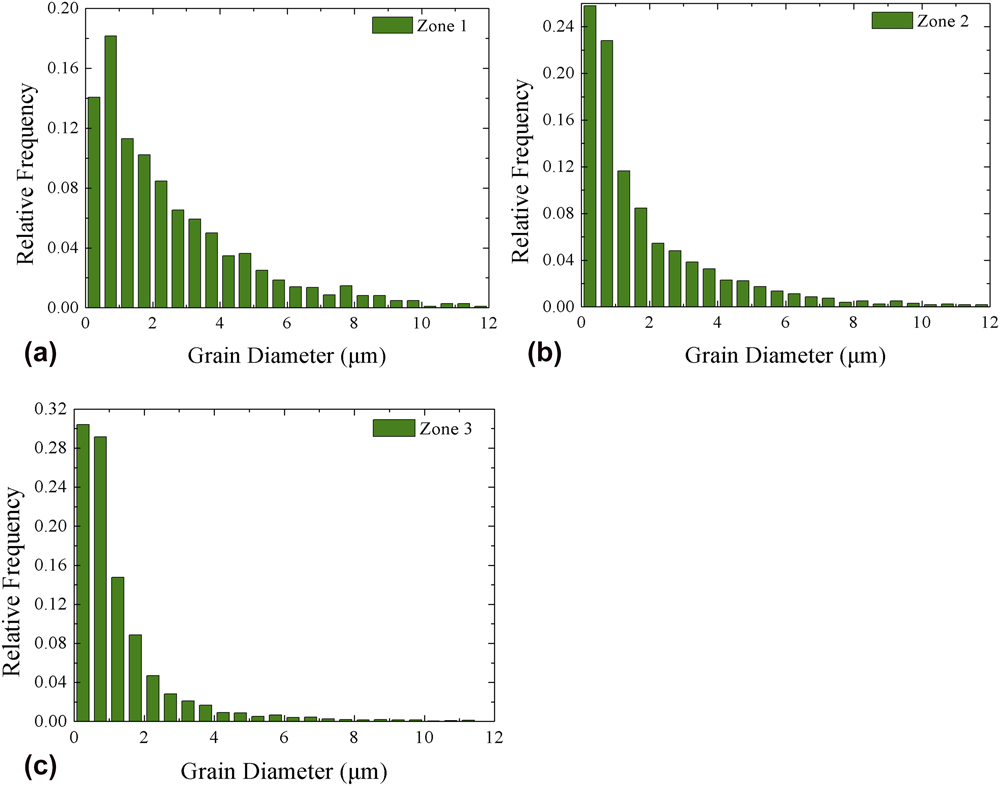
Figure 6 illustrates the distributions of grain size of the three different zones for the fractured sample. The application of a critical misorientation angle of 15° should also be noted during counting. There were many small grains less than 3 μm in the microstructure of the fractured sample, and the percentage of the small grains increased from about 68.7% in zone 1, 78.9% in zone 2 to 90.7% in zone 3. The average grain sizes of the three zones from 1 to 3 are about 2.5 μm, 1.9 μm, and 1.3 μm, respectively, indicating that the grains are refined with being adjacent to the fracture section due to the formation of subgrains which are resulted from the dislocation climbing. Most of the grains in zone 3 were less than 2 μm, which represents that there is a serious refinement of grains in the fracture area.
Distributions of grain size of the three different zones for the fractured sample: (a) zone 1, (b) zone 2, and (c) zone 3.

C. Microtexture
Figure 7 shows the constant φ2 = 0° and φ2 = 45° sections of ODFs of the as-received sample and the three different zones of the fractured sample, and the obtained position of the main texture components in φ2 = 45° is also depicted in Fig. 7. The texture of the as-received steel consisted mainly of cube, R-cube, and γ-fiber after hot-rolling, among which the cube texture was the strongest component [shown in Fig. 7(a)]. The cube and γ-fiber components are also common types of hot-deformed texture during hot processing.Reference Masoumi, Herculano, Almeida, Béreš and Abreu16 The cube {100}〈110〉 component is, generally, considered originating from the recrystallization of fcc austenite. Joo et al.Reference Joo, Suh, Bae and Bhadeshia17 have shown that there was an exaggerated fraction of grains with {100} plane-normals at 45° to the rolling direction, and which meant that the crystallographic texture in the hot-rolled steel had a harmful effect on the brittle fracture. The γ-fiber texture was dominated by (111) $\left[ {1\bar{2}1} \right]$ and (111)
 $\left[ {\bar{1}\bar{1}2} \right]$ components. With the increase in deformation of tensile strain, the intensities of the cube and γ-fiber textures increase sharply, and the strongest appears at the location being close to the fracture area (shown in Fig. 7). The (001)
 $\left[ {1\bar{1}0} \right]$ and (001)
 $\left[ {\bar{1}\bar{1}0} \right]$ components, the initially strongest texture in the as-received steel, strengthened sharply during tensile testing. Additionally, the maximum intensity of the cube texture at the as-received steel was 6.22 and increased to be about 14.5 at the fracture area. In addition, the reinforcement of the (111)
 $\left[ {\bar{1}\bar{1}2} \right]$ component was obviously larger than the (111)
 $\left[ {1\bar{2}1} \right]$ component, which reveals that the slip of the (111)
 $\left[ {\bar{1}\bar{1}2} \right]$ component is dominant in the γ-fiber texture during tensile deformation.
ODFs at φ2 = 0° and φ2 = 45° of (a) the as-received steel and (b) zone 1, (c) zone 2, (d) zone 3 of the fractured sample, and (e) shows the schematic illustration of the main texture components in the X70 pipeline steel.

IV. DISCUSSION
According to Fig. 2, the highest value of the yield strength appeared at the TD, and so did the YS/UTS ratio, and the anisotropy of the hot-rolled X70 plate can be distinguished. A high YS/UTS ratio is equivalent to a low work hardening rate, and meaning that the wok hardening rate at the TD is lowest. It should also be noted that the lowest yield strength is obtained at the LD. During steel working, the Bauschinger effect is always considered, which can be applied to describe multicyclic loading cases.Reference Yoshida, Hamasaki and Uemori18 During hot-rolling of the X70 steel plate (compression deformation), the grains were elongated along RD, and largest deformation occurred at RD, which leads to the largest Bauschinger effect. The grains with relatively smallest deformation were approximately equiaxed along the TD observation. Hence, the varieties of yield strength and the YS/UTS ratio can be attributed to the effect of the Bauschinger effect, i.e., the lowest yield strength during tensile appeared at the largest deformation along RD after hot-rolling, and TD has the highest yield strength.
A Lüders platform appears in all the tensile specimens, which can be attributed to that the appearance of Lüders bands is quite sensitive to the level of difference in stress concentration existing in the specimen.Reference Sun, Yoshida, Ohmori and Ma19 Regarding the pipeline steels produced by hot-rolling, the original ferrite microstructures can be mainly divided into PF, QF or massive ferrite, GF, in the orders of decreasing transformation temperatures and increasing cooling rates.Reference Han, Lu, Wu, Li, Li, Lu and Gao2 Kim et al.Reference Kim, Kim, Lim and Kim20 explained the yield behavior in terms of the presence and amount of secondary phases contained in the AF structure and reported that the quasi-continuous yield behavior occurred with increasing volume fraction of PF. Pogozhev et al.Reference Pogozhev, Tskitishvili, Matrosov, Klyukvin, Matrosov and Konovalov14 also attributed the appearance of a yield platform in X70 pipeline steel to that within the structure austenite decomposition products into the ferrite–pearlite region predominate, but if the austenite predominantly decomposed into the intermediate transformation region, the yield platform would be absent. LakeReference Lake21 shown that the propagation of the Lüders bands is dependent on the grain size, with the finer grain sizes resulting in less propagation. In fact, Hutanu et al.Reference Hutanu, Clapham and Rogge22 proved that the shape and texture of Lüders bands depended on the sample thickness, and little texture existed within the Lüders bands for the thicker samples. The inhomogeneity of the microstructure is larger in the thicker samples, and it is difficult to form the deformation texture in the deep interior of the samples. Therefore, even for single hot-rolled plate, the nonuniformity cannot be avoided during the manufacturing process, which is supposed to lead to the differences in the microstructure.
A common crystallographic characteristic is the disappearance of misorientations in an approximate range of 20°–47° [as shown in Figs. 3(c) and 4], which is a consequence of transformation from austenite to ferrite and the different ferrite variants formed from the same austenite structure.Reference Yang, Xu, Tan and Wu23,Reference Diaz-Fuentes, Iza-Mendia and Gutierrez24 Whereas, according to Nafisi et al.,Reference Nafisi, Arafin, Collins and Szpunar25 only when the ferrite grains newly formed from different austenite grains make contact, these grains can be exhibited by misorientation angles in the range of 20°–47°. As in the case of the as-received steel, the prior austenite–austenite grain boundaries were evident in the orientation map [Fig. 3(b)], resulting in changing of the misorientations in this range. In addition, it should also be noted that the mean fraction of misorientations from 5° to 10° at LAGBs was approximately equivalent to that of HAGBs from 50° to 55°. Most of the grain size less than 8 μm (above 95%), and an average size of about 2.6 μm, revealed a fine ferritic microstructure for the as-received steel using the EBSD analysis (Fig. 3). For fine scale-microstructures, HumphreysReference Humphreys26 pointed that the step size of EBSD definitely affects the measured grain size, and the greatest accuracy will clearly be obtained if the step size is small enough. The value 0.12 μm, the step size used, should be small enough based on the literature studies,Reference Mingard, Roebuck, Bennett, Gee, Nordenstrom, Sweetman and Chan27,Reference Humphreys28 and thus the grain sizes measured should reveal the true values of the as-received steel.
At the beginning of the deformation, the strain first starts at the fillet of the tensile sample, which has been proved in the literature studies.Reference Canadinc, Efstathiou and Sehitoglu29–Reference Hamada, Haggag and Porter31 With the duration of deformation, the grains are elongated, and the compatible deformations among the different grains occur, and both of them induce the increase in the anisotropy of grains. It means that the grain orientations will be along the direction of strain, indicating a decrease in the misorientations among the grains. The formation of dislocation walls in the grains due to the climbing of most dislocations leads to the formation of subgrains, which results in the increase in LAGBs. Moreover, HAGBs are considered to change the cleavage crack propagation direction and partly prohibit the development of the crack.Reference Diaz-Fuentes, Iza-Mendia and Gutierrez24 The increase in LAGBs, during tensile, decreases the capacity of plastic deformation. The deformation starts at the fillet zone and focuses at the center during tensile. The strain keeps expanding and theoretically focuses to the center of the tensile sample. Therefore, the deformation in zone 3, adjacent to the fracture area of the tensile sample, is largest, which is as revealed in Figs. 4 and 5, will result finally in the fracture of the material.
The larger strain distribution was mainly observed in the ferrite matrix adjacent to the fracture neck with the duration of tensile (Fig. 2), corresponding to a relatively higher stress concentration.Reference Han, Lu, Wu, Li, Li, Lu and Gao2 The 〈110〉 orientation for bcc ferrite is the usual final orientation following the tensile axis after high tensile deformation, and thus the reinforcement of the {hkl}〈110〉 component in the bcc ferrite can be expected. Masoumi et al.Reference Masoumi, Herculano, Almeida, Béreš and Abreu16 considered the effect of thickness of API X70 steel on the texture heterogeneity and shown that the (001) $\left[ {\bar{1}\bar{1}0} \right]$ texture dominated in the center layer, whereas the {110}//ND component was developed at the surface layer. It should be noted that the center area of the analyzed cross section of the samples was conducted during scanning of EBSD. The deformation of the tensile sample is nonuniform before tensile fracture as we discussed above, and the (001)
 $\left[ {\bar{1}\bar{1}0} \right]$ texture increased sharply with approaching to the fracture area. The formation of the substructure at zone 1, adjacent to the fillet area, can be recognized as a recrystallization of the microstructure, and thus reduces the intensity of the texture, which results in the lowest intensity value of 5.75 (Fig. 7). Adjacent to the fracture area, most of the grains are elongated, predominantly form clusters aligned with the tensile axis direction, indicating the strongest orientation with the maximum intensity of 14.5 (Fig. 7).
V. CONCLUSIONS
Anisotropy of X70 pipeline steel and microstructural evolutions of different zones along the TD were investigated based on the EBSD analysis, and a DIC system was applied to measure strain distribution. The following results can be concluded:
(1) The highest strengths (yield strength and ultimate strength) appear at the TD, and the DD shows a largest uniform elongation.
(2) The elongation of the PF and QF grains increases with the decrease in the distance to the fracture zone, and the ratio between HAGBs and LAGBs decreases along the fillet zone to the fracture zone.
(3) The refinement of grains occurs adjacent to the fracture section due to the formation of subgrains.
(4) With the increase in tensile strain, the intensities of cube and γ-fiber textures increase sharply, and the slip of the (111)
 $\left[ {\bar{1}\bar{1}2} \right]$ component is dominant in the γ-fiber texture during tensile deformation.

Supplementary Material
To view supplementary material for this article, please visit https://doi.org/10.1557/jmr.2018.190.
ACKNOWLEDGMENTS
The grants and financial supports from the National Natural Science Foundation of China (No. 51501034), the Fundamental Research Funds for the Central Universities (No. N172304041), and the Youth Research Foundation of Hebei Education Department (No. QN2014338) are gratefully acknowledged.