

Introduction
The management of advanced laryngeal cancer (about 2000 cases per annum in the UKReference Ansari, Lange, Southgate, Greco, Carvalho and Partington1) often involves partial or total laryngectomy, which carries significant mortality (0.5 per cent2) and morbidity (20–40 per cent3). For the majority of survivors, altered voice, swallowing and breathing, activity, appearance, smell, and taste, amongst other problems, cause a considerable reduction in quality of life.Reference Pereira da Silva, Feliciano, Vaz Freitas, Esteves and Almeida e Sousa4, Reference Agarwal, Gogia, Agarwal, Agarwal and Mathur5
Tissue-engineered airway scaffolds have now been successfully used in compassionate settings,Reference Omori, Nakamura, Kanemaru, Asato, Yamashita and Tanaka6–Reference Hamilton, Kanani, Roebuck, Hewitt, Cetto and Culme-Seymour8 raising the possibility that this technology may be extended to laryngeal reconstruction.Reference Hamilton and Birchall9 Such successes have instigated a search for the ideal material for implantable scaffolds,Reference Mehrban, Zhu, Tamagnini, Young, Wasmuth and Hudson10 based both on natural and synthetic materials.Reference Atala, Kasper and Mikos11
There are significant challenges to controlling and quality controlling the chemical and physical properties, and behaviour in vivo, of biological raw materials such as laminin and collagen.Reference Cunha, Panseri and Antonini12 Synthetic materials such as poly(urethane) and biodegradable glass, being comparatively easy to manufacture, offer relatively unrestricted availability, as well as the potential to modify their properties to suit purpose,Reference Hollister13 particularly pertinent to demanding clinical applications such as airway replacement.
A polymer's mechanical properties and pre-disposition to cellular attachment can be significantly altered by the addition of specific molecules.Reference Knight, Lee, Chung and Mather14, Reference Gupta, Vara, Punshon, Sales, Winslet and Seifalian15 One such nano-composite is polyhedral oligomeric silsesquioxane poly(carbonate-urea) urethane (‘POSS-PCU’). This non-biodegradable family of polymers has been shown to possess in vivo biostability, effective mechanical strength and biocompatibility.Reference Tan, Farhatnia and Seifalian16 In vivo biostability was described by Anderson and Zhao (2013)Reference Anderson and Zhao17 as a term which ‘commonly refers to the relative stability of biomedical polymers in the physiological environment as a function of time’.
Tissue-engineered scaffolds of hollow viscera should maintain barrier function, whilst supporting tissue and vascular regeneration.Reference Loh and Choong18, Reference Hamilton, Bullock, Macneil, Janes and Birchall19 Although polyhedral oligomeric silsesquioxane poly(carbonate-urea) urethane's semi-closed pore architecture supports its surface integrity, gaining access to the porous inner structure has been an issue. The addition of porogens (pore-forming solid particles) during polyhedral oligomeric silsesquioxane poly(carbonate-urea) urethane synthesis improves its internal porosity. However, unpublished preliminary work from our group shows that this is counteracted by the formation of a ‘skin’ on the polymer's surface occurring on contact with deionised water during the solidification process.
Here, we investigated methods to modify the surface permeability of polyhedral oligomeric silsesquioxane poly(carbonate-urea) urethane, whilst using porogen to increase internal porosity. We studied resultant changes in surface topography, mechanical and chemical properties, porosity, and biocompatibility. The effects of time and incubation on treated and untreated scaffolds were also investigated. We hypothesised that perforating the impermeable surface of polyhedral oligomeric silsesquioxane poly(carbonate-urea) urethane would lead to improved cellular migration into the scaffold.
Materials and methods
For the purposes of this study, incubation was always carried out at 37°C, in 5 per cent carbon dioxide and 100 per cent relative humidity.
Synthesis
Polyhedral oligomeric silsesquioxane poly(carbonate-urea) urethane was synthesised using a previously reported method.Reference Chawla, Tan, Ahmed, Crowley, Moiemen and Cui20 Briefly, trans-cyclohexanechloroydrinisobutyl-silsesquioxane and polycarbonate polyol were added to a reaction flask fitted with a mechanical stirrer and nitrogen inlet. This mixture was then heated to 135°C allowing the polyhedral oligomeric silsesquioxane cage to dissolve in the polyol, and was then cooled to 70°C. Flake 4,4’-methylenebis(phenyl isocyanate) was added to the mixture and reacted (under nitrogen and at 75–85°C) for 90 minutes, forming a pre-polymer. Dimethylacetamide was slowly added to the pre-polymer and the resultant solution was cooled to 40°C. Ethylenediamine, dissolved in dimethylacetamide, was then added, drop wise, to the mixture. This enabled chain extension of the pre-polymer to occur, resulting in the formation of a polyhedral oligomeric silsesquioxane modified polycarbonate urea-urethane solution, dissolved in dimethylacetamide.
Fabrication
This section describes the fabrication of porous polyhedral oligomeric silsesquioxane poly(carbonate-urea) urethane. Specifically, porogen (refined grade sodium bicarbonate (Tata Chemicals Europe, Northwich, UK), sieved using stainless steel sieves (Fisher Scientific, Loughborough, UK), to a 53–100 μm average granule size) was added to 18 weight per cent polyhedral oligomeric silsesquioxane poly(carbonate-urea) urethane and Tween 20 (Sigma-Aldrich, Gillingham, UK) surfactant (20 per cent sodium bicarbonate, 78 per cent polyhedral oligomeric silsesquioxane poly(carbonate-urea) urethane and 2 per cent Tween 20; weight per cent) to form the test foam elastomer polymer sheets via porogen leaching and coagulation methods.Reference Nayyer, Jell, Esmaeili, Birchall and Seifalian21 Control polymer sheets were formed similarly, without porogen being added. Briefly, the polymer was mixed using a Thinky ARE-250 mixer (Intertronics, Kidlington, UK), at 3000 revolutions per minute for 3 minutes, and then poured onto glass plates with a 300 μm thick wall around the edges. The mixture was spread using a rod to ensure an even coating. The plates were then submerged in deionised water and left to coagulate for 3 days, with the water being changed 3 times per day. The polymer sheets were then removed from the glass plates and stored under deionised water, at room temperature.
Perforation
Two techniques were devised to perforate the surface of porous and non-porous samples of polyhedral oligomeric silsesquioxane poly(carbonate-urea) urethane.
Laser technique
A laser cutter (intensity of 6 (defined below) and velocity of 0.60 (i.e. 0.6 per cent of 180 cm/second = 1.08 cm/second), at 1000 pulses per inch, using a Speedy 300 device; Trotec Laser, Plymouth, Michigan, USA) was used to cut a polymer disc and perforate it at randomly selected, incremental distances of 0.31 mm, 0.49 mm, 0.67 mm, 0.89 mm, 1.08 mm and 1.4 mm. The disc was then imaged via scanning electron microscopy to select an inter-perforation distance, which avoided the overlapping or abutting of perforations. The optimal distance selected was 1.4 mm. Various laser intensities were then appraised and two were selected: 3 and 6 (intensity 3 = 3 per cent of 30 W = 0.9 W; intensity 6 = 6 per cent of 30 W = 1.8 W). Sheets were laser-perforated, cut into appropriate shapes and stored under sterile phosphate-buffered saline.
Mechanical method
Custom-made equipment was set up (Figure 1) with a spiked titanium roller, acting at two forces. The stiffness, or spring constant, of the compliant element of the apparatus (kit number 251, Lee Spring, Wokingham, UK) was measured using an Instron 5565 tester (500 N load cell; Instron, High Wycombe, UK).
Mechanical perforator apparatus set-up. The platform is equipped with a retractable drawer mechanism, on which the petri dish is mounted. ‘×’ indicates the direction in which the retractable drawer is pulled. Lab = laboratory

Squares (53 mm × 53 mm) were cut from porous and non-porous sheets of polymer using a laser cutter (Speedy 300; Trotec), placed in the petri dish, and the platform raised until the spikes of the microneedle roller (540 Titanium Micro Needles Derma Microneedle Roller 2.5 mm; Sodacoda, London, UK) just touched the polymer. This was then raised a further distance to be perforated at the required force. The drawer was then pulled out at a steady pace such that the spiked roller ran over the entire polymer surface. These sheets were cut into dumbbell shapes (in accordance with International Organization for Standardization (‘ISO’) standard 37 specifications) for tensile testing, discs were cut for cellular experiments and off-cuts were used for scanning electron microscopy imaging.
Sample codes
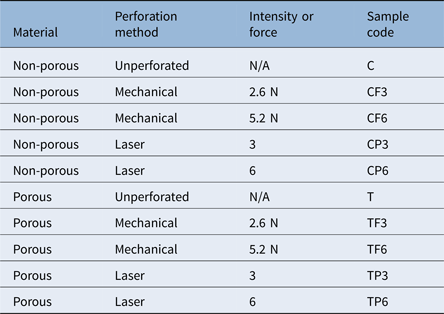
Initially, two batches of polyhedral oligomeric silsesquioxane poly(carbonate-urea) urethane were used in polymer fabrication: sample 1 and sample 2. Sample 2 polyhedral oligomeric silsesquioxane poly(carbonate-urea) urethane was synthesised six months after sample 1. The forces to be used for mechanical perforation were initially arbitrarily chosen as 2.5 N and 5.0 N. The changes in platform height associated with these forces were derived. In practice, the closest forces to these values achievable using this method were 2.6 N and 5.2 N and these were therefore used throughout this study.
Surface wetness using contact angle measurement
Drop-shape analysis was used to determine the material's hydrophilicity and hydrophobicity. The sessile drop method was used to measure the contact angle between a droplet of deionised water and the polyhedral oligomeric silsesquioxane poly(carbonate-urea) urethane surface; analysis of this was carried out via a Drop Shape Analyzer DSA 100 (Krüss, Hamburg, Germany).
Contact angle measurements of non-porous and porous samples were compared. Contact angle readings of porous samples six months post-synthesis were measured in order to assess potential changes with time.
Mechanical properties
Specimens were first cut into dumbbell shapes (in accordance with International Organization for Standardization standard 37 specifications) using a laser cutter (intensity = 6 and velocity = 0.60, at 1000 pulses per inch; Speedy 300, Trotec) and their tensile properties were assessed using an Instron 5565 tester (500 N load cell, with a separation distance of 20 mm; Instron), after the thickness of each dumbbell was assessed and noted using digital callipers. The relationship between stress and strain was analysed as per International Organization for Standardization standard 37, and the rate of displacement was set at 50 mm per minute−1. Bluehill software was used to calculate Young's modulus from the linear region of the plot within 0–5 mm displacement. Briefly, stress, strain and Young's modulus were calculated using the equations below.Reference Davis22
 $${\rm E} = {\rm \;\ \sigma \;} /{\rm \;\ \varepsilon} $$
where E is the Young's modulus (N/m2) of the material under investigation, σ is the normal stress (N/m2) and ε is a unit-less measure of engineering strain applied to the material under investigation. The two components of this equation required to calculate E, σ and ε, can be calculated using equations two and three:
 $${\rm \sigma} = {\rm F}_{\rm n}{\rm /\ A}$$
where σ is the normal stress (N/m2) applied across the area of the material under investigation, Fn is the normal component force (N) applied to this area, and A is the area (m2) of the material itself. And:
 $${\rm \varepsilon \;\ =\ \;\ dl\;\ /\;} {\rm l}_{\rm 0}$$
where ε is a unit-less measure of the engineering strain applied to the material under investigation, dl is the change of length (m) and lo is the initial length (m) of the material under investigation.
Tensile testing was also used to compare the mechanical properties of porous, unperforated samples synthesised six months apart, in order to assess the effect of time.
The effect of time and incubation on the mechanical properties of treated, porous polyhedral oligomeric silsesquioxane poly(carbonate-urea) urethane was also assessed. Briefly, polymer dumbbell shapes, cut and laser or mechanically treated on day 0, were tensile tested. They were then stored in sterile phosphate-buffered saline, changed three times weekly, and incubated to simulate conditions to be used in cellular studies. Tensile testing was repeated on day 15.
Imaging
Samples were dehydrated by serial submersion in 100 per cent ethanol for 15 minutes. They were then dried either by critical point drying (device model CPD 020; Balzers, Liechtenstein) over 3 hours, or freeze-dried using a freeze dryer (model 4.5; Labconco, Kansas City, Missouri, USA) with a temperature setting of −50°C and a vacuum of less than 10 μm of Hg for 4 hours.
Scanning electron microscopy
Samples were dried via critical point drying and then coated with gold (film thickness of 20 nm) using a rotary-pumped sputter coater (Q150R; Quorum Technologies, Lewes, UK). A scanning electron microscope (EVO-HD15; Carl Zeiss, Oberkochen, Germany) was used to image volar, dorsal and cross-sectional aspects of samples at various magnifications.
Samples imaged on day 0 of perforation were first dried via critical point drying and then coated with gold/palladium (film thickness of 2–3 nm) using an ion beam coater (model 681; Gatan, Pleasanton, California, USA). Samples imaged on day 15 were freeze-dried and then coated with gold using a rotary-pumped sputter coater (Q150R; Quorum Technologies).
A JSM-7401F field emission gun scanning electron microscope machine (Jeol, Tokyo, Japan) was used to image the volar, dorsal and cross-sectional aspects of the samples, at 0° and 30° of tilt, at an extra-high tension of 3 kV and at a range of magnifications.
Micro computed tomography
Micro computed tomography (CT) scanning was chosen to assess tissue porosity. Unperforated and laser-perforated porous polymer samples were dried using critical point drying. The samples were scanned using a micro CT scanner (Skyscanner 1172; Bruker, Kontich, Belgium) at a resolution of 2 μm, with a rotation step of 0.3° and random movement setting of 20. Images were reconstructed using Skyscan NRecon reconstruction software (Bruker) and processed using CTVox volume rendering software (Bruker).
Quantitative data (e.g. open porosity) were calculated via CT analyser software (Bruker), over a designated region of interest selected at random.
ImageJ quantitative image analysis
Measurements of inter-perforation distance and perforation diameter were taken from field emission gun scanning electron microscope images of laser-perforated samples using ImageJ analysis software (National Institutes of Health, Bethesda, Maryland, USA).Reference Schindelin, Rueden, Hiner and Eliceiri23 These were taken on days 0 and 15, over which period the samples were incubated under phosphate-buffered saline, changed 3 times weekly. For each perforation, two diameter measurements were taken in the horizontal and vertical planes. Inter-perforation distance was measured from one end of a perforation to the corresponding end of an adjacent perforation (n = 17).
Effect of incubation and time on perforations
Porous and non-porous laser and mechanically treated samples were divided into two groups. One group was coated and imaged on day 0. The second group was stored under sterile phosphate-buffered saline (Sigma-Aldrich, St Louis, Missouri, USA), incubated for 15 days and imaged on day 15. Perforation diameter was measured, at days 0 and 15, using field emission gun scanning electron microscope images of dorsal and volar aspects of laser perforations at both intensities (3 and 6). For each perforation, two diameter measurements were taken in the horizontal and vertical planes.
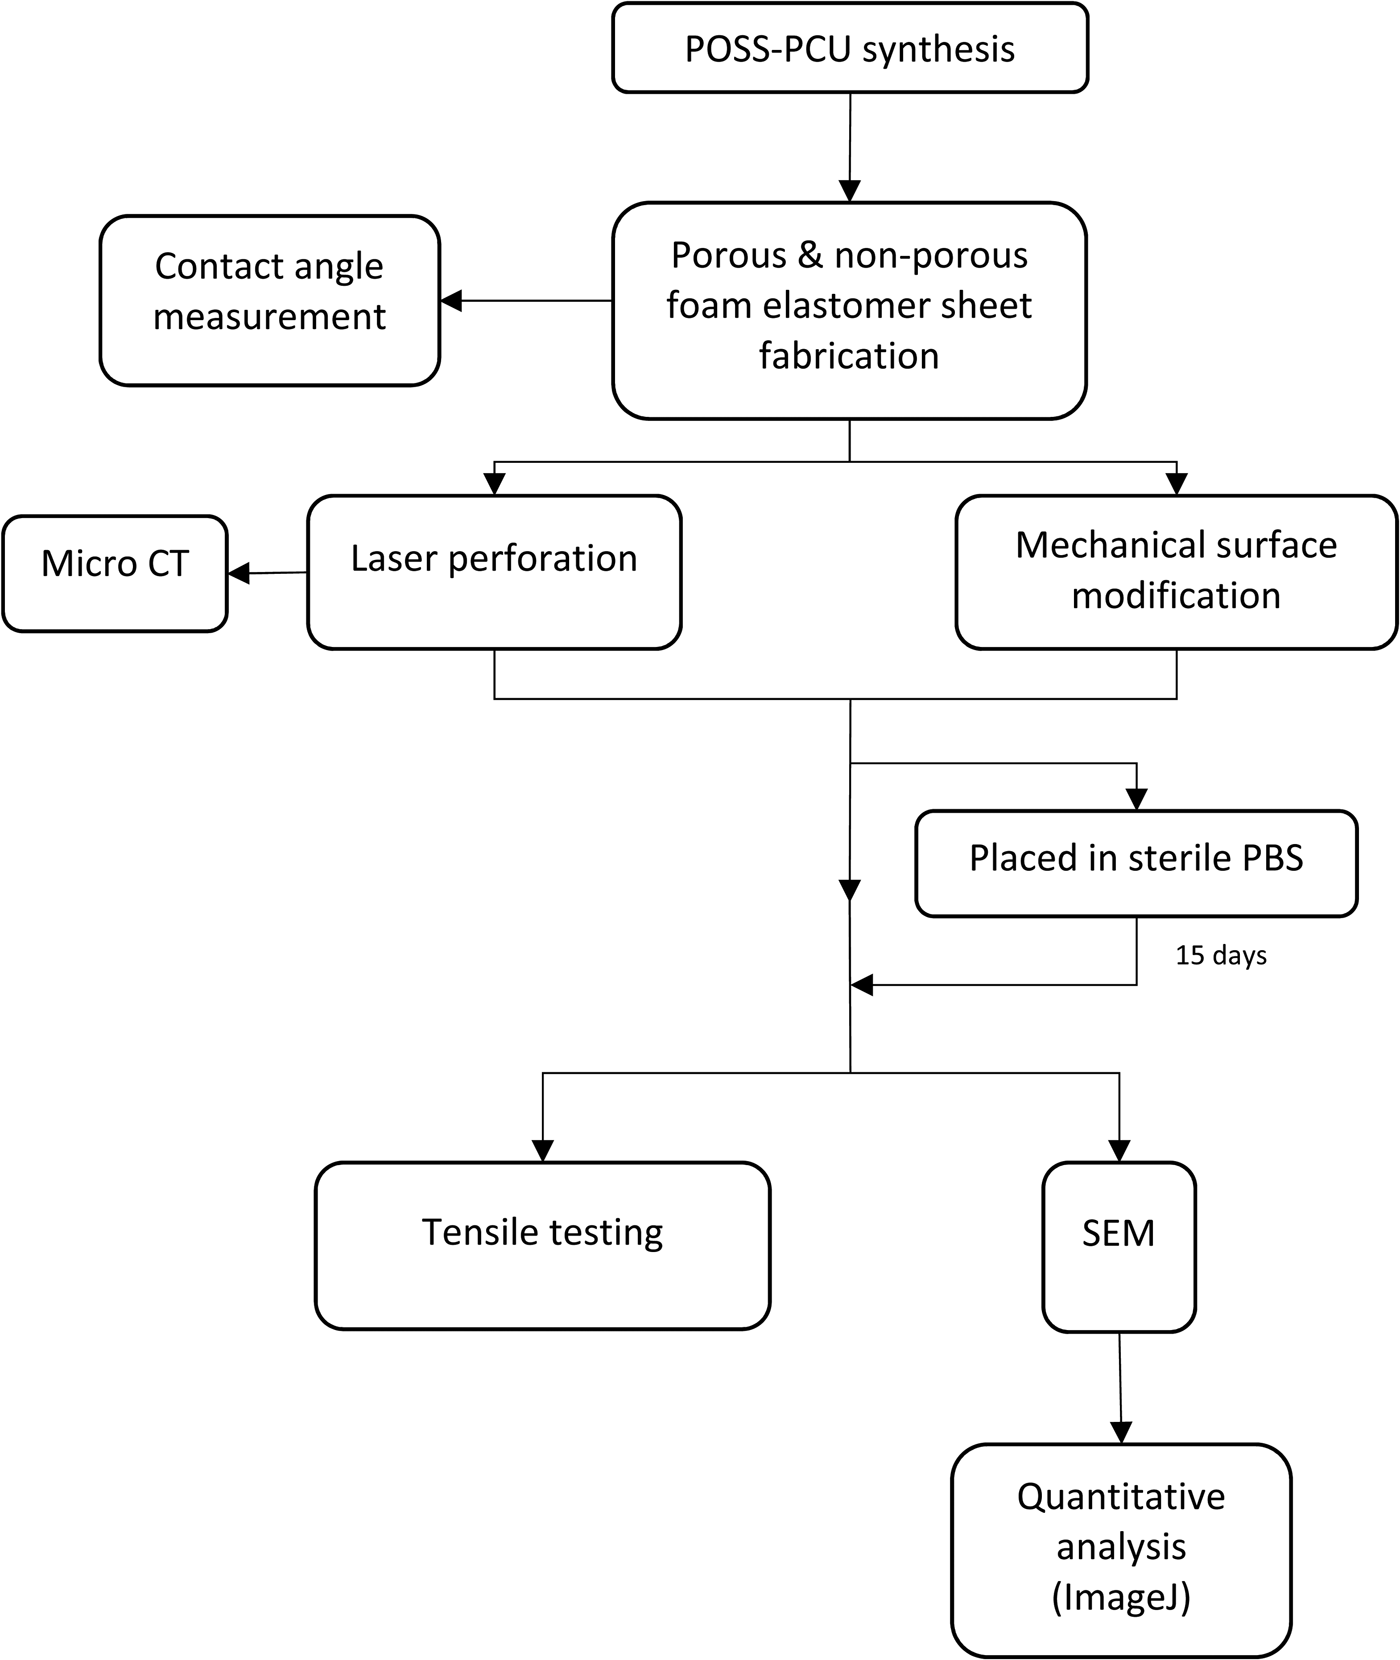
Figure 2 depicts the series of experiments undertaken.
Flowchart summarising key steps and timelines of the characterisation experiments. Statistical analysis was also carried out. POSS-PCU = polyhedral oligomeric silsesquioxane poly(carbonate-urea) urethane; CT = computed tomography; PBS = phosphate-buffered saline; SEM = scanning electron microscope

Cellular studies
Cell culture and seeding
All disposable materials used for cell culture were manufactured by Gibco (ThermoFisher Scientific, Newport, UK), unless otherwise stated.
Porcine epithelial cells and P7072 porcine fibroblasts were obtained from a Good Manufacturing Practice accredited laboratory (Laboratory of Cellular Therapeutics, Royal Free Hospital, London, UK) and were isolated from piglet supraglottis. Murine fibroblasts from a 3T3-J2F cell line were cultured as a feeder layer for the porcine epithelial cells. All cells were cultured using standard cell culture techniques, using a 10 per cent solution of fetal bovine serum (volume/volume (v/v)) in Dulbecco's modified Eagle's medium.
Cells were cultured (using Nunc Cell Culture Treated EasYFlasks cell culture flasks, with filter caps; ThermoFisher Scientific) at a seeding density of 1.0 ×104cm−2, and left to incubate over 24 hours to allow them to become adherent prior to medium change. The cells were then left to incubate, with the medium being changed approximately every 72 hours.
Mitomycin-C 100 μl (1 mg/ml) was added to each flask to generate mitotically inactive feeder cells. After rinsing with phosphate-buffered saline, ethylenediaminetetraacetic acid 0.02 per cent solution (6 ml; Sigma-Aldrich, USA) was added and the cells incubated for 20 minutes. The porcine epithelial cells were removed using TrypLE Select enzyme (1×; 10 ml; Gibco, ThermoFisher Scientific) and 20 ml of media, supplemented with Rho-associated coiled-coil forming protein serine/threonine kinase inhibitor (0.1 per cent v/v Rho-associated coiled-coil forming protein serine/threonine kinase inhibitor in Ham’s F-12 Nutrient MixtureReference Butler, Hynds, Gowers, Lee, Brown and Crowley24 (Gibco, ThermoFisher Scientific)) was then added.
After one week of culturing, TrypLE Select enzyme (1×; 10 ml; Gibco, ThermoFisher Scientific) was added to digest the fibroblasts and porcine epithelial cells, and the feeder cell layer was removed. Supplemented Dulbecco’s modified Eagle’s medium was then added to inhibit the action of TrypLE Select.
The cells were suspended in 40 ml of Ham's F-12 Nutrient MixtureReference Butler, Hynds, Gowers, Lee, Brown and Crowley24 (Gibco, ThermoFisher Scientific) and the cell densities of each mixture were established using a haemocytometer. Cells were cultured onto polyhedral oligomeric silsesquioxane poly(carbonate-urea) urethane scaffolds, previously sterilised by autoclaving, at a density of 3.31 ×10⁶ cells/ml and 6.37 ×10⁶ cells/ml for the porcine epithelial cells and porcine fibroblasts, respectively.
Cell proliferation and viability
The metabolism of cells seeded onto the surface of each scaffold was quantified via AlamarBlue assay (ThermoFisher Scientific) at selected time-points: days 1, 3 and 7 post-seeding. These time-points were chosen to coincide with significant patterns in cell proliferation described in the literature.Reference Divieto and Sassi25
AlamarBlue reagent 15 μl was added to each sample-containing well of a 96-well culture plate to form a 10 per cent AlamarBlue and medium solution (v/v). The culture plate was incubated for 4 hours, after which the 150 μl AlamarBlue solution supernatant was aspirated and transferred to a fresh, tin-foil wrapped, 96-well culture plate. Fluorescence was measured using a Fluoroskan Ascent FL fluorescence microplate reader (Thermo Labsystems, Beverly, Massachusetts, USA) at 530 nm excitation and 620 nm emission wavelengths. Non-cell-seeded counterparts to each sample acted as controls.
Histological analysis
Histology was used to assess cell migration into perforated polyhedral oligomeric silsesquioxane poly(carbonate-urea) urethane. Non-porous, porous, non-perforated and perforated scaffolds were transferred to a 96-well cell culture plate, and cells were cultured on the scaffolds for 13 days. The samples were then fixed overnight in 100 per cent formaldehyde, for embedding, sectioning and staining.
The samples were then transferred to individual histocassettes (Sakura, Torrance, California, USA) and fixed in 10 per cent neutral buffered formalin (4 per cent final formaldehyde), in closed pots, for 24 hours at room temperature. The neutral buffered formalin was removed and replaced with phosphate-buffered saline, and the samples stored at 4°C until ready for processing.
Processing to paraffin wax was conducted in an Excelsior AS automated tissue processor (Thermo Scientific, Loughborough, UK), using a standard overnight programme. The samples were dehydrated using six grades of ethanol and four grades of xylene, before being infused with paraffin wax (Sakura). They were then cut in half using a scalpel and each half embedded, in a cut surface down orientation, in individual paraffin blocks, using a Leica EG1140 H embedding station (Leica Biosystems, Buffalo Grove, Illinois, USA). The first block of each half was then used to cut (without trimming) 2 × 4 ribbon sections using a Leica RM2135 microtome and Sakura blades. After using a heated water bath to elongate, and non-coated glass slides, sections 1–3 and 4–7 were placed on two individual slides, and stained with haematoxylin and eosin using a Leica Autostainer XL, employing a standard run protocol.
The stained slides were then scanned at ×40 magnification using a NanoZoomer NDP system (Hamamatsu Photonics, Hamamatsu, Japan), and displayed using NDP.view 2 software (Hamamatsu Photonics). They were also viewed under an inverted microscope (TMS-F; Nikon, Tokyo, Japan) at ×10 magnification and then imaged using Infinity Analyze software (Lumenara, Nepean, Canada).
Figure 3 depicts the main stages involved in the cellular studies.
Flowchart summarising key steps and timelines of the experiments involving cellular studies. Statistical analysis was also carried out. POSS-PCU = polyhedral oligomeric silsesquioxane poly(carbonate-urea) urethane

Statistical analysis
Statistical analyses were performed via GraphPad Prism 7 software (GraphPad Software, San Diego, California, USA). A Mann–Whitney U test, Kruskal–Wallis test with Dunn's correction for multiple comparisons where relevant, or a two-way analysis of variance with Sidak's multiple comparisons test where relevant, were used to analyse data for statistical significance. Statistical significance was considered as a p-value of less than 0.05.
Results
Characterisation
Here we describe the characterisation of porous polyhedral oligomeric silsesquioxane poly(carbonate-urea) urethane. Table 1 describes the samples used in the various experiments.
Description of polyhedral oligomeric silsesquioxane poly(carbonate-urea) urethane samples used in the various experiments

N/A = not applicable
Surface wettability
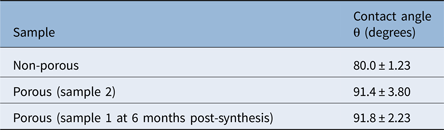
Porous scaffolds demonstrated an increase in contact angle that was statistically insignificant, and which only changed minimally six months following synthesis (Table 2).
Contact angle testing on non-porous and porous unperforated scaffolds

Data represent means ± standard deviation
Scanning electron microscopy
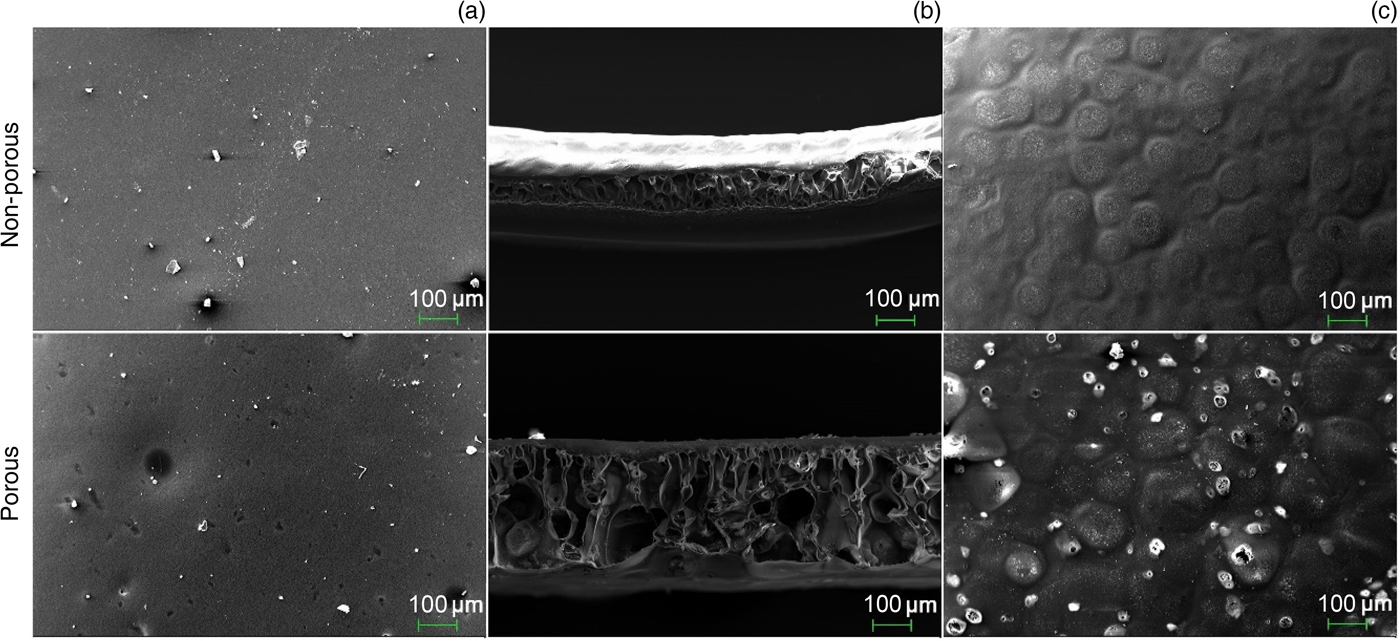
A scanning electron microscope was used to image the volar, dorsal and cross-sectional surfaces of the unperforated scaffolds (Figure 4). These included non-porous, porous and porous at six months post-synthesis samples.
An impermeable ‘skin’ was present on the dorsal and volar surfaces of the scaffolds (Figures 4a and 4c), with an inner substructure consisting of a network of interconnected pores in cross-section (Figure 4b). Whilst the dorsal surface was smooth (Figure 4a), the volar surface had a ‘cobblestone’ appearance (Figure 4c). The non-porous sample had no holes, whereas the porous sample bore a number of sporadic, irregularly shaped holes that varied in size. The holes found on the volar surface had the appearance of a ‘burst bubble’, whilst those on the dorsal edge were crater-like and did not appear to provide access to the porous substructure. No morphological differences were observed between porous scaffolds synthesised six months apart.
Scanning electron microscope micrographs of the: (a) dorsal, (b) cross-sectional and (c) volar surfaces of unperforated samples derived from non-porous and porous samples. Magnification ×250 in all cases.

Altered surface topography
Figure 5 demonstrates the changes in polyhedral oligomeric silsesquioxane poly(carbonate-urea) urethane surface topography as a result of the mechanical and laser techniques. These are discussed in greater detail below.
Field emission gun scanning electron microscope micrographs depicting surface topography changes induced by (a) the mechanical method (magnification ×700) and (b) the laser technique (magnification ×150).

Field emission scanning electron microscopy
Images were taken of the volar, dorsal and cross-sectional surfaces of the polymer scaffolds subjected to the laser and mechanical techniques (Figure 6). The morphology of these scaffolds correlated well with that of the non-perforated samples imaged previously (Figure 4).
Field emission gun scanning electron microscope micrographs taken on the day of perforation (day 0). These compare scaffolds that underwent (a–c) the mechanical and (d–f) laser techniques. Magnification ×50.

Perforations were not visible on any of the scaffold surfaces that underwent the mechanical method (Figures 6a–c). Crushing of the substructure did not appear to have taken place, even at the higher force (Figure 6b). At higher magnification, modification of the surface topography was visible, becoming more textured and effectively increasing the surface area (Figure 6c).
Both porous and non-porous scaffolds that had undergone the laser technique exhibited ovoid-shaped perforations, which had penetrated through the entire thickness of the polymer (Figure 6d). In terms of organisation, the laser-cut holes were arranged in an orderly fashion (Figure 6f) and mean inter-perforation spacing was approximately 1.4 mm. The diameter of the laser-cut holes, on the other hand, was variable, with holes appearing wider on the surface and narrowing as they tapered down into the polymer (Figures 6f and 6d). The exit hole at the base had an everted edge (Figure 6e).
Micro computed tomography images
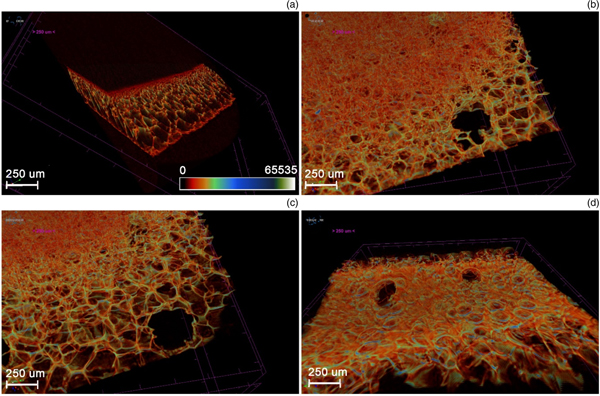
Micro CT images were taken of the porous, unperforated and laser-perforated scaffolds (Figure 7). All images in this section are represented by a colour bar, with a scale from white (65535 – low density) to black (0 – high density). Figure 7a highlights the impermeable ‘skin’ on the dorsal and volar aspects of the unperforated polyhedral oligomeric silsesquioxane poly(carbonate-urea) urethane scaffolds. This denser material appears dark red or black.
Micro computed tomography images showing: (a) an oblique cross-section through an unperforated, porous polyhedral oligomeric silsesquioxane poly(carbonate-urea) urethane scaffold; and progressive longitudinal sections through a porous scaffold, laser-perforated at (b & c) intensity 6 and (d) intensity 3. Sections are taken from the volar (left) to dorsal (right) aspects.

Micro CT images of the scaffolds that underwent the laser technique showed surface perforations at regularly spaced intervals. Figures 7b and 7c exhibit two laser perforations made at intensity 6. These show the inner walls of the perforations and how they allow access to the interconnected porous substructure of the scaffold. The perforations appear to have an everted edge on the dorsal surface (Figure 7d) of the polymer.
Figure 7b shows that even at the higher intensity setting (of 6), the laser did not cauterise and seal off the inner walls of the perforations.
Micro computed tomography data
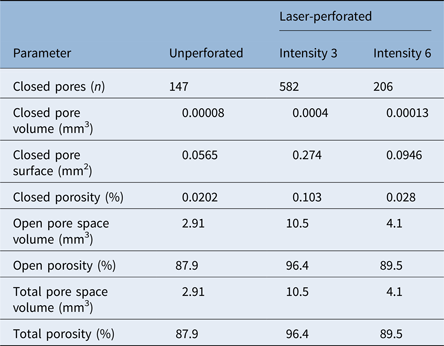
Micro CT was also used to generate quantitative data, comparing the porosity of the unperforated and perforated, porous scaffolds (Table 3). As expected, the porous, laser-perforated scaffolds exhibited values of total porosity and open porosity that were greater than those of the unperforated, porous sample. Porous polyhedral oligomeric silsesquioxane poly(carbonate-urea) urethane perforated at intensity 3 achieved a higher total porosity in comparison to that perforated at intensity 6. However, it also demonstrated a higher closed porosity value. This shows that whilst the scaffolds which were laser-perforated at intensity 3 had a higher total porosity, these pores were not as well connected as those of the scaffolds perforated at intensity 6, giving rise to a higher number of closed pores. Our porosity data also highlighted that closed porosity only forms a relatively low percentage of total porosity.
Pore analysis data obtained via micro computed tomography*

* Comparing unperforated, porous polyhedral oligomeric silsesquioxane poly(carbonate-urea) urethane, with porous polyhedral oligomeric silsesquioxane poly(carbonate-urea) urethane perforated at laser intensities 3 and 6
Cellular compatibility
Cell proliferation
Figure 8 illustrates the metabolic activity patterns produced following cell seeding of non-porous, porous, unperforated and laser-perforated scaffolds.
Unperforated scaffolds demonstrated an immediate and overall decline in metabolic activity, for both porous and non-porous samples, showing that the unperforated scaffolds are incompatible with cell viability. The laser-perforated, non-porous samples also resulted in an overall decrease in cell metabolic activity, particularly between days 3 and 7. In contrast, perforated, porous polyhedral oligomeric silsesquioxane poly(carbonate-urea) urethane scaffolds demonstrated an increase in metabolic activity between days 3 and 7, which was more pronounced for those perforated at laser intensity 6.
Trends in metabolic activity of porcine epithelial cells and fibroblasts seeded onto polyhedral oligomeric silsesquioxane poly(carbonate-urea) urethane scaffolds over days 1, 3 and 7. The graphs compare (a) unperforated, non-porous; (b) laser-perforated (intensities 3 (■) and 6 (▲)), non-porous; (c) unperforated, porous; and (d) laser-perforated (intensities 3 (●) and 6 (■)), porous. In all cases, error bars represent standard error of the mean (n = 3). a.u. - Arbitrary Units.

Histology
Haematoxylin and eosin staining of sections taken from cell-seeded scaffolds confirmed the presence of cells in and around the scaffolds (Figure 9). Cells were seen to be adherent to the scaffold surface. Figures 9a and 9b show cells and debris within large depressions in the scaffold surface, representing cells located inside laser perforations. Furthermore, cells were seen within large pores, located within the scaffold's substructure, indicative of cellular migration into the scaffold (Figure 9c).
Images taken from stained sections of polyhedral oligomeric silsesquioxane poly(carbonate-urea) urethane scaffolds seeded with cells. (a & b) Cells, indicated by arrows, and debris present within depressions in the scaffold's surface. (c) Cells located within the scaffold's porous substructure (arrow) with no obvious mode of entry, indicating migration into scaffold. (d) Cells visible adjacent to the scaffold (arrow) but not within porous substructure, indicating that unperforated scaffolds are not conducive to intra-scaffold cell migration. Images (a) and (c) were taken using a NanoZoomer NDP system and displayed using NDP.view 2 software; images (b) and (d) were taken using a TMS-F microscope and imaged using Infinity Analyze software. (H&E; ×10)

Images of sections with no surface perforations showed the presence of cells adjacent to the scaffold but not within it. Figure 9d shows that when scaffolds with no obvious perforations were seeded with cells, no cells were seen to have entered into the scaffold's porous substructure.
Young's modulus
Figure 10 demonstrates Young's moduli of non-porous, porous, unperforated and perforated polyhedral oligomeric silsesquioxane poly(carbonate-urea) urethane scaffolds. The non-porous polymer showed the lowest stress and the highest strain at break, and the lowest Young's modulus. The incorporation of porogen to form the porous scaffolds also increased the Young's modulus of the material. However, comparing porous scaffolds synthesised six months apart demonstrated a reduction in Young's modulus with time.
Young's moduli of: (a) unperforated non-porous, porous (sample 1) and porous at 6 months post-synthesis (sample 2) specimens; (b) porous and non-porous samples that underwent the mechanical technique at two forces (2.6 N and 5.2 N) and laser perforation at two intensities (3 and 6) on day 0; and (c) porous and non-porous samples that underwent the mechanical technique at two forces (2.6 N and 5.2 N) and laser perforation at two intensities (3 and 6) on day 15. Error bars represent standard error of the mean for all samples (n = 5).

Surface modification by the laser and mechanical techniques further increased Young's modulus. By day 15, all laser-perforated samples showed a reduction in Young's modulus. This reduction was noticeably greater for the porous samples. The scaffolds that underwent mechanical modification at a force of 2.6 N also showed a reduction in Young's modulus by day 15, whereas those modified at a force of 5.2 N demonstrated an increase.
Narrowing of perforations with time and incubation
A field emission gun scanning electron microscope at higher magnification (Figure 11) was used to obtain more detailed images of the laser-perforated, porous scaffolds at both intensities. Perforations were observed to be ovoid in form but irregularly shaped.
Field emission gun scanning electron microscope micrographs of laser-cut perforations and measurement of their diameter at two time-points, as follows: (a) day 0, intensity 3; (b) day 0, intensity 6; and (c) day 15, intensity 3 (magnification ×150). (d) Comparison of mean perforation diameter of laser-cut holes at days 0 and 15. Mean diameter at day 15 (301.6 ± 14.0 μm) is less than that at day 0 (339.8 ± 14.5 μm). Error bars represent standard error of the mean.

Figure 11d shows changes in perforation diameter, taken from samples on days 0 and 15. These were used to investigate changes in morphology caused by the polymer's stress relaxation behaviour that results in the decrease of perforation diameters over time. The findings demonstrated a reduction in mean diameter (339.8 μm ± 14.5 to 301.6 μm ± 14.0) over a 15-day period. The morphology of the perforations changed from ovoid to more circular in shape during the relaxation.
Discussion
The development of scaffolds with material characteristics that support very different internal and external environments and biological demands, such as epithelialisation, would represent a step-change in our ability to reconstruct hollow organs, such as the larynx and oesophagus. The implantation of such scaffolds may attain an increased success rate by ensuring: little or no difference between the Young's modulus of the scaffold and that of the native tissue, adequate cellular adhesion, angiogenesis, and tissue integration into the porous scaffold.Reference Nayyer, Birchall, Seifalian and Jell26 Whilst one of the major aims of polyhedral oligomeric silsesquioxane poly(carbonate-urea) urethane scaffolds in tissue engineering of hollow viscera is that of maintaining structural supportReference Hamilton and Birchall9 and barrier function,Reference Horst, Madduri, Milleret, Sulser, Gobet and Eberli27 another is to promote tissue and vascular regeneration.Reference Loh and Choong18, Reference Hamilton, Bullock, Macneil, Janes and Birchall19 Optimising the material's internal and surface porosity can encourage this process, thus aiding cell migration into the scaffold substructure to improve clinical delivery. Here, we describe the introduction of surface pores to coagulated polyhedral oligomeric silsesquioxane poly(carbonate-urea) urethane scaffolds and discuss the effect of this modification on the polymer's properties.
• Polymeric polyhedral oligomeric silsesquioxane poly(carbonate-urea) urethane has previously shown promise as a tissue engineering scaffold
• Production of the foam elastomer polymer involves phase separation, resulting in a non-porous surface membrane
• This study investigated methods for perforating the polymer surface to allow cell ingress for tissue engineering airways
• The polymer surface was successfully perforated and imaged, and data showed cell attachment and migration into the scaffold
• Maintaining mechanical efficiency, whilst creating a microenvironment that encourages cell migration, is key to the polymer's clinical application as a laryngeal scaffold
Prior to perforating the surface of polyhedral oligomeric silsesquioxane poly(carbonate-urea) urethane, we confirmed that the addition of porogen to produce the porous polymer did not significantly affect its surface wetness, which implies that it did not alter surface chemistry. Using scanning electron microscopy, we demonstrated that porous polyhedral oligomeric silsesquioxane poly(carbonate-urea) urethane has improved internal porosity, which is an important characteristic, as successful in vivo cell and tissue growth, upon transplantation, are reliant on this.Reference Crowley, Klanrit, Butler, Varanou, Plate and Hynds28 Our scanning electron microscope images also showed that although the porous scaffolds possess open surface pores, these are small and sporadic. Such pores are therefore unlikely to substantially increase the ability of cells to migrate into the scaffold because large cells, such as fibroblasts (50–100 μm), are unable to pass through a smaller gap.Reference Murphy and O'Brien29 Previous studies indicate that pores of 40–600 μm offer optimal conditions for capillary angiogenesis into scaffolds.Reference de Mel, Punshon, Ramesh, Sarkar, Darbyshire and Hamilton30 Altering polyhedral oligomeric silsesquioxane poly(carbonate-urea) urethane surface topography to increase the number and size of pores is therefore desirable.
Using the laser technique, we succeeded in creating surface pores on polyhedral oligomeric silsesquioxane poly(carbonate-urea) urethane, whilst simultaneously increasing its internal porosity using porogen. We confirmed that laser cutting succeeded in creating pores without cauterising the surface of the inner walls, and which penetrated through the entire thickness (approximately 300 μm) of the scaffold. This provided a conduit, connecting the polymer surface to the porous substructure. Additionally, micro CT scans confirmed that the pores, now open to the external environment, did indeed connect freely with the internal, porous substructure of the scaffold. Porosity is known to be critical to successful scaffold application and functionality.Reference Loh and Choong18
Whilst the lower-intensity laser technique demonstrated the highest total porosity (96.4 per cent), polyhedral oligomeric silsesquioxane poly(carbonate-urea) urethane scaffolds perforated at the higher intensity still achieved a near-optimal total porosity of 89.5 per cent, necessary for cell seeding and ingrowth.Reference Freyman, Yannas and Gibson31 However, porosity is not the only consideration when addressing scaffold design. Cellular migration, the circulation of extracellular nutrients and cell signals are all augmented by pore interconnectivity.Reference Liebschner32 Notably, we showed that the laser-perforated, porous polyhedral oligomeric silsesquioxane poly(carbonate-urea) urethane network displayed excellent interconnectivity, with the percentage of closed porosity representing only a minimal fraction of the overall porosity. Furthermore, we demonstrated that polyhedral oligomeric silsesquioxane poly(carbonate-urea) urethane perforated at the higher intensity had a lower number of closed pores, whilst that perforated at the lower intensity had the highest degree of closed porosity. Therefore, despite not achieving higher total porosity, the higher laser intensity could produce the more desirable scaffold design.
Although high porosity facilitates biofactor release and enhances nutrient exchange,Reference Loh and Choong18 it often comes at the expense of the structural stability of the polymer.Reference Hollister13 This is a major challenge in tissue engineering of hollow organs, as they must possess the mechanical strength and rigidity to withstand intra-operative handling and in vivo loadingReference Freyman, Yannas and Gibson31 and to prevent collapse.Reference Hendow, Guhmann, Wright, Sofokleous, Parmar and Day33 An optimal laser intensity would therefore be one that achieves a near-ideal porosity, with a high level of connectivity, but with minimal compromise of the scaffold's structural integrity. Our work opened up interesting avenues for further research using different laser intensities, aiming for an ideal balance between these factors. It would also be useful to investigate which would be the more ideal mean pore size to achieve. Whilst pores that are too small restrict cell migration, pores that are unnecessarily large decrease the scaffold's surface area, thereby limiting cell adhesion.Reference Murphy, Haugh and O'Brien34
As cell numbers affect cell confluency, which in turn influences the cell differentiation process,Reference Grayson, Bhumiratana, Cannizzaro, Chao, Lennon and Caplan35 we used cell proliferation studies to obtain preliminary data appraising whether perforating the impermeable surface of polyhedral oligomeric silsesquioxane poly(carbonate-urea) urethane would improve cell migration into the scaffold's substructure, reflected by an increase in cell numbers and metabolic activity.Reference O'Brien, Wilson, Orton and Pognan36 Our data showed a marked contrast between the metabolic activity patterns exhibited by perforated and unperforated polyhedral oligomeric silsesquioxane poly(carbonate-urea) urethane scaffolds. The latter showed a steady decrease in metabolic activity, suggesting a reduction in total cell numbers or in their metabolic rates, for instance due to quiescence. This supports the premise that the unperforated polymer surface is not optimal for cell viability because of a reduced capacity for cells to enter the scaffold. Notably, unperforated scaffolds, whether porous or non-porous, gave similar results, reinforcing that it is the lack of access to the porous substructure which is the limiting factor for cellular proliferation and possible epithelialisation. Additionally, metabolic activity for perforated but non-porous scaffolds fell to levels below those achieved by their porous counterparts, highlighting that internal porosity is also critical for cell viability.
The laser-perforated, porous scaffolds demonstrated patterns of metabolic activity against time which are generally compatible with those reported in literature.Reference Divieto and Sassi25, Reference Grayson, Bhumiratana, Cannizzaro, Chao, Lennon and Caplan35 Divieto and SassiReference Divieto and Sassi25 used highly porous Biocoral® scaffolds with well-connected pores, which presented no obstacle to cell migration. We used similarly sized scaffolds and densities of 3.63 ×10⁵ cells per scaffold. From Divieto and Sassi's study, it appears that cells seeded at low densities grow consistently, whilst those seeded at densities higher than 1.0 ×10³ cells per scaffold (as in this study) fluctuate over time. A large number of cells are able to fill pore spaces rapidly but then decrease proliferation rate as a result of cell-contact inhibition. This ‘lag phase’ is followed by an increase in metabolic activity, as cells fill a new pore and proliferate.Reference Divieto and Sassi25 Our results reflected this pattern. We therefore inferred that laser-perforated, porous polyhedral oligomeric silsesquioxane poly(carbonate-urea) urethane was able to support viable cell growth, in contrast with unperforated controls. Further investigations, such as cell proliferation and differentiation studies, would be required to confirm this.
An interesting facet of this study was the comparison of the effects of the two laser intensities used. The porous scaffolds perforated at the higher laser intensity demonstrated a steeper increase in metabolic activity compared to the lower intensity. This indicates a faster rate of proliferation, correlating with the increased interconnectivity achieved at the higher intensity discussed earlier. This reinforced our premise that a more ideal scaffold is produced by the higher laser intensity.
Perforated polyhedral oligomeric silsesquioxane poly(carbonate-urea) urethane histology showed cells adherent to the scaffold surface, illustrating that cells seeded onto the scaffold were able to attach to its surface and remain viable, rather than undergo anoikis. Importantly, our results also showed cells aggregated within perforations and infiltrated into the polymer. These findings show that cells aggregate in large perforations, and demonstrate that perforating the surface of polyhedral oligomeric silsesquioxane poly(carbonate-urea) urethane facilitated cellular infiltration into the scaffold. In contrast, the absence of perforations was accompanied by an absence of cells within the scaffold. This emphasises that perforating the surface of polyhedral oligomeric silsesquioxane poly(carbonate-urea) urethane encourages cell migration, instigating increased tissue ingrowth in vivo, which is crucial for angiogenesis and the interlocking of the scaffold with the native tissue.Reference Loh and Choong18 Further work on epithelialisation would be necessary, as prompt re-epithelialisation is an important factor for optimal wound healing,Reference Guo and DiPietro37 which in turn reduces the incidence of infection.Reference Pastar, Stojadinovic, Yin, Ramirez, Nusbaum and Sawaya38 Moreover, epithelial tissue forms the inner lining of hollow organs such as the larynx, where it is important for effective barrier functionality and for maintaining homeostasis.Reference Coraux, Nawrocki-Raby, Hinnrasky, Kileztky, Gaillard and Dani39, Reference Vrana, Lavalle, Dokmeci, Dehghani, Ghaemmaghami and Khademhosseini40 It is known that, at present, untreated, synthetic scaffolds are not well suited to support epithelialisation.Reference Lutolf and Hubbell41
Cell adhesion is an essential preliminary step to subsequent proliferation,Reference Anzlovar, Kogej, Orel and Zigon42 and an ideal scaffold should therefore promote a high level of cell attachment in addition to optimal scaffold infiltration. The inverse relationship between pore size for cell migration and the surface area available for cell attachment is well-documented.Reference Ma, Kotaki, Inai and Ramakrishna43, Reference Karageorgiou and Kaplan44 Whilst the mechanical method did not appear to have perforated the surface of polyhedral oligomeric silsesquioxane poly(carbonate-urea) urethane, it did alter its topography, effectively increasing its surface area. An interesting, synergistic way forward may be to combine both laser and mechanical methods, to maximise their potential. In this way, the mechanical technique may increase surface area to redress that lost by laser perforation. The mechanical method did not result in crushing of the porous substructure, calling for further investigation at higher forces.
Synthetic polymers have the advantage of possessing reproducible and precise mechanical and physical properties.Reference Chen, Bretcanu, Boccaccini, Chu and Liu45 These include tensile strength and elastic modulus, both of which are important scaffold characteristics for intra-operative handling and cellular differentiation.Reference Engler, Sen, Sweeney and Discher46 Polyhedral oligomeric silsesquioxane poly(carbonate-urea) urethane has been found to be superior to other synthetic materials in terms of its mechanical properties and elastic modulus.Reference Anzlovar, Kogej, Orel and Zigon42 It also has the potential to be modified to produce an elastic modulus more closely simulating that of native tissue.Reference Nayyer, Birchall, Seifalian and Jell26 The larynx presents a challenge in tissue engineering because it possesses different components with different mechanical properties. Our data showed that the addition of porogen raises Young's modulus (non-porous, unperforated = 1.20; porous, unperforated = 1.77), and this is further elevated by laser perforation (porous, laser-perforated, intensity 6 = 1.86; porous, laser-perforated, intensity 3 = 2.38) to more closely resemble that of human cadaveric cricoid cartilage (Young's modulus = 2 ± 0.9), as established by Baiguera et al.Reference Baiguera, Gonfiotti, Jaus, Comin, Paglierani and Del Gaudio47
Importantly, we showed that this increase in Young's modulus reverses with time, decreasing substantially over a 15-day period. We also demonstrated that when polyhedral oligomeric silsesquioxane poly(carbonate-urea) urethane scaffolds were incubated at 37°C (simulating in vivo conditions) the average pore diameter contracted by just over 11 per cent over a 15-day period, correlating with the diminishing Young's modulus observed over time. The perforation morphology also changed from an ovoid to a more circular appearance. These findings may be explained by a relaxation of the polymer caused by incubation conditions or by the polymer's innate elastic properties. The result is narrowing of the perforations with time. A diminishing surface pore size could have a detrimental effect on cell infiltration into the scaffold, as small pores restrict cell migration leading to the development of cell aggregates. These form a cellular skin around the scaffold surface that effectively limits the diffusion of nutrients and waste material, producing necrotic areas within the scaffold.Reference Murphy and O'Brien29, Reference Murphy, Haugh and O'Brien34
The changes observed in Young's modulus and perforation diameter are critical as they affect the scaffold's physical properties. A native tissue–scaffold mismatch in mechanical properties has been proposed in the literature as a negative prognostic factor for scaffold integration.Reference Asawa, Sakamoto, Komura, Watanabe, Nishizawa and Takazawa48 It may also further contribute to the formation of granulation tissue at the anastomotic site.Reference Maughan, Butler, Crowley, Teoh, Hondt and Hamilton49 This raises important questions regarding how time, and the conditions to which polyhedral oligomeric silsesquioxane poly(carbonate-urea) urethane is subjected, affect its properties. An important goal of tissue engineering is ‘off-the-shelf’ availability, which is a major advantage of synthetic scaffolds. It is therefore important to consider how our findings relate to the ‘shelf-life’ of polyhedral oligomeric silsesquioxane poly(carbonate-urea) urethane scaffold, and to the conditions under which it should be stored, as well as potential post-implantation issues, all of which are of paramount importance to the translatability and clinical application of polyhedral oligomeric silsesquioxane poly(carbonate-urea) urethane.
Conclusion
Our findings demonstrate that besides internal porosity and interconnectivity, surface perforations are critical in influencing cell behaviour in polyhedral oligomeric silsesquioxane poly(carbonate-urea) urethane scaffolds. Initial cell seeding density also affects cell proliferation patterns. Future research should address the possibility of correlating these parameters with resultant cell numbers. In addition to using porogen, perforation of the polyhedral oligomeric silsesquioxane poly(carbonate-urea) urethane surface can be utilised to encourage migration and proliferation under controlled conditions. Furthermore, the properties that perforations lend to the scaffold could lead to improved anchorage to the native tissue, which, by decreasing the possibility of implant dislodgement, may increase the likelihood of successful and complication-free post-operative outcomes for future patients receiving hollow organ implants.
Acknowledgements
The authors would like to thank: Dr Angela Tait, Dr Toby Proctor and the staff at the Royal Free Hospital Laboratory of Cellular Therapeutics, for providing some of the laboratory resources and facilities for this study; Mr Mark Hopkinson at the Royal Veterinary College, for his assistance with micro CT imaging and data analysis; the staff at the Pathology Core Facility Service, University College London, for assistance with histology; Mr Mark Turmaine, for assistance with scanning electron microscopy; and Dr Hazel Welch and the staff at the Division of Surgery, for helpful discussion and guidance. This work was financially supported by the Medical Research Council (grant number MR/K026453/1), and the Division of Surgery and Interventional Science, University College London.
Competing interests
None declared