1. Introduction
Loss of forest biomass through deforestation and forest degradation makes up 12–20 per cent of annual greenhouse gas emissions (van der Werf et al., Reference van der Werf, Morton, DeFries, Olivier, Kasibhatla, Jackson, Collatz and Randerson2009; Saatchi et al., Reference Saatchi, Harris and Brown2011), which is more than all forms of transport combined. Virtually all net deforestation occurs in developing countries, with an estimated net carbon source from tropical land use change of 2.4 ± 0.4 gigatons (Gt) per year (Pan et al., Reference Pan, Birdsley and Fang2011). Total carbon stored in forests is estimated at 638 Gt (UNFCCC, 2011), with about 80 per cent stored above ground (Saatchi et al., Reference Saatchi, Harris and Brown2011). For comparison, total carbon emissions by humans since the industrial revolution began are estimated to be approximately 375 Gt (IPCC, 2013).
As of July 2015 there have been 20 conferences of the parties to the UN Framework Convention on Climate Change (UNFCCC), which have sought to curb global warming, but international negotiations are generally considered to have yielded little agreement and fewer results. As a consequence, atmospheric carbon concentrations continue to rise and in 2011 increased approximately 3 per cent (Gillis and Broder, Reference Gillis and Broder2012).
There has been agreement, however, on the need to reduce emissions from deforestation and forest degradation in developing countries. Beginning with COP 13, held in Bali, Indonesia in 2007, there has been an increasing focus on developing country forest-related sequestration and emissions. Resources have been assembled to support forest management programs, including the World Bank Forest Carbon Partnership Facility (FCPF) and UN-REDD, which is a UN-implemented initiative funded by the Government of Norway.
The idea behind REDD+ is to provide financial and technical support to developing countries so they can reduce forest biomass loss and sequester more carbon. This definition includes forest restoration, rehabilitation, sustainable management and/or af/reforestation, which means that countries with low rates of deforestation and degradation or increasing forest stocks will be able to participate in REDD+. REDD+ is therefore more than just avoided deforestation; it includes measurable and verifiable emissions reductions from deforestation and forest degradation, as well the as sustainable management of forests and the conservation and enhancement of forest carbon stocks (UN-REDD, Reference UN-REDD2010).
Using household and community data from 22 communities in four regional states in Ethiopia, we provide one of the few – but still preliminary – assessments of whether institutions managing community forests (CFs) with high levels of measured collective action (CA) have more carbon than less well coordinated systems. CFs are an example of a natural resource institution and set of property rights – formal, informal, written or unwritten – over forestsFootnote 1 that are vested in groups of people. A CF is an example of common property that is intermediate between private property, where rights and responsibilities are with individuals, households and firms, and state property where rights and responsibilities are vested in governments.
The link between better CF CA, carbon sequestrationFootnote 2 and carbon stocks runs through forest quality. Better quality forests have more biomass, because reduced fuelwood, timber and fodder collections reduce pressures on forests, allowing them to regenerate and retain carbon. Better management is what drives these results and in community settings is potentially the result of more effective CA.
As yet, however, there is little empirical evidence on whether CA institutions are right now helping to mitigate climate change. A partial exception to the general lack of evidence is Chhatre and Agrawal (Reference Chhatre and Agrawal2009), who examine tradeoffs between climate and forest livelihood benefits. Using a worldwide data set, they conclude that in general carbon sequestration and the extraction of subsistence products (measured using an index derived from factor analysis) are complementary. One of the key conclusions, though, is that more detailed analysis is needed.
Our paper builds on and extends the approach of Chhatre and Agrawal (Reference Chhatre and Agrawal2009) by incorporating detailed estimates of forest areas, supported by on-the-ground measurements and combined with more comprehensive and nuanced CF CA attributes that are well established in the literature (e.g., Ostrom, Reference Ostrom1990, Reference Ostrom2000, Reference Ostrom2009; Agrawal, Reference Agrawal2001; Agrawal et al., Reference Agrawal, Chhatre and Hardin2008; Shyamsundar, Reference Shyamsundar, Ghate, Jodha and Mukhopadhya2008). Using 14 specific measures of CF CA elements, we explicitly incorporate the multi-dimensionality and continuity of such institutions that are an important part of the contemporary economics literature (e.g., Agrawal et al., Reference Agrawal, Chhatre and Hardin2008; Bluffstone et al., Reference Bluffstone, Boscolo and Molina2008; Mekonnen and Bluffstone, Reference Mekonnen and Bluffstone2008).
Using 2009 data from the four main forested regions in Ethiopia, we find that CFs with higher levels of CA have only marginally more carbon than CFs managed with lower levels of CA. Based on these results, we conclude that if CFs are to play key roles in climate change mitigation, specific incentives such as those from REDD+ are needed.
To continue our examination of CFs and REDD + , in section 2 we provide a very brief discussion of the literature at the intersection of REDD+ and CFs. We discuss the causes of deforestation and the role of CA in Ethiopia in section 3. In section 4 we discuss our analytical framework, data and our empirical and identification approaches. Findings and discussion are presented in section 5. Section 6 draws key conclusions, discusses policy implications and highlights the many important areas for further work.
2. Literature on community forests and REDD+
Understanding the role of CFs in climate change mitigation is important, because perhaps 25 per cent of developing country forests are under some type of community control (World Bank, Reference Bank2009; Rights and Resources Initiative, Reference Initiative2014) and the portion in low-income countries is no doubt much higher. If developing country forests are a key source of greenhouse gas emissions and CFs are about a quarter of developing country forests, it is difficult to imagine addressing climate change without bringing CFs into REDD+.
Secondly, in most low-income developing countries, forests provide a variety of products that are essential to daily life, including fuelwood, forest fruits and vegetables, building materials and animal fodder (Cooke et al., Reference Cooke, Köhlin and Hyde2008). It is also true, though, that the livelihood potential of CFs has yet to be adequately tapped, because so many forest ecosystem services are non-marketed. A key challenge is therefore to generate value from forestlands without overharvesting timber or converting to other uses, such as agriculture and pasture (Hyde et al., Reference Hyde, Amacher and Magrath1996). Leveraging forests to improve economic conditions has proved to be difficult and REDD+ represents a potentially important, but also possibly risky, way to increase the incomes of forest-dependent people in the developing world.
The dependence of rural households on forest resources for fuelwood also potentially has critical climate change ramifications. For example, over two billion people around the world cook with biomass on a regular basis and most of this comes from forests (MacCarty et al., Reference MacCarty, Ogle, Still, Bond and Roden2008). Although fuelwood is in principle carbon neutral, this is not true if harvests are unsustainable. UNFCCC (2012) uses 88 per cent as the default percentage of non-renewable biomass in Ethiopia. The black carbon from biomass cooking and heating may also be a key contributor to climate change, although the relative emissions of aerosols and black carbon are critical to determining whether biomass cookstoves are net climate forcers (Grieshop et al., Reference Grieshop, Marshall and Kandlikar2011).
While most developing country forests are on paper government owned, since the early 1980s there has been a worldwide trend in developing countries toward various types of community control and management of forests, at least partly because privately owned and government structures have often proved infeasible. This process may take the form of devolving to communities both ownership and control or only use rights (Agrawal et al., Reference Agrawal, Chhatre and Hardin2008; Sunderlin et al., Reference Sunderlin, Hatcher and Liddle2008; Bluffstone et al., Reference Bluffstone, Robinson and Purdon2014).
A critical literature for our paper discusses the effect of CA on economic outcomes in developing countries. In general, this increasingly well-developed literature suggests that good things come from such social coordination. For example, Bouma et al. (Reference Bouma, Bulte and van Soest2008) combine experimental evidence from a trust game in India with information on households' participation in community management. They find that players that are more cooperative also engage in more pro-social community natural resource management activities. In East Africa, Nyangena (Reference Nyangena, Bluffstone and Köhlin2011) estimates that Kenyan households with higher levels of social capital also have more private on-farm investments in soil and water conservation. Narayan and Pritchett (Reference Narayan and Pritchett1999) find that higher levels of social capital are associated with more household expenditures (a key proxy for income).
Nepal et al. (Reference Nepal, Bohara and Berrens2007) look at a variety of social networks and find that forest-related institutions particularly spur on-farm tree investments. Bluffstone et al. (Reference Bluffstone, Boscolo and Molina2008) and Mekonnen and Bluffstone (Reference Mekonnen and Bluffstone2008) use related approaches and estimate that CF CA is associated with more on-farm tree planting that provides products substituting for those from forests. They also find that CF CA attributes are viewed by households as packages rather than individually.
Most evidence on the effects of CF CA on forest quality comes from case studies. In general, though, this literature suggests that CA is associated with better quality forests with more biomass. For example, Ellis and Porter-Bolland (Reference Ellis and Porter-Bolland2008) find that in their study sites in Mexico community management is a better forest conservation institutional structure than state-enforced protection. Gautam et al. (Reference Gautam, Webb and Eiumnoh2002) analyze the effect of formal handover of forests to communities in a 543 km2 watershed in Nepal during 1978–1992. They find that villages with formal handover had better quality forests.
As in this paper we attempt to measure CF CA, an important related literature focuses on CA attributes and principles. This extensive body of work suggests that effective CA systems contribute to better natural resource management (Shyamsundar, Reference Shyamsundar, Ghate, Jodha and Mukhopadhya2008) when they empower communities, have clear access and extraction rules, fair and graduated sanctions, public participation, clear quotas and successful monitoring (Ostrom, Reference Ostrom1990; Agrawal, Reference Agrawal2001). Recent work also emphasizes the need to analyze the details of CA rather than treat it as a binomial variable (Jodha, Reference Jodha, Ghate, Jodha and Mukhopadhya2008; Shyamsundar, Reference Shyamsundar, Ghate, Jodha and Mukhopadhya2008; Agarwal, Reference Agarwal2010).
Linking CFs and REDD+ is seen by many as a natural extension of the worldwide trend toward forest devolution and the development of regional and voluntary carbon markets (e.g., Peskett et al., Reference Peskett, Huberman, Bowen-Jones, Edwards and Brown2008). For example, the Regional Community Forest Training Center in collaboration with the Global Alliance for Community Forestry notes that ‘Community-based forest management provides a sound framework through which REDD can provide financial and livelihood benefits to forest-dependent communities and indigenous peoples, by acknowledging their essential role in the long-term, sustainable management of forest ecosystems’ (RECOFT, 2008). Skutsch and McCall (Reference Skutsch and McCall2012) indeed assert that improved CF CA can play a particularly important role in dryland tropical forests, such as those found in many parts of Ethiopia.
Much of the policy literature is similarly optimistic. For example, Cronkleton et al. (Reference Cronkleton, Bray and Medina2011) echo Agrawal and Angelsen (Reference Agrawal, Angelsen and Angelsen2009) and note that REDD+ outcomes could be achieved through the adoption of CA design principles, including secure property rights and strong institutions for forest governance. There is only a very limited empirical literature, however, that specifically addresses the question of whether CFs that exhibit higher levels of CA actually sequester more carbon (Chazdon, Reference Chazdon2008).
The critical analytical challenge is to effectively identify the effects of CA on carbon stocks. We discuss our identification strategy in detail in section 4. One aspect of identification, though, is dealing with leakage. For example, people living in areas with CFs that have better CA may simply gather forest products from uncontrolled areas (Robinson and Lokina, Reference Robinson and Lokina2012). To our knowledge, no retrospective empirical studies of CFs measure and adjust for leakage. We are also unable to directly measure leakage, although the geographically broad nature of our kebele-level data makes leakage unlikely. As already noted, our contribution focuses on effectively measuring forests and better integrating CF CA elements with REDD+ in a nuanced and contemporary view of CFs.
3. Deforestation, forest degradation and collective action solutions in Ethiopia
Ethiopia currently has an estimated closed canopy forest cover of 4.6 per cent compared with a baseline of perhaps 40 per cent in the 16th century (EFAP, 1994; Tumcha, Reference Tumcha, Mengistou and Aklilu2004). During the period 1990–2010 the annual deforestation rate averaged 2 per cent per year, with total estimated forest area dropping from 15.1 million to 12.3 million ha (decline of 20 per cent). Above-ground forest biomassFootnote 3 and carbon fell by a much larger 28 per cent during the same period, however, reflecting not only deforestation, but also degradation (FAO, 2010a) by 83 per cent of the 96 million Ethiopians who live in rural areas (CIA, 2014).
Commonly noted causes of deforestation and forest degradation in Ethiopia are the demand for firewood, agricultural land and grazing land, pushed by a rapidly growing population. Although it is common to find companies extracting or destroying forests in other countries, their role in Ethiopia is insignificant. Conversion of forests, woodland and shrub land into agricultural land is the largest driver of deforestation in Ethiopia, causing an estimated 40 Mt of CO2 emissions from deforestation in 2010 (Vreugdenhil et al., Reference Vreugdenhil, Payton, Vreugdenhil, Tamirat, Nune and Weeks2011), but the problem of forest loss is greatly aggravated by grazing, fodder collection and extraction of wood for fuel, charcoal and timber (Bekele, Reference Bekele2011).
Ethiopia's energy consumption is predominately based on biomass energy sources (94 per cent). Almost all rural people depend on firewood, dung and residues to satisfy their demand for cooking, heating and lighting energy. Between 2000 and 2010, degradation due to fuelwood consumption claimed an estimated 135 million tons of woody biomassFootnote 4 and it is therefore generally believed that unsustainable consumption of fuelwood prevents forests from regenerating and negatively affects carbon sequestration.
All forests in Ethiopia are owned by the government, but the capacity of forestry institutions at federal and regional levels is very weak, so de facto management (or lack thereof) often falls to communities. Indeed, in Ethiopia there is no clearly dedicated national forestry institution (Derero et al., Reference Derero, Mamo and Kelemu2010). Recently, the Environmental Protection Agency (EPA) has been transformed into the Ministry of Environmental Protection and Forestry, which is a promising development.
As a result of weak property rights, in many areas there is de facto open access, which likely contributes to degradation and deforestation (Mekonnen and Bluffstone, Reference Mekonnen and Bluffstone2008). Community-based property rights, CA and CF management institutions have therefore recently received significant attention as a potential mechanism to confer forest property rights. Legislation, such as the Forest Proclamation of 2007, for example, has made it possible for communities to hold heterogeneous agreements with governments that grant them control over forest areas, as well as various use rights. Rights typically do not include ownership or logging, but focus instead on subsistence products like fuelwood, fodder and grazing. These agreements are known as participatory forest management (PFM) and have various mechanisms for sharing forest benefits between communities and regional governments. Available evidence suggests that PFM may offer improvements in forest management and condition, and could increase CA and rural livelihoods (Gobeze et al., Reference Gobeze, Lemenih and Kassa2009).
4. Analytical framework, data and identification approach
For resources held in common, the academic and policy literatures view higher quality CA as an important step toward improved natural resource management. The analytical framework we use is inspired by this body of knowledge, which indicates that communities with more social capital are better able to coordinate their efforts, leading to more effective CA focused on improving the quality of natural resources, higher rents and greater social welfare. We do not, however, presume such positive outcomes, but attempt to empirically test them.
The question we address is whether a product – or byproduct – of CA is more carbon sequestration, leading to larger carbon stocks that we measure. The answer is an empirical one, because there is no reason to believe that Ethiopian CFs are in any way managed for carbon, because carbon sequestration at present is completely uncompensated. It is also true, though, that carbon sequestration is highly linked to forest quality through the increased biomass that is a key part of better forest quality. The IPCC (2006) default value for carbon content in wood biomass is, for example, 50 per cent and we assume this proportion; half of all biomass – accumulated for whatever reason – is therefore carbon.
The hypothesis we test is whether forest quality due to more organized communities and more effective CA implies that rather than being over-harvested, forests are allowed to grow, producing more biomass in tree trunks, branches and leaves. It may also imply better regeneration and more canopy cover due to reduced lopping (Agarwal, Reference Agarwal2010). All these outcomes imply more carbon.
The data used for this study were collected in 2009 in the Amhara, Oromiya, Southern Nations Nationalities and People's (SNNP) and Tigray regional states. Ethiopia has a federal government system and each of the regions, with the exception of SNNP, is defined largely by ethnicity and language. Oromiya has a population of over 27 million and approximately 88 per cent are part of the Oromo ethnic group. The population of Amhara is over 90 per cent Amhara and more than 95 per cent of Tigray's population are of the Tigrayan ethnic group. SNNP, on the other hand, has over 40 nationalities, with the four most populous making up about 45 per cent of the total.
While the sample is not explicitly nationally representative, these states include all those with sufficient rainfall to support forests and stretch from Kenya to the Eritrean border. The kebeles within these regional states are chosen based on criteria such as variation in agro-ecology, forest cover and forest management.Footnote 5 Kebeles generally have approximately 700–1,200 households and in each regional state there are 17 (Harari region) to 6,349 kebeles (Oromia region). In the regions where we took our sample, the number of rural kebeles ranges from 600 (Tigray) to 6,349 (Oromia). The number of rural kebeles in Amhara and SNNP regions are 3,039 and 3,587, respectively (UNFPA, 2013).
In our sample, each kebele averages 701 households (σ = 373). This smallest administrative unit within the Ethiopian government structure – and the forests it includes – is therefore very meaningful to households and communities. To give an idea of scale, in our sample the average kebele area is 3,379 ha.
Three types of data are used in this paper. The first data are 15 m2 ASTER (Advanced Spaceborne Thermal Emission and Reflection Radiometer) satellite images purchased to identify and measure natural and plantation forests within each kebele boundary. Secondly, community characteristics were collected from secondary data sources and kebele officials. Thirdly, a household survey was conducted to collect household perceptions of CF CA, which we believe is superior to previous attempts. This survey was conducted by professional enumerators who are conversant in the many local languages (as well as Amharic, the national language), with deep experience working in rural areas in Ethiopia, but no knowledge of the actual hypotheses to be tested. We are therefore very confident that household assessments of CA, while personal, are accurate.
Kebele forest area is estimated based on analysis of satellite imagery and includes both natural and plantation (e.g., eucalyptus) forests. In Ethiopia, forests can be broadly grouped into moist and dry and we include both types. Above-ground biomass is then estimated using on-the-ground sampling of average tree height, average diameter at breast height (dbh) and species composition within each of the kebele forests. For more information on the plot sampling and carbon estimation methodologies, see the online appendix, available at http://journals.cambridge.org/EDE.Footnote 6
Our data come from 22 kebeles in four different regional states (Amhara, Oromiya, Tigray and the SNNP). These sites therefore represent a diversity of ethnic groups, population densities, forest sizes, agricultural production systems and CF CA. All 22 kebeles include forests that have some degree of management devolved to communities, but the legal meaning of and management responsibilities associated with CF devolution in Ethiopia vary widely by community. Unlike, for example, in Nepal where the Forest Act of 1993 and associated regulations include detailed requirements for officially designated CFs, in Ethiopia – as in many countries – this is not the case (Agrawal et al., Reference Agrawal, Chhatre and Hardin2008). It is therefore necessary to directly measure the details of CF CA in order to assess the overall level and effects of CA.
We normalize our carbon estimates for population (carbon per capita) and forest area (carbon per hectare) and take explicit account of forest species diversity in our biomass calculations.Footnote 7 As shown in figures A1 and A2 in the online appendix, this diversity translates into a large variance in carbon stocks. The average carbon per hectare is 21.53 tons per ha, but it ranges from 0.028 to 119.07 tons per ha.Footnote 8 Average carbon per capita is 305.38 tons, with a minimum of 0.26 tons and a maximum of 2,637 tons.
Each kebele has on average 907 ha (σ = 1, 076 ha) of forests out of an average kebele area of 3,640 ha (σ = 5, 457 ha). On average, therefore, about one-quarter of kebele area is covered by forests, but coverage ranges from 7 per cent to 64 per cent. The population density is 2.6 per ha of total kebele area, but there are on average 15.4 people per ha of forest. The sample sites are different in terms of landscape and environmental conditions. Around 50 per cent are hilly areas and 32 per cent are flatter terrain. The remaining 18 per cent are steep valleys. Forest condition is judged to be good by almost 50 per cent of respondents, although 27 per cent say their forests are minimally degraded and the remaining 23 per cent perceive forests as degraded. For grazing land, only about 34 per cent say that the current land is sufficient for their livestock needs.
Most villagers in the sample are farmers who produce cereal crops on an average of 1 ha of land. Crop production supplemented by livestock is the most common agricultural system. It is also common to produce and sell cash crops such as coffee in some sites (e.g., Omo Nada and Gimbo districts). Important food crops such as enset, sweet potatoes, taro and beans are common in southern kebeles of the sample, and crops such as maize, teff and pulses are very common in the northern Amhara and Tigray regions. As the cultivated area is on average small and productivity per ha generally low (Bluffstone and Köhlin, Reference Bluffstone, Köhlin, Bluffstone and Köhlin2011), farmers typically would like to clear forests for cultivation.Footnote 9
Based on the literature, there is reason to believe that better coordinated communities could have forests that are less subject to open access and that generate more rents. To measure CA and other covariates, we use a household survey based on systematic random sampling of 330 households randomly selected from our 22 kebeles. A total of 15 households were dropped from the analysis due to missing or incomplete data.
We measure CF CA using data on CA attributes collected from household heads. We go directly to household heads (e.g., rather than village leaders), because in developing countries on-the-ground realities often correspond poorly with policies, if any exist. There could be a number of reasons for this, including leader mis-assessments, attempts to portray local CA in positive lights (i.e., to ‘yay say’ enumerators) or simple difficulties with characterizing CA details.
Our survey focuses on a variety of CA attributes that are standard in the economics of CA literature, applied to the CF context. These attributes include fairness, clarity of access, monitoring quality and appropriate formal and informal sanctions, which are subjective and subtle aspects that households are likely to perceive much more accurately than leaders.
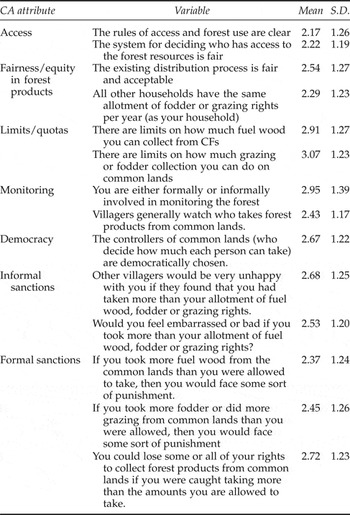
As discussed in detail in (Ostrom, Reference Ostrom1990; Ostrom, Reference Ostrom2000; Ostrom, Reference Ostrom2009) and Ostrom and Gardner (Reference Ostrom and Gardner1993), community-based social systems – like those related to CFs – are typically complicated, with often very detailed, if implicit, rules and norms. We know from this economic literature that group membership clarity, benefit sharing rules, fairness, public participation and appropriate sanctions are very important for successful CA (Ostrom, Reference Ostrom1990; Ostrom, Reference Ostrom2000; Ostrom, Reference Ostrom2009; Agrawal et al., Reference Agrawal, Chhatre and Hardin2008; Bluffstone et al., Reference Bluffstone, Boscolo and Molina2008; Shyamsundar, Reference Shyamsundar, Ghate, Jodha and Mukhopadhya2008). We capture these seven CA attributes using the 14 statements and questions presented in table 1. The attributes listed in the first column of the table are taken directly from the above literature and the survey questions in column 2 apply them to the Ethiopian CF context.
Definitions and descriptive statistics of variables used for constructing CA variable

Notes: Likert scale: 1 = completely disagree with statement, 5 = completely agree.
Table 1 presents the 14 questions/statements presented to respondents that are used to measure the detailed, implicit rules and norms that represent the specific attributes of CF CA. These questions/statements are then aggregated into a CA index using factor analysis.Footnote 10 Respondents were asked to assess the questions or statements using Likert scales, with 1 representing complete disagreement and 5 indicating full agreement. We choose these particular questions and statements based on the established criteria for well-functioning CA institutions (see immediately previously cited literature) and to reflect the nature and tradeoffs associated with forest CA in Ethiopia. The questions were extensively pretested by Ethiopian experts and found to be highly relevant for respondents before implementation in the field by trained and experienced enumerators.
The questions/statements evaluated by respondents cover seven main CA design principles/attributes extensively cited in the literature. The first focuses on access to forest resources (i.e., who can be a CF group member) and particularly on whether access rules are clear and fair, which was particularly identified by Ostrom (Reference Ostrom1990) and elsewhere in the literature. The second set focuses on the fairness and equality of forest product distribution. The third group examines whether respondents perceive limits on their extraction of fuelwood and fodder/grazing. These statements evaluate whether there are harvest quotas. We also ask respondents to evaluate the degree of forest monitoring by respondents and their assessment of other villagers' monitoring contributions. We do not include government monitoring, because monitoring is done only by villagers; as discussed in section 3, formal forest institutions are very weak. One statement asks if those who allocate harvest quotas are democratically chosen. Finally, respondents assess formal sanctions and informal sanctions for those who transgress harvest limits and quotas.
These attributes are multi-level rather than dichotomous, because forest sector CA attributes in Ethiopia and much of the lower income developing world run from excellent to terrible and everywhere in between, and have evolved locally in response to circumstances (Agrawal et al., Reference Agrawal, Chhatre and Hardin2008; Jodha, Reference Jodha, Ghate, Jodha and Mukhopadhya2008; Bluffstone et al., Reference Bluffstone, Robinson and Purdon2014). The CA interpreted and reflected in the respondent perceptions listed in table 1 have evolved over time, based on community circumstances and histories rather than explicit policy.
We emphasize that at the time of this writing there is no CF ‘program’ in Ethiopia that has the clarity and legal structure that one would find, for example, in Nepal. In Ethiopia the Forest Proclamation of 2007 made it possible for individuals and communities to control forests, but the form of that control and the nature of the CA are multi-dimensional, informal, probably continuous in those dimensions (i.e., from terrible to excellent and everything in between) and often idiosyncratic to each location.
This context is important, because we believe it supports – although perhaps it does not guarantee – our attempt to identify the effects of CA on forest carbon. It would not be appropriate, for example, to consider such measures as anything resembling policy ‘treatments’. In Ethiopia there is no sense in which respondents' CA perceptions would reflect communities that ‘opted’ or selected into CA or that respondent perceptions of CA are somehow a function of forest quality. It is also very unlikely that respondent CA perceptions and forest carbon are simultaneously affected by a common exogenous variable that would confound our results; the Ethiopian CA circumstances and our choice of CA measure help to obviate such important identification problems.
We analyze individual CF CA values rather than, for example, averaging by kebele. This approach is consistent with that of Glaeser et al. (Reference Glaeser, Laibson and Sacerdote2002), who treat social capital as an asset held by individuals. Many CA variables are highly collinear, making it impossible to use all 14 variables in models. We therefore aggregate the information into a higher level index using factor analysis. This aggregation method is standard when a priori weights are unknown and was indeed used by Chhatre and Agrawal (Reference Chhatre and Agrawal2009) to aggregate heterogeneous subsistence product extractions into a ‘forest products’ index.Footnote 11 Based on the results of the factor loadings, we derive one factor with an eigenvalue greater than one. All constituent variables therefore load on a single factor, which explains 87.7 per cent of the variation, indicating that households treat CF CA as a package with several components.Footnote 12 This factor is then used as our variable CA, which is our primary variable of interest.
As already mentioned, the context we analyze and our choice of CA measure facilitates identification. To identify effects we need to be confident that we avoid simultaneity bias (e.g., reverse causality), non-random sample selection bias and potential confounders (i.e., omitted variables correlated with both CA and carbon). On the issue of potential confounders, as discussed below we adjust for the major observable confounders discussed in the literature and capture unobservables using regional state fixed effects. We acknowledge that we may not be able to rule out all possible confounding factors, but it is also true that all econometric models have the possibility for omitted variables. With careful choice of environmental and economic covariates, in the spirit of Barrett and Carter (Reference Barrett and Carter2010), we are confident that we avoid serious confounding.Footnote 13
Our choice to use household reported CA attribute measures makes reverse causality very unlikely. For our CA index to be endogenous in this way, it is necessary that high or low stocks of forest carbon affect respondent reactions to the 14 statements that represent the CA attributes, which are the basis of our CA measure. Such reverse causality seems very unlikely and in any case communities have little reason to invest in better CA when forests are abundant (Hyde et al., Reference Hyde, Amacher and Magrath1996); if there were to be endogeneity, we would expect to find CA associated with less rather than more forest carbon. Our hypothesis is that higher quality CA results in more forest biomass and therefore more carbon.
In our particular sample context, there is little reason to suspect selection into a non-random ‘treatment’. As already discussed in detail, we are not talking about communities ‘opting in’ to a program and therefore gaining rights to rich forests; access to forests has always been available to households living in those areas. It is therefore not appropriate to characterize CA as a non-randomly applied treatment that has the potential to yield biased results when the effects are analyzed.
Self-organizing to the level that households, for example, favorably evaluate particular aspects of CF CA is much less subject to sample selection and endogeneity bias than programs that individual or communities exercise the choice to opt into. Such a conclusion seems particularly appropriate in areas like Ethiopia where communities are very stable and have been largely left to control forests using customary methods. Indeed, having a group of cooperative households that long ago settled in an area could reasonably be considered an exogenous random treatment that positively affects contemporary forest stocks.
Households within kebeles are assumed to have equal access to carbon (measured per capita and per hectare) in kebele CFs. They then remove forest products from CFs, which reduces the biomass and carbon stocks. Carbon stocks are observed along with reported CA attributes. We estimate and present models at both household and kebele levels, finding very similar results, but in our discussion we emphasize the household approach for two reasons. First, we have more observations at the household level and therefore can more efficiently estimate the models. More importantly, though, CA is measured at the household level, because we know that without a well-defined ‘program’ households are going to have different views about CA and its attributes such as fairness, clarity and monitoring. Estimating at the household level allows us to exploit that variation.
The model can be estimated at either the household or community level, because access to the subsistence products like fuelwood that households collect from forests is truly shared within each community. Each household in a kebele therefore has something very close to equal access to biomass, including the carbon (per hectare or per capita), which is released into the atmosphere when fuelwood is burned. Modeling access to common pool resources in this way, as average stocks, dates to Gordon (Reference Gordon1954), who analyzed common pool fisheries, and has become standard in such situations. Both household and kebele models are presented, however, and the results are very similar.
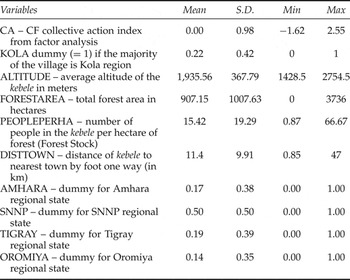
Carbon stored in natural and plantation forests is likely affected not only by the CA attributes that we hypothesize are important, but also by a variety of community and ecological variables (Chaiyo et al., Reference Chaiyo, Garivait and Wanthongchai2011). We therefore follow the lead of Chhatre and Agrawal (Reference Chhatre and Agrawal2009) and include several other variables. These independent variables are listed in table 2.
Independent variables (N=315)

Physical isolation, because of increased transport costs and reduced market opportunities, is expected to be associated with less extraction of biomass by villagers and therefore a larger carbon stock. This is consistent with the von Thunen model of deforestation (Hyde et al., Reference Hyde, Amacher and Magrath1996) and a large literature on geography and development that finds isolation reduces economic activity (e.g., Gallup et al., Reference Gallup, Sachs, Mellinger, Pleskovic and Stiglitz1999). Isolation is also a potential confounding factor, because it is possible that more isolated kebeles have systematically different CA attribute levels from more proximate ones. We eliminate this potential confounder by explicitly including distance to nearest town,Footnote 14 which we measure at the kebele level, in the models.
We use three explicitly ecological variables. Forest carbon is affected by forest altitude and the type of ecosystem, because of variations in temperature, rainfall and resulting densities and species composition. We therefore include average kebele altitude.Footnote 15 As some kebeles can be large (average 3640 ha and maximum >10,000 ha) and include multiple altitudes, we also include whether kebele officials report that the majority of the kebele is lowland kola, which is the Amharic word for ecosystems between 500 and 1,500 m above sea level.Footnote 16
Population pressures, because of the need to access subsistence products (e.g., fuelwood, fodder and grazing) rather than other forest values, should be associated with lower carbon stocks. It is also a potential confounding factor to adjust for if, for example, more competition for natural resources makes CA more difficult. More people per hectare of forest, which is the measure we use, implies more population pressure on forests and we therefore expect smaller carbon stocks. We include total area of forests because, all else being equal, larger forests have more carbon and fewer livelihood tradeoffs. This is also one of the key variables found significant in others' models of forest quality (e.g., Chhatre and Agrawal, Reference Chhatre and Agrawal2009).
Of course, unobserved regional factors will also influence carbon in kebele forests. A key ecological factor is rainfall. To capture this and other unobservables, we include regional state fixed effects, with Oromiya Regional State the omitted state.Footnote 17 These regional state dummy variables also pick up unobserved social variables. For example, because regional state boundaries are drawn along ethnic and linguistic lines, these dummy variables will capture a variety of social and historical factors linked to ethnicity. They will also adjust for differences in agricultural systems and even cooking technologies linked to ethnicity and location. Perhaps most importantly, these variables capture social capital related to CA not represented by our factor analysis that is region and ethnicity specific. Finally, as discussed below we include interactions between CA and regional dummies, because respondent reported CA attributes clearly vary by regional state.
5. Results and discussion
We begin our results discussion with an analysis of bivariate Spearman correlations that provide empirical support for our regression modelsFootnote 18 (presented in the online appendix). With the exception of the Amhara Regional State dummy, all variables in our models are significantly associated with our two measures of carbon (PERCAPCARBON and PERHACARBON). CA, which is the result of the factor analysis of our 14 CF CA survey questions/statements, is positively correlated with forest carbon and significantly different from zero at greater than the 1 per cent level for both carbon measures (ρ = 0.32 and 0.33).
Other variables have expected correlations. Households living in more remote areas as measured by distance to nearest town (ρ = 0.36 and 0.14) and in kola regions (ρ = 0.20 and 0.09) have higher carbon forests, as do those with larger forest areas (ρ = 0.53 and 0.46). Households living in kebeles with higher average altitudes have less carbon in their forests (ρ = −0.48 and −0.41), as do those living in areas with greater population pressures (ρ = −0.45 and −0.46). The SNNP Regional State dummy is highly positively correlated with forest carbon (ρ = 0.69 and 0.67), reflecting the wetter, warmer, more tropical ecological characteristics and larger forest stocks in the south of the country compared with the northern more hilly regions. Tigray, which is a low rainfall, mountainous regional state in the north of the country is highly negatively associated with carbon stocks (ρ = −0.50 and −0.54). Not surprisingly in a large, ecologically diverse country like Ethiopia, carbon stocks vary by region.
In general, independent variables are either insignificantly correlated with CA or have correlations close to zero. Only the SNNP and Tigray Regional State dummies are highly and significantly correlated with CA, with households in SNNP Regional State likely to perceive high levels of CF CA (ρ = 0.40) and those in Tigray low levels of CA (ρ = −0.36). These two regional states have very different social norms, ethnic compositions and economies, which seem to be reflected in key differences in measured CF CA. From an econometric standpoint, we need not worry about multicollinearity between CA and any variables except the two regional dummies. These results also suggest that CA varies by regional state and interaction terms are therefore appropriate.
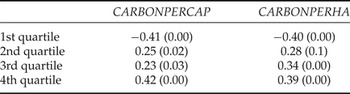
Examining the relationship between PERCAPCARBON, PERHACARBON and CA as a whole can mask details. We therefore break the distribution of CA down into quartiles of 79 observations each and analyze correlations and significance levels. These results are presented in table 3. We see that in all quartiles CA is significantly correlated with forest carbon. The first quartile (lowest levels of CA) is highly and significantly negatively correlated with PERCAPCARBON and PERHACARBON (ρ = −0.41 and −0.39). The middle two quartiles are positively associated with forest carbon (ρ = 0.23 − 0.34) and the top quartile of the CA distribution is highly positively correlated with PERCAPCARBON and PERHACARBON (ρ = 0.42 and 0.39). This pattern is in accord with our analytical framework in which higher quality CA could lead to more effective collective management, more forest biomass and more sequestered carbon.
Spearman correlations between CA and CARBONPERCAP and CARBONPERHA by quartile of the CA distribution

Note: Significance levels in parentheses.
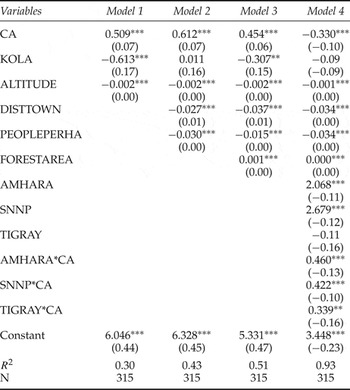
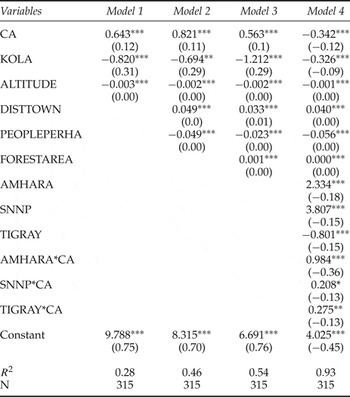
Although these results indicate that CF CA leads to better management and possibly more forest carbon, effects may be spurious. We therefore present the results of four OLS regression models for each forest carbon measure, all of which include CA, our variable of interest. The first set of models includes only ecological variables. The second adds DISTOWN and PEOPLEPERHA, which are both measures of pressure on forests. The third set of models brings in FORESTAREA and the final model adds regional state dummies and interaction effects. These interaction terms allow us to distinguish generic CA effects, CA effects-by-region and regional fixed effects that pick up the unobserved region-specific factors discussed above. All dependent variables are in logs and reported standard errors are robust standard errors.
The household-level regression results are presented in tables 4 and 5. Kebele level models are in the online appendix and offer results very similar to the household models. We see from the tables that the models explain a large portion of the variance in carbon. Even with only three variables we estimate R 2 of about 0.30, rising to 0.93 with regional state fixed effects and interactions. These are high values for cross-sectional data and suggest that the models are reasonable characterizations of key forest carbon correlates.
OLS models of carbon stock per hectare of kebele forest (CARBONPERHA)

Notes: The dependent variable is in logarithmic form. *Significant at 10%; **significant at 5%; ***significant at 1%. Robust standard errors are in parentheses.
OLS models of carbon stock per capita (CARBONPERCAP)

Notes: The dependent variable is in logarithmic form. *Significant at 10%; **significant at 5%; ***significant at 1%. Robust standard errors are in parentheses.
We see that with both definitions of carbon, in Models 1–3 CA is positively and significantly correlated with carbon. An approximately one standard deviation change in CA is estimated to be associated with increased carbon per capita and per hectare of 45–82 per cent depending on the definition of carbon stock and the model. These results hold when any one regional state dummy is included and for PERCAPCARBON when any two regional state dummies are included.
It is likely, though, that Models 1–3 omit key variables, because in Model 4, which includes regional state fixed effects and interaction terms, CA becomes negatively correlated with sequestered carbon. The interaction terms, though, are positively and significantly correlated with our forest carbon measures. This tells us that location matters not only for carbon, but also CA. We therefore conduct simulations to evaluate the net effects of CA when kebele forests are located in any of the four regional states.
We find that, whether measured on a per capita or per hectare basis, the effect of CA on the carbon stock is empirically small. On a per hectare basis, except in Oromiya the net effect of CA on carbon per hectare is positive.Footnote 19 For example, a one standard deviation increase in CA yields 0.009–0.13 tons more carbon per hectare. This is equivalent to a 0.04 per cent (Tigray) to 0.6 per cent (Amhara) increase in carbon per hectare compared with the mean. On a per capita basis, only in Amhara do higher levels of CA imply more carbon, with a one standard deviation increase in CA implying 0.63 per cent more carbon per capita. In other states, the effect is negative, but again empirically quite small.
Other independent variables in general have the expected signs, and magnitudes are large. Focusing on our two versions of Model 4, we estimate that increasing average kebele altitude by 100 m from the average of about 1,900 m is estimated to reduce carbon by 10–20 per cent. An increase in forest area of 100 ha is estimated to increase CARBONPERHA and CARBONPERCAP by about 10 per cent, which is in accord with the existing literature. Carbon is especially sensitive to population pressure, with an increase in population per forest hectare of one person associated with reduced carbon of 1.5–5.0 per cent.
More remote areas tend to have more carbon, with an increase in distance to town of 1 km associated with a 3–5 per cent increase in carbon. Amhara and SNNP Regional State fixed effects are associated with 200–300 per cent more carbon than that available on average to households in Oromiya Regional State. Tigray kebeles have less than 80 per cent of the carbon per capita of their counterparts in Oromiya. These fixed effects reflect the often very different agro-ecological conditions and social systems across these regional states. The specific factors are unobserved by us, but the variance captured by these dummy variables is clearly important. KOLA, like CA, is sensitive to inclusion of regional state dummies, but generally has a negative relationship with carbon.
6. Conclusions and policy implications
REDD + , which supports a variety of forest carbon-enhancing measures in the developing world, is one of the tools to address our climate change challenge. A key issue within REDD + , though, is to appropriately bring in the approximately 25 per cent of developing country forests that are subject to CA. Many authors have discussed or analyzed the social aspects of appropriateness, but there is limited analysis of carbon stocks accumulated due to community CA. Using an analytical framework that draws heavily on the economics of CA literature, satellite imagery combined with on-the-ground carbon estimates, an innovative detailed measure of CF CA and an empirical model inspired by Chhatre and Agrawal (Reference Chhatre and Agrawal2009), our paper tries to help close this gap.
The results of the empirical analysis suggest that the quality of CA in-and-of-itself has little effect on carbon stocks. We are unable to draw 100 per cent firm conclusions, because of the nature of our data (cross-sectional), but our results point to the need for specific carbon sequestration incentives. Using two measures of carbon and allowing for regional heterogeneity in CA and unobservables, we do not find that carbon sequestration is a significant byproduct of CA that is assuredly targeted to other forest values. We do not doubt that CA can increase direct use rents, but CA seems to have little or no effect on Ethiopia's forest carbon.
Our empirical model, which focuses exclusively on CF CA, certainly does not capture all aspects of our analytical framework, because it does not directly analyze social capital variables such as trust and reciprocity that underpin CA. It is therefore likely that some key aspects of social capital show up in regional state dummies, which except for Tigray are positively associated with carbon sequestration. Our analysis therefore may understate the contribution of social coordination to carbon stocks.
Many questions are left for the future and for others. Behavioral economists and others are likely to be interested in making explicit links between actual social capital (e.g., trust) and carbon sequestration. Also of keen interest is to better understand the set of behaviors that households living in areas with better CF CA actually engage in. For example, in areas with more controls on forest access and use, households will need to reduce CF extractions. Where they get those products, what investments are made, what substitutions occur and what hardships are endured are critical questions that need to be answered if we are to better understand whether CFs and REDD+ can be appropriately linked.
Better and smarter data combined with innovative techniques are needed to conclusively evaluate linkages between CFs, carbon sequestration and REDD+. Experimental methods can be very helpful to effectively construct counterfactual scenarios. Socio-economic and precisely measured forestry panel data that help control for unobservables are also critical. As we more explicitly link households with particular forests, careful adjustments for leakage will also be particularly important.