1. Introduction
The Late Cretaceous is a unique period in the geological history of the southeastern South China Block. It is relatively quiescent in terms of tectonic and magmatic activities that merely resulted in some back-arc basins filled with redbeds intercalated with minor tholeiitic basalts (e.g. Zhou & Li, Reference Zhou and Li2000; Zhou et al. Reference Zhou, Sun, Shen, Shu and Niu2006). The reduced magmatic activities in the period include the emplacement of minor A-type granites and some mafic dykes along its southeastern coastline region (Li, Reference Li2000; Zhu et al. Reference Zhu, Wang, Chen, Chang, Hu and Xie2002; Zhou et al. Reference Zhou, Xiao, Dong, Wang, Wang and Ni2009; Li et al. Reference Li, Li, Chung, Li, Xu and Li2012, Reference Li, Zhang, Dong and Johnston2014; Ma et al. Reference Ma, Dong, Tang, Lv and Gu2013). Thus, the Late Cretaceous has been proposed to represent a tectonic transitional period for the SE South China Block from an Andean type (continental arc) to the present western Pacific type (trench–arc–back-arc) continental margin (e.g. Li et al. Reference Li, Li, Chung, Li, Xu and Li2012; Jiang & Li, Reference Jiang and Li2014). This is demonstrated by increasingly young magmatism and rift basins towards the coastline of SE South China corresponding to the subduction angle changing from low to high from late Mesozoic to Cenozoic times (Chung et al. Reference Chung, Cheng, Jahn, O’Reilly and Zhu1997; Zhou & Li, Reference Li2000; Zhu et al. Reference Zhu, Wang, Chen, Chang, Hu and Xie2002; Zhou et al. Reference Zhou, Sun, Shen, Shu and Niu2006), which possibly arises from the retreat of the arc system led by slab roll-back of subducted oceanic lithosphere (Li et al. Reference Li, Li, Chung, Li, Xu and Li2012). Tectonic regimes of this period inferred from the distribution of igneous rocks and fault-slip structures are considered to be NW–SE or WNW–ESE extension or contraction consistent with the Pacific margin-type tectonics (e.g. Zhou et al. Reference Zhou, Sun, Shen, Shu and Niu2006; Li et al. Reference Li, Zhang, Dong and Johnston2014). However, there are swarms of Middle to Late Cretaceous mafic dykes with arc geochemical characteristics in the SE South China Block that show nearly N–S strikes contradicting these stress regimes (Li et al. Reference Li, Hu and Rao1997; Ge et al. Reference Ge, Li and Zhou2003; Zhu et al. Reference Zhu, Ling, Shen, Lu, Deng and Tan2008; Dong et al. Reference Dong, Yan, Zhang, Du and Zhu2010; Tang et al. Reference Tang, Chen, Dong, Shen, Cheng and Fu2010; Wang et al. Reference Wang, Li, Jia, Wyman, Tang, Li, Ma, Yang, Jiang and Gou2012; Ma et al. Reference Ma, Dong, Tang, Lv and Gu2013).
The Late Cretaceous is also a special period for the SE South China Block when its southern part was gradually transformed into a passive continental margin amid the opening of the South China Sea basin in middle Tertiary time (e.g. Holloway, Reference Holloway1982; Taylor & Hayes, Reference Taylor, Hayes and Hayes1983; Lee & Lawver, Reference Lee and Lawver1995; Yan et al. Reference Yan, Deng, Liu, Zhang and Jiang2006). Following this process, the igneous rocks show a change in lithology from dominant arc type to wholly intra-plate type (mid-ocean ridge (MORB) or ocean island basalt (OIB)) from Late Cretaceous to early Tertiary times (e.g. Zhou et al. Reference Zhou, Xiao, Dong, Wang, Wang and Ni2009; Jiang & Li, Reference Jiang and Li2014). Therefore, the Late Cretaceous magmatic and tectonic processes on the southern margin of the SE South China Block are the key to unravelling this transition. Here we report our recent survey of dyke swarms distributed in coastal Guangdong (mainly around the Dawan region) in terms of attitude, petrology, geochemistry (major and trace elements and isotopes) and U–Pb age. Individual dykes are decimetres to metres wide and can be traced tens of metres along strike. These dykes show geochemical features typical of arcs (including adakite) and OIBs. Importantly, these dykes occur along fractures with attitudes indicating a transition in stress orientation from generally an E–W to N–S extension and thus may pinpoint the tectonic regime on this margin in Late Cretaceous time.
2. Geological setting
2.a. General geology
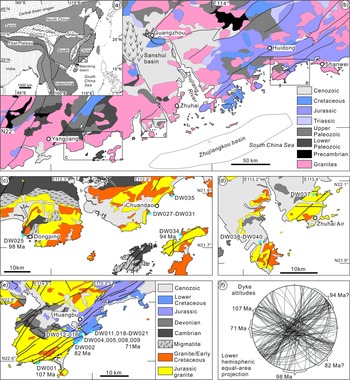
Coastal Guangdong is located in the southern part of the SE South China Block and on the northern passive margin of the South China Sea basin (Fig. 1a). The coastline region is largely covered by granitoids with Jurassic to Early Cretaceous ages and coeval clastic rocks or volcanic clastic rocks (Fig. 1b). These rocks show a general NE–SW distribution. Swarms of dykes occur along fractures cutting these Jurassic to Cretaceous igneous rocks described in more detail below. Triassic granites only crop out locally, as do coeval fine clastic rocks. Late Cretaceous to Tertiary volcanic rocks including basalts, dacites and rhyolites occur locally as in the Maoming basin (92−56 Ma) (Zhu et al. Reference Zhu, Wang, Chen, Chang, Hu and Xie2002), the Sanshui basin (64−43 Ma) (Zhou et al. Reference Zhou, Xiao, Dong, Wang, Wang and Ni2009) and the Zhujiangkou basin (51−17 Ma) (Li & Liang, Reference Li and Liang1994; Zou et al. Reference Zou, Li and Rao1995; Zhu et al. Reference Zhu, Wang, Chen, Chang, Hu and Xie2002; Yan et al. Reference Yan, Deng, Liu, Zhang and Jiang2006). Palaeozoic formations are distributed inland and mainly comprise fine-grained clastic rocks of the Cambrian, Middle to Upper Devonian and lower Carboniferous, of which the latter two sequences are in conformable contact and contain minor carbonates. These Palaeozoic rocks were subjected to a generally low-grade metamorphism forming slates and phyllites. Proterozoic metasedimentary rocks crop out further inland. The coastal region is traversed by two dominant arrays of regional faults striking NE–SW and NW–SE, respectively. There are also some faults striking nearly E–W or N–S, though are less well developed.
(a) Tectonic outline of southern and eastern Asia with the rectangle box indicating the location of study region. (b) Sketch geological map of coastal Guangdong with the (c) western, (d) central and (e) eastern sampling areas indicated (GDBG, 1962, 1973). The stars mark the sampling sites (e.g. DW025) and the following ages (e.g. 98 Ma) are the approximated values of zircon U–Pb dating of individual dykes. (f) Attitudes of dykes where the ages only index those dykes dated and may not represent the dykes with similar or close attitudes.

2.b. Mesozoic to Cenozoic geodynamics
A general back-arc setting prevailed in the Cretaceous SE South China Block amid NW or WNW subduction of the Palaeo-Pacific plate (Li et al. Reference Li, Hu and Rao1997; Li, Reference Li2000; Zhou & Li, Reference Li2000, Zhou et al. Reference Zhou, Sun, Shen, Shu and Niu2006). This is the case for its southern margin in latest Early to Late Cretaceous times where most felsic igneous rocks of this age period still show arc signatures (Wang et al. Reference Wang, Li, Jia, Wyman, Tang, Li, Ma, Yang, Jiang and Gou2012; Jiang & Li, Reference Jiang and Li2014; Yuan et al. Reference Yuan, Fang, Zhang and Dong2019). But, the coeval mafic rocks partially possess intra-plate geochemical characteristics (Li et al. Reference Li, Hu and Rao1997; Zhou et al. Reference Zhou, Sun, Shen, Shu and Niu2006; Ma et al. Reference Ma, Dong, Tang, Lv and Gu2013), which indicate lithospheric extension occurred in the region (Chung et al. Reference Chung, Cheng, Jahn, O’Reilly and Zhu1997; Li, Reference Li2000). From this time onwards, magmatism gradually changed to an entirely within-plate type as shown by the Tertiary basalts and rhyolites distributed in the Maoming (92−56 Ma) (Zhu et al. Reference Zhu, Wang, Chen, Chang, Hu and Xie2002), Shanshui (64−43 Ma) (Zhu et al. Reference Zhu, Wang, Mao, Zhu, Huang, Peng and Pu1989, Reference Zhu, Wang, Mao, Zhu, Huang, Peng and Pu1991; Zhou et al. Reference Zhou, Xiao, Dong, Wang, Wang and Ni2009) and Zhujiangkou (51−17 Ma) (Zou et al. Reference Zou, Li and Rao1995) basins. Accompanying this transition is the development of a regional N–S extension regime amid southern subduction of a Mesozoic oceanic plate (proto-South China Sea basin) beneath the Borneo terrane (e.g. Holloway, Reference Holloway1982; Lee & Lawver, Reference Lee and Lawver1995; Miao et al. Reference Miao, Huang, Yan, Yang, Zhang, Yu, Cai and Zhu2021) or SE extrusion of the Indochina plate following the India and Eurasian collision (Tapponnier et al. Reference Tapponnier, Peltzer, Le Dain, Armino and Cobbold1982, Reference Tapponnier, Peltzer, Armijo, Coward and Ries1986, Reference Tapponnier, Lacassin, Leloup, Sharer, Zhong, Liu, Ji, Zhang and Zhong1990). The extension caused the opening of the South China Sea basin in latest Oligocene to Miocene times with nearly E–W-trending spreading ridges in its northern part, and thus a passive continental margin resulted (e.g. Holloway, Reference Holloway1982; Taylor & Hayes, Reference Taylor, Hayes and Hayes1983; Lee & Lawver, Reference Lee and Lawver1995; Honza & Fujioka, Reference Honza and Fujioka2004; Yan et al. Reference Yan, Deng, Liu, Zhang and Jiang2006).
2.c. Geology of the sampling areas
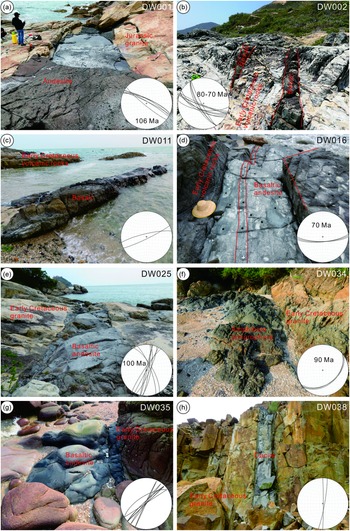
Sampling covers three segments of coastal lines, two between Yangjiang to Zhuhai (Fig. 1c, d) and one between Huidong to Shanwei (Fig. 1e), distributed to the west and east of the Zhujiang estuary, respectively. The west two segments expose mainly granites of the Late Jurassic to Early Cretaceous period. Migmatites with Neoproterozoic ages and slates of the Cambrian and Devonian also occur locally. The dyke swarms investigated in this study cut the Jurassic to Cretaceous granites and occur mainly along steeply dipping brittle fractures striking N–S to NE–SW with a few striking NW–SE (Figs 1f, 2e–h). The eastern segment exposes mainly volcanic rocks of Late Jurassic to Early Cretaceous age as well as minor coeval granites. The volcanic rocks show well-developed compositional bands striking ENE–WSW, which are defined by variously sized mineral grains of feldspar, quartz, mica and calcite. Microscopic fabrics show only subtle ductile deformation of quartz and mainly brittle granulation of feldspar, and recrystallization of quartz and mica is weak, all indicating relatively low temperatures during deformation. The dark dykes mainly cut the Early Cretaceous volcanic rocks, and only one dyke occurs in the Jurassic granites. As in the western segments, these dykes also occur along steep brittle fractures but strike dominantly NW–SE with fewer striking NE–SW to nearly E–W (Figs 1f, 2a–d).
Field outcrops of representative dykes with attitudes illustrated by stereographic projections. Ages are approximates of zircon U–Pb dating. (a) A large-scale andesite dyke cutting the Jurassic granite. (b) Two meso-scale basalt dykes with one pinching out. (c) A large-scale basalt dyke with dark red colour. (d) Two generations of basaltic andesite dykes with the thin one traversing through the thick one and extruding out at a curve of the latter. (b–d) all cut the Early Cretaceous volcanic rocks. (e) A large-scale basaltic andesite dyke. (f) A large-scale amphibole lamprophyre dyke. (g) A large-scale basaltic andesite dyke. (h) A meso-scale dacite dyke. (e–h) all cut the Early Cretaceous granites. (a–d) from the eastern region, (e–g) from the western region, and (h) from the central region.

The dykes are mostly decimetres to metres wide and rarely beyond 3 m (Fig. 2). Lateral extent is variable owing to limited exposure and in most cases can be traced for metres to tens of metres. There is no welding contact between the dykes and country rocks. Where they occur, the dykes always show clear-cut boundaries with the country rocks. In most cases, the fractures hosting the dykes show a composite characteristic, that is, single dykes often go from one fracture to another (Fig. 2d), or dyke boundaries show a zig-zag form. These features indicate emplacement along pre-existing structures. The dykes commonly show a massive structure and single-phase emplacement, except for one that exhibits subtle compositional banding and comprises two generations, with the later fine dyke emplaced through the interior of the earlier large dyke and extruding out at a curve of the earlier one (Fig. 2d). On the outcrop scale, most dykes are basaltic or andesitic; they show an aphyric texture and greyish to dark grey or black colour. A number of dykes show a relatively coarse appearance with dark red colouration (Fig. 2c). Although most dykes have a fresh appearance, some have undergone weathering such that they show a spherical form or various extents of clayization. Alteration may also contribute to the latter process.
3. Sampling scheme and analytical methods
A total of 33 dykes were sampled in this study, which included 20 dykes from the eastern region (Fig. 1e), 4 from the central region (Fig. 1d) and 9 from the western region (Fig. 1c). Representative samples were chosen for zircon dating (9 pieces), major- and trace-element analysis (25) and isotopic (Sr–Nd–Pb) analysis (19) as well as microscopic thin-section (26) observation (see Table 1 for the detailed information of samples analysed). Samples for zircon dating were first crushed to the approximate size, from which zircon grains were separated using conventional heavy liquid and magnetic techniques and subsequently were hand-picked under a binocular microscope. Such acquired zircon grains were mounted in epoxy resin discs and were subsequently half-sectioned to expose their interior structures and photographed under cathodoluminescence (CL) in order to choose proper dating sites. The mounts were vacuum-coated with high-purity gold prior to laser ablation inductively coupled plasma mass spectrometry (LA-ICP-MS) analysis. Samples for major, trace and isotopic analysis were first cut to remove weathered or contaminated parts and then crushed to a coarse size to be washed using an ultrasonic cleaner. Such processed rock separates were finally powdered to a suitable size for preparing fused glass beads or for HF/HNO3 acid dissolution in the following geochemical analysis.
Sample information

Note: ‘-’ refers to relevant analysis without result.
Zircon U–Pb dating was conducted by LA-ICP-MS (iCAP RQ) at the Guangzhou TuoYan Analytical Technology Co., Ltd, Guangzhou, China, which is equipped with a NWR 193 laser ablation system. During the ablation process, helium was used as a carrier gas and argon as the make-up gas, which were imported into the ICP via a Y-connector. The spot size and frequency of the laser were set to 30 µm and 6 Hz, respectively. The energy intensity was 3.5 J cm−2. Zircon 91500 (Wiedenbeck et al. Reference Wiedenbeck, Allé and Corfu1995) and glass NIST610 (Reed, Reference Reed1992) were used as external standards for U–Pb dating and trace-element calibration, respectively. Each analysis incorporated a background acquisition of ∼30 s followed by 40 s of data acquisition. An Excel-based software ICPMSDataCal was used to perform offline selection and integration of background and analysed signals, time-drift correction and quantitative calibration for U–Pb dating and trace-element analysis.
Major elements were measured on fused glass discs using the X-ray fluorescence (XRF) method on a Rigaku ZSX 100e instrument at the State Key Laboratory of Isotope Geochemistry, Guangzhou Institute of Geochemistry, Chinese Academy of Sciences (SKLIG GIG-CAS) (e.g. Li et al. Reference Li, Li, Wingate, Chung, Liu, Lin and Li2006) with analytical precision typically between 1 and 5 % and reported as oxides. Trace elements were measured by inductively coupled plasma mass spectrometry (ICP-MS) using a Perkin-Elmer Sciex ELAN 6000 instrument at the SKLIG GIG-CAS (e.g. Li et al. Reference Li, Li, Wingate, Chung, Liu, Lin and Li2006) with analytical precision for most elements better than 5 %. Strontium and neodymium isotopes were measured using a Micromass Isoprobe multi-collector ICP-MS at the SKLIG GIG-CAS (for analytical procedures see Li et al. Reference Li, Liu, Sun, Li, Liang and Liu2004). Measured 87Sr/86Sr and 143Nd/144Nd ratios were normalized to 86Sr/88Sr = 0.1194 and 146Nd/144Nd = 0.7219, respectively. The measured 87Sr/86Sr ratio of the GSB G62031-90 standard was 87Sr/86Sr = 0.707630 ± 6 (1σ) and 143Nd/144Nd of the GSB 04-3258-2015 standard was 143Nd/144Nd = 0.512438 ± 6 (1σ). Lead was separated and purified via conventional cation-exchange technique with HBr as an eluant. Total procedural blanks were less than 50 pg Pb. Isotopic ratios were measured using the VG-354 mass spectrometer at the GIG-CAS following the procedures described by Zhu et al. (Reference Zhu, Chen and Peng2001). Pure solution SRM 981 yielded values within standard error limits.
4. Results
4.a. Petrography
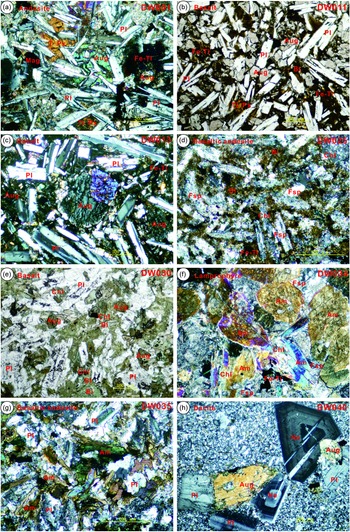
The dykes consist of various lithologies from basaltic to andesitic and dacitic (Table 1). Major rock-forming minerals include feldspar (mainly plagioclase), pyroxene (augite and Ti-bearing varieties), amphibole, biotite, Fe–Ti oxides and quartz. Feldspar occurs as lath- or blade-shaped crystals and pyroxene, biotite, amphibole and quartz as equant grains or short prismatic forms. Occasionally, pyroxene forms high aspect ratio phenocrysts. Among these, feldspar shows notable magmatic zoning and twinning (Fig. 3a, c) and pyroxene partially shows twinning.
Photomicrographs of representative dykes. (a) An andesite with fine and ophitic texture. (b, c, e) Basalts with fine and ophitic texture. (d, g) Basaltic andesites with microgranular texture. (f) A lamprophyre with amphibole phenocrysts. (h) A dacite with phenocrysts of plagioclase, augite and nepheline. Scale bars = 200 μm. (b) and (e) are views under plane-polarized light and the others under cross-polarized light. (a–c) are from the eastern region, (d–g) from the western region and (h) from the central region. Abbreviations: Aug – augite; Am – amphibole; Bi – biotite; Chl – chlorite; Fe-Ti – Fe- and Ti-bearing oxides; Fsp – feldspar; Mag – magnetite; Ne – nepheline; Pl – plagioclase; Qtz – quartz; Ti-Px – Ti-bearing pyroxene.

The basaltic dykes are mainly composed of feldspar, pyroxene and Fe–Ti oxides with minor biotite (Fig. 3b, c, e). They are called basalt because the sizes of component minerals are generally less than 0.6 mm. The fine-grained basaltic dykes comprise lath- or blade-shaped feldspar crystals in a triangular arrangement surrounded by xenomorphic pyroxene grains, forming the typical ophitic texture. The microgranular basaltic dykes show an intergranular or intersertal texture comprising an irregular arrangement of pyroxene, feldspar and biotite crystals surrounded by melanocratic microcystalline minerals, or microcryptocrystalline or glassy materials. One dyke is described as an amphibole lamprophyre owing to dominance of large amphibole phenocrysts (0.3–1.2 mm) over microcystalline feldspar (Fig. 3f). With increasing proportions of feldspar, the dykes have intermediate compositions like andesite (Fig. 3a) or basaltic andesite (Fig. 3d, g), which are not porphyritic but may show an ophitic texture. The feldspar crystals are approximately equally sized and fine grained to microgranular (0.05–0.40 mm) and form intergranular or intersertal textures, or in a few cases pilotaxitic or hyalopilitic textures. The dacitic dykes contain various amounts of phenocrysts of quartz and biotite (0.05–0.10 mm), or of pyroxene, feldspar and nepheline (0.2–1.0 mm) (Fig. 3h). The phenocrysts partially show resorption textures, and the matrix is composed of quartz, feldspar and mica with a microcrystalline or felsitic to microcryptocrystalline texture. The dykes with a dark red appearance contain titaniferous pyroxene and Fe–Ti oxides (Fig. 3b), and the dykes with a dark purple colouration contain dark red biotite.
Various extents of low-temperature alteration or weathering occur in some samples (Table 1) mainly as chloritization of the major rock-forming minerals like pyroxene (Fig. 3e), amphibole (Fig. 3f), biotite and feldspar (Fig. 3d). Rarer types of alteration include biotitization and carbonatization of mafic minerals like pyroxene and amphibole, and sericitization of feldspar. Successive alteration as in the sequence of amphibole, biotite and chlorite is not observed in the analysed samples. The alteration seems to be related to the lithology and texture such that the microgranular to cryptocrystalline rocks with more andesitic compositions suffer more intense alteration (Fig. 3d). Even approximately in the same location, basalts with a fine-grained texture are less altered than microgranular basaltic andesites in either the eastern or western region. Several dacite samples (Fig. 3h) from the central region are not affected by the later alteration or weathering.
4.b. Major and trace elements
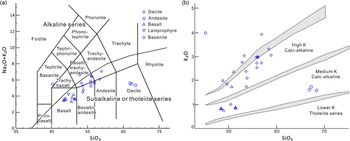
Major-element compositions of the dykes reflect their lithological variation (Table 1) (see online Supplementary Table S1 for the analytical data). On the bivariate diagram of K2O + Na2O versus SiO2 (Fig. 4a), most samples analysed form a coherent array covering the compositions from basaltic to andesitic, except one (DW037-2) falling in the basanite field and three (DW038, DW039 and DW040) in the dacite field. Most samples belong to the subalkaline or tholeiite series and two samples (DW015 and DW037-2) to the alkaline series, but they are all close to the boundary except the three dacite samples. On the K2O versus SiO2 diagram (Fig. 4b), most samples fall in the fields for the high-K calc-alkaline and shoshonite series, except for seven samples belonging to the medium-K calc-alkaline series.
(a) Na2O + K2O versus SiO2 diagram and (b) K2O versus Si2O diagram. The symbols with a thick frame indicate the two basalts and one basaltic andesite with OIB trace-element characteristics. These symbols are also used in the following figures. The frameworks are according to Rollinson (Reference Rollinson1993). See online Supplementary Material Table S1 for the data employed.

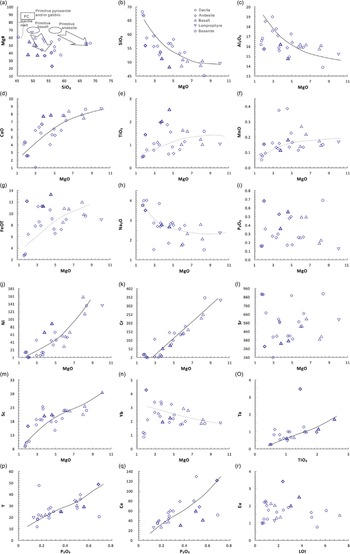
The samples analysed contain MgO between 1.7 and 10 % with Mg no. (molar ratio MgO/(MgO + FeOT)) mostly between 36 and 61 (Fig. 5a). SiO2 versus MgO approximates a single liquid line of descent (Fig. 5b), consistent with crystallization of SiO2-poor assemblages (spinel + olivine + clinopyroxene ± plagioclase) from a range of parental melts (Kelemen et al. Reference Kelemen, Hanghoj, Greene, Holland and Turekian2003; Klein, Reference Klein, Holland and Turekian2003). In this and the following Harker diagrams (Fig. 5), all the samples usually form a coherent trend if there is a correlation. The exception is the basanite, lamprophyre and dacite samples that tend to form end-member components in most cases. Al2O3 contents broadly increase with decreasing MgO (Fig. 5c) reflecting the importance of addition or removal of Al-poor phases like olivine (± pyroxene ± hornblende) during the petrogenetic history. The inference is also reflected in the falling Ni and Cr contents with decreasing MgO (Fig. 5j, k), because both elements are compatible in olivine. CaO also decreases with decreasing MgO (Fig. 5d), which may indicate crystallization of clinopyroxene or plagioclase. Strontium largely shows a scattered pattern (Fig. 5l), which combined with a positive correlation between MgO and Sc (an element compatible in clinopyroxene) (Fig. 5m) is in support of the fractional crystallization or accumulation of clinopyroxene. Though Sc is also compatible in garnet (e.g. Hofmann, Reference Hofmann, Holland and Turekian2003), neither Yb nor Lu shows a noticeable trend with MgO (Fig. 5n), thus excluding the major role played by this mineral. TiO2 (Fig. 5e), MnO (Fig. 5f) and FeOT (Fig. 5g) exhibit a scattered but negative correlation with MgO due possibly to various proportions of Fe–Ti oxide fractionation. TiO2 shows a positive correlation with either Nb or Ta (Fig. 5o), which indicates that rutile (or amphibole) is the major phase bearing them. Na2O (Fig. 5h), K2O and P2O5 (Fig. 5i) also show an overall scattered pattern with MgO. However, P2O5 shows a clear positive correlation with both Y (Fig. 5p) and Ce (Fig. 5q) but not with CaO, indicating some addition or removal of accessory phases like apatite (compatible in Y and Ce) as well as monazite (compatible in light rare earth elements (LREEs), Th and U) or xenotime.
Harker bi-variate diagrams for partial major and trace elements. The trend lines approximate the variation of most data, and are not calculated curves. The symbols with a thick frame indicate the two basalts and one basaltic andesite with OIB trace-element characteristics. (a) A schematic illustration shows how fractionation of primitive pyroxenite or gabbro from primitive basalts leads to decreasing Mg no. at nearly constant SiO2 while fractionation of the same crystal assemblages from primitive andesite leads to increasing SiO2 (Kelemen et al. Reference Kelemen, Hanghoj, Greene, Holland and Turekian2003). See online Supplementary Material Table S1 for the data employed.

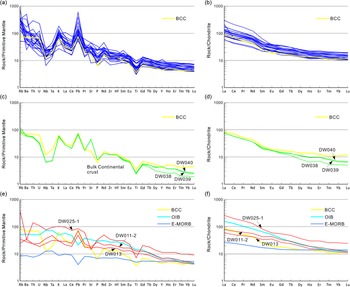
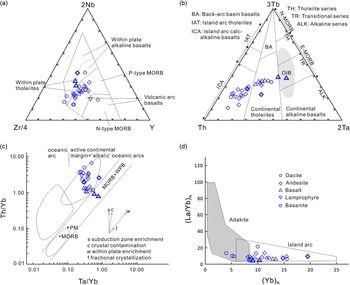
All the samples analysed have trace elements showing enrichment relative to the primitive mantle as indicated by the larger-than-unity element ratios (Fig. 6). This is particularly notable for large ion lithophile elements (LILEs, e.g. Rb, Ba, Th, U, K and Sr), high field strength elements (HFSEs, e.g. Nb, Ta, Zr and Hf) and LREEs (e.g. La, Ce, Pr and Nd), which are generally tenfold higher in abundance than those of the primitive mantle. On the primitive mantle normalized spidergrams, most samples show noticeable negative anomalies in Nb and Ta, and positive anomalies in K and Pb (Fig. 6a, c). Trace-element compositions (Fig. 7) fall in the range of volcanic arc or more specifically continental arc rock assemblages (Fig. 7c). There are also systematic negative anomalies in both P and Ti, which may arise from fractionation of phosphorous (apatite, monazite and xenotime) and titaniferous phases (Fe–Ti oxides like rutile and magnetite, and Ti-bearing phases like biotite, phlogopite, amphibole, pyroxene and garnet), respectively. The chondrite normalized REE distribution shows a LREE-enriched pattern without notable Eu anomalies except for the sample DW020-2 that also shows a negative anomaly in Ce (Fig. 6b). This outlier may be related to greater fractional crystallization of plagioclase.
Trace-element distribution diagrams. (c) and (d) are for the three dacites (DW038, DW039 and DW040), (e) and (f) for the two basalts (DW011 and DW013) and one basaltic andesite (DW025-1), and (a) and (b) are for the rest of the 19 samples (see Table 1 for the samples used). Primitive mantle data after McDonough & Sun (Reference McDonough and Sun1995), chondrite, E-type MORB and OIB data after Sun & McDonough (Reference Sun, McDonough, Saunders and Norry1989) and bulk continental crust (BCC) data after Rudnick & Gao (Reference Rudnick, Gao, Holland and Turekian2003). See online Supplementary Material Table S1 for the data employed.

Trace-element discrimination diagrams. (a) 2*Nb–Zr/4–Y diagram after Meschede (Reference Meschede1986). (b) 3*Tb–Th–2*Ta diagram after Xia & Li (Reference Xia and Li2019). The OIB field is for Hawaii oceanic island basalts. (c) Bi-variate plot of Th/Yb versus Ta/Yb after Pearce (Reference Pearce, Hawkesworth and Norry1983). (d) Bi-variate plot of (La/Yb)N versus YbN after Martin (Reference Martin1999). The symbols with a thick frame indicate the two basalts and one basaltic andesite with OIB trace-element characteristics.

There are three samples (DW011-2, DW013 and DW025-1) that lack Nb and Ta negative anomalies (Fig. 6e) somewhat like OIBs in spite of their much evolved Mg no. (23–38) (Fig. 5a). Their trace-element compositions fall in or close to the fields for within-plate (Fig. 7a, c) or oceanic island (especially the former two samples) (Fig. 7b) rock assemblages. The former two samples still show a positive anomaly in Pb. The latter one sample shows a negative anomaly in Ba, Sr and Ti, which may be due to fractionation of plagioclase and Ti-bearing phases, though its REE pattern shows no noticeable negative anomaly in Eu (Fig. 6f). In addition, the three samples show much more fractionated middle (MREE) to heavy (HREE) rare earth elements (Dy/Yb: 2.16–2.60) (Fig. 6f), as do the three dacite samples (DW038–040: 2.36–2.48) (Fig. 6d). The three dacites have relative high Mg no. (52–53) (Fig. 5a), fractionated REE patterns, much low yttrium and HREE concentrations (e.g. Y < 20 ppm, Yb < 2 ppm), and high Sr/Y (47–74) and La/Yb (15–21) ratios, resembling the adakite series (Fig. 7d) (e.g. Drummond & Defant, Reference Drummond and Defant1990; Defant & Drummond, Reference Defant and Drummond1993; Drummond et al. Reference Drummond, Defant and Kepezhinskas1996; Martin, Reference Martin1999; Foley et al. Reference Foley, Tiepolo and Vannucci2002; Rapp et al. Reference Rapp, Shimizu and Norman2003).
4.c. Sr–Nd–Pb isotopes
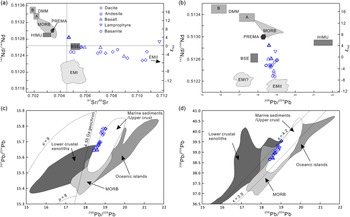
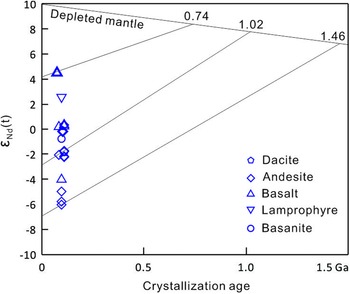
Nineteen samples were analysed for Sr, Nd and Pb isotopes (online Supplementary Material Table S1). Strontium isotope ratios of 87Sr/86Sr show a large and coherent variation from 0.705 to 0.712 with one outlier DW025-1 (0.724). Neodymium isotope ratios 143Nd/144Nd change from 0.512286 to 0.512855. Lead isotope ratios have a much more restricted variation as 206Pb/204Pb from 18.428 to 19.015, 207Pb/204Pb from 15.6455 to 15.7875, and 208Pb/204Pb from 38.6507 to 39.5461. On the 143Nd/144Nd versus 87Sr/86Sr diagram (Fig. 8a) (Zindler & Hart, Reference Zindler and Hart1986), most samples form an array of negative correlation extended from MORB to EMII above the mantle array (the sample DW025-1 with a large 87Sr/86Sr ratio is not shown for visual clarity). A similar trend is also recorded by either 87Sr/86Sr versus 206Pb/204Pb or 143Nd/144Nd versus 206Pb/204Pb bi-variation (Fig. 8b) (Zindler & Hart, Reference Zindler and Hart1986). Lead isotopes of all the samples fall in the field for marine sediments or upper crust, or the overlapping region with oceanic islands, MORB and lower crust xenoliths (Fig. 8c, d) (White, Reference White2001). Among these samples, the dacites have the least radiogenic Sr isotopes and their Nd isotopes are close to bulk solid earth (BSE) (Fig. 8a). The same is true for the samples showing OIB features (DW011-2 and DW025-1) except that the sample DW025-1 has highly radiogenic Sr (87Sr/86Sr = 0.724). Sample ϵNd(t) values vary from 4.66 to −5.97 (Fig. 9) and model ages relative to the depleted mantle are typically around 1.0 Ga and vary from 0.738 to 1.457 Ga, much older than the corresponding U–Pb zircon ages for the dyke emplacement.
Isotopic bi-variate diagrams. (a) Sr–Nd and (b) Pb–Nd isotope variation after Zindler & Hart (Reference Zindler and Hart1986). (c, d) Pb isotope variation after White (Reference White2001). Note that in (a), the sample DW025-1 has a 87Sr/86Sr ratio (0.724) beyond the abscissa extent. The symbols with a thick frame indicate the two basalts and one basaltic andesite with OIB trace-element characteristics. Abbreviations: BSE – bulk solid earth; DMM – depleted MORB mantle; EM – enriched mantle; HIMU – high-μ; MORB – mid-oceanic ridge basalts; PREMA – prevalent mantle. μ = 238U/204Pb and κ = 232Th/238U. See online Supplementary Material Table S1 for the data employed.

ϵNd (initial) as a function of emplacement ages of the dykes. Residence ages are calculated relative to depleted mantle after White (Reference White2001). The symbols with a thick frame indicate the one basalt and one basaltic andesite with OIB trace-element characteristics.

4.d. U–Pb zircon ages
For deciphering the ages of emplacement of the dyke swarms, nine representative dyke samples were chosen for U–Pb dating, of which four are from the eastern region (DW001, DW002, DW011 and DW016) (Fig. 1e), two from the central region (DW038 and DW039) (Fig. 1d) and three from the western region (DW025, DW027 and DW034) (Fig. 1c). Samples DW001, DW016, DW025 and DW027 belong to andesite, DW002 and DW011 to basalt, DW034 to amphibole lamprophyre, and DW038 and DW039 to dacite. Besides the consideration of an even regional distribution, the more important reason for picking out these dykes lies in that they represent the dominant strike group. Though quickly quenched dykes, especially those basaltic to andesitic, are notorious for a lack of zircon, meagre amounts of zircon grains were still obtained from each sample. For analytical data for U–Pb dating see online Supplementary Material Table S1.
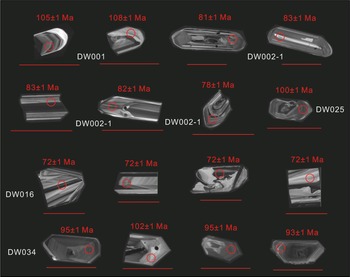
Zircon grains are euhedral and transparent, and have lengths rarely beyond 250 μm and widths beyond 100 μm (Fig. 10). Microscopic oscillatory zoning is evident in CL images of most zircons, whereas a few exhibit irregular zoning or a patchy texture. Some zircons have inherited cores. A total of 107 zircons were dated, and the ages range from Proterozoic to Late Cretaceous. The Th/U ratios are less than 3.0, and common Pb contents usually are less than 4.0 ppm.
Cathodoluminescence images of partial zircon grains. Scale bars = 100 μm.

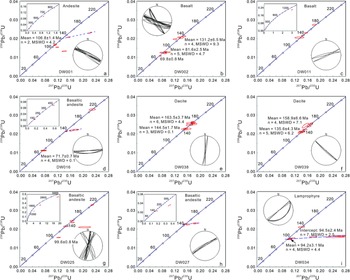
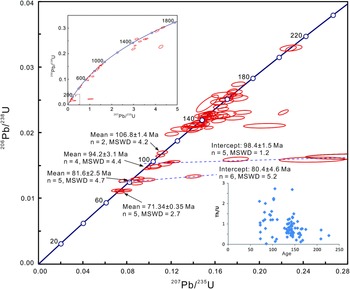
The samples (DW001, DW002, DW011 and DW016) from the eastern region show four major age groups (c. 140 Ma, 107 Ma, 82 Ma and 72 Ma) with most data points falling on or close to the concordia curve of 206Pb/238U versus 207Pb/235U (Fig. 11a–d). Several data points of the samples DW001 and DW016 have notable normal discordance and tend to form linear arrays intersecting the concordia at sites close to those concordant data points (Figs 11a, d, 12). For example, the sample DW001 has a discordant data point (206Pb–238U age: 85.2 ± 1.3 Ma) that tends to form a discordia with the nearly concordant data points of the sample DW002 (Figs 11b, 12). The lower intercept is at 80.4 ± 4.6 Ma that is not different from the 81.6 ± 2.5 Ma 206Pb–238U mean age within the error limit; but the upper intercept age has no geological meaning. These discordant data points possibly indicate the presence of inherited radiogenic Pb as revealed by the occasional presence of older cores (Fig. 10) (e.g. Gebauer & Grunenfelder, Reference Gebauer, Grunenfelder, Jager and Hunziker1979; Mezger & Krogstad, Reference Mezger and Krogstad1997). The two samples (DW038 and DW039) from the central region show two age groups around 140 Ma and 160 Ma, respectively (Fig. 11e, f), and the data points are generally concordant. The concordant and nearly concordant data points of the three samples (DW025, DW027 and DW034) from the western region (Fig. 11g, h, i) show three major age groups (c. 160 Ma, 140 Ma and 94 Ma). Discordant data points also have a tendency to form discordia lines with the lower intercepts at c. 140 Ma and 95 Ma. Among these, the sample DW025 (Fig. 11g) has one discordant data point with a 206Pb–238U age of 99.6 ± 0.8 Ma (83 % concordance) close to the discordia of the sample DW034 (Figs 11i, 12).
U–Pb concordia diagrams for individual samples. Stereographic plots are lower-hemispheric equal-area projection for fractures bordering dykes. (a–d) are from the eastern region, (e) and (f) from the central region and (g–i) from the western region. Note that only (a), (b), (d), (g) and (i) acquire suitable zircon ages possibly representing the emplacement time of the respective dykes. Mean ages are weighted average of 206Pb–238U ages of concordant and nearly concordant data points.

U–Pb concordia diagram for all samples dated. Also shown are Th/U ratios as a function of 206Pb–238U ages. Mean ages are weighted average of 206Pb–238U ages of concordant and nearly concordant data points.

5. Discussion
5.a. Timing of dyke emplacement
Emplacement of the dykes is since latest Early Cretaceous time as revealed by the age distribution of the zircons (Fig. 12). These zircons can be classified into two groups, one inherited and the other crystallized or grown from dyke magmas in respect to the ages of the country rocks. The zircons with ages around 140 Ma, which are the youngest zircons for the dykes DW011, DW027, DW038 and DW039, are inherited because the immediate country rocks of either volcanic or granitic composition have the same ages (Fig. 1c, d, e) (e.g. Jia et al. Reference Jia, Xie, Wu, Bu and Wu2017; Yang et al. Reference Yang, Xin, Li and Zhang2022). In addition, the dykes are hosted in brittle fractures (Fig. 2) with attitudes that also occur in the immediate country rocks, thus excluding their syngenesis. The corollary is that zircons with even older ages are also inherited, which are generally consistent with the ages of the regional igneous rocks (e.g. Ding et al. Reference Ding, Zhou and Sun2005; Zhou et al. Reference Zhou, Sun, Shen, Shu and Niu2006). Those concordant zircons with ages of latest Early Cretaceous to Late Cretaceous which are the youngest zircons in individual samples (DW001, DW002, DW016 and DW034) are interpreted as being grown from the dyke magmas given the absence of this period of plutonic rocks in coastal Guangdong. The spread of these concordant zircons along the concordia are most likely a result of multistage growth rather than the diffusional loss of Pb (e.g. Krogh, Reference Krogh1993; Mezger & Krogstad, Reference Mezger and Krogstad1997) and, thus, the corresponding ages represent the approximate emplacement times of the dykes. However, those discordant zircons with this period of apparent 206Pb–238U ages (DW001, DW025 and DW034) (Fig. 11a, g, i) may have an inherited origin from, for example, recrystallization of pre-existing zircons due to thermal events represented by the lower intercept ages (Fig. 12) (e.g. Gebauer & Grunenfelder, Reference Gebauer, Grunenfelder, Jager and Hunziker1979; Mezger & Krogstad, Reference Mezger and Krogstad1997). The process can cause a large extent of resetting of U–Pb systems and thus attendant loss of radiogenic Pb as indicated by a tendency to plot close to the lower intercepts (Fig. 12) (Gebauer & Grunenfelder, Reference Gebauer, Grunenfelder, Jager and Hunziker1979). Owing to a lack of thermal metamorphism of the dykes after emplacement, these thermal events are regarded as being intrusion related.
Accordingly, the U–Pb zircon dating generally reveals four phases of dyke emplacement (107 Ma, 98–94 Ma, 82 Ma and 71 Ma) from latest Early to Late Cretaceous times (Fig. 12). The 107 Ma, 82 Ma and 71 Ma ages are for the dykes DW001, DW002 and DW016, respectively, from the eastern region (Fig. 1e). For the dykes DW001 and DW002, the 107 Ma (Fig. 11a) and 82 Ma (Fig. 11b) ages could only provide an older limit of the emplacement time because there are discordant or concordant zircons possibly indicating an even younger intrusion time (e.g. 80 Ma and 71 Ma) (Fig. 12) or extended magmatic activities. The 71 Ma age for the dyke DW016 (Fig. 11d) is derived from averaging the five youngest concordant data points from the dykes DW002 and DW016 (Fig. 12). The 98 Ma and 94 Ma ages are for the dykes DW025 and DW034, respectively, from the western region (Fig. 1c). The 98 Ma age is a lower intercept age (Fig. 12) derived from combining the one discordant data point (206Pb–238U age: 99.6 ± 0.8 Ma) of DW025 (Fig. 11g) with the four most discordant data points of DW034 (Fig. 11i) given the two dykes are adjacent (Fig. 1c). Again this age could only provide an older limit owing to the uncertainty in defining the discordia. For example, the dyke DW025 could be emplaced later at c. 94 Ma coeval with the dyke DW034. These ages may be applied to other dykes with similar attitudes (Fig. 1f). Nevertheless, considering these dykes occur along pre-existing fractures, caution should be excised in doing so.
5.b. Origin
Before discussing the origin of the dyke swarms, it is necessary to evaluate on the effects of the later alteration because some samples show such phenomena (e.g. Fig. 3d, e). The alteration may in part reflect the relatively large loss on ignition (LOI) (Fig. 5r) of several dyke samples, although this is also typical of arc magmas. Some mobile elements, like Ca, Na, K, P, Sr, Si, etc., may be redistributed in the alteration processes as shown by some scatters in the bi-variation diagrams (Figs 4, 5), but the general coherent trends (e.g. Ca, Na, K and Si) displayed by most samples exclude substantial modification. Besides, it is not excluded that the scatters are a primary features of the dyke geochemistry as inferred from the dacitic, lamprophyric and basanitic rocks as well as the basaltic and andesitic rocks with OIB characteristics that show the largest separation from the main data group (Figs 4, 5). In the following discussion, trace elements (especially those immobile) are mostly employed, which are the least disturbed by low-grade metamorphic or alteration processes as indicated by the general parallelism in distribution diagrams (Fig. 6). Scatters in these immobile trace elements (e.g. Figs 5m–q, 7) and especially their ratios (e.g. Figs 7c, 13a) are more possibly derived from a source difference than the later alteration.
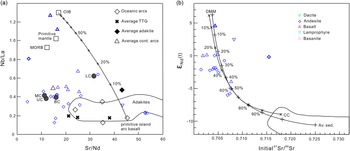
(a) Nb/La versus Sr/Nd diagram. Mixing cure is between OIB (oceanic island basalt) and a primitive island arc basalt (Kemp & Hawkesworth, Reference Kemp, Hawkesworth, Holland and Turekian2003). (b) ϵNd (initial) versus initial 87Sr/86Sr. The two mix curves show various proportions (in percentage) of mixing between depleted MORB mantle (DMM) and crustal component (CC; McCulloch & Chappell, Reference McCulloch and Chappell1982) and Av. sed. (average Ordovician turbidite in Lachlan fold belt, southeastern Australia; Kemp & Hawkesworth, Reference Kemp, Hawkesworth, Holland and Turekian2003). Also shown for comparison are the primitive mantle, MORB (mid-oceanic ridge basalt), BC (bulk continent crust), UC (upper crust), MC (middle crust) and LC (lower crust). The symbols with a thick frame indicate the two basalts and one basaltic andesite with OIB trace-element characteristics.

The majority of the dykes analysed show trace-element patterns with notable negative anomalies in Nb and Ta and positive anomalies in Pb (Fig. 6a, c) resembling the characteristics of continental crust or arc-related assemblages. This raises the question of whether the dyke magmas are significantly contaminated by materials from the continental crust. Though in minor amounts, the existence of inherited zircons, especially those with ages coeval to the Jurassic to Early Cretaceous granites (Fig. 12), indicates some extent of contamination or assimilation of the dyke magmas by the crustal materials. The survival of inherited zircons apparently reflects the sluggish kinetics of this mineral during rapid cooling of melts ascending through the crust such that there is not enough time for its dissolution. The crustal contamination may partially cause scattering in ratios of incompatible trace elements like Sr/Nd and Nb/La (Fig. 13a) (e.g. McCulloch & Chappell, Reference McCulloch and Chappell1982; Kemp & Hawkesworth, Reference Kemp, Hawkesworth, Holland and Turekian2003; Kelemen et al. Reference Kelemen, Hanghoj, Greene, Holland and Turekian2003), in which most samples disperse from the mix curve of OIB and primitive intra-oceanic arc basalts to various crustal members. A similar pattern is also recorded in the Sr–Nd isotopic variation where the samples seem to extend from depleted mantle magmas to evolved crustal components (Fig. 13b) (e.g. McCulloch & Chappell, Reference McCulloch and Chappell1982; Kemp & Hawkesworth, Reference Kemp, Hawkesworth, Holland and Turekian2003). However, the inference is not conclusive because the dispersion of either trace-element (Fig. 13a) or isotope (Fig. 13b) data can be equally explained by the involvement of a subduction component (EMII) (Fig. 8) (e.g. Kelemen et al. Reference Kelemen, Hanghoj, Greene, Holland and Turekian2003; Kemp & Hawkesworth, Reference Kemp, Hawkesworth, Holland and Turekian2003). At least the ratios of Th/Yb and Ta/Yb (Fig. 7c) are not significantly affected by the crustal contamination as also suggested by the relatively primordial geochemical signatures (Figs 8a, 13a) of the three dacites and the basaltic and andesitic rocks with an OIB affinity that tend to form isolated groups (Figs 7a–c, 13a). Therefore, albeit limited crustal contamination (plus the later alteration) is not excluded, its presence is apparently not enough to largely camouflage the primary geochemical signals, from which source heterogeneity can be deduced (see the following). Besides the crustal contamination and source heterogeneity, extreme fractionation crystallization and partial melting can also cause scattering in incompatible element ratios. The latter two processes which have general parallel trends (Kemp & Hawkesworth, Reference Kemp, Hawkesworth, Holland and Turekian2003) are not considered responsible here because the moderate to high MgO or Mg no. of most samples analysed here (Fig. 5a) only signify modest extents of fractional crystallization or partial melting that would cause nearly constant ratios between them (Kerr, Reference Kerr, Holland and Turekian2003; Hofmann, Reference Hofmann, Holland and Turekian2003; Klein, Reference Klein, Holland and Turekian2003; Kemp & Hawkesworth, Reference Kemp, Hawkesworth, Holland and Turekian2003).
Another concern is whether the lower crust is a direct source region for the dyke swarms. For example, the melting or anatexis of mafic lithologies (such as amphibolite, granulite, eclogite and gabbro cumulates) in the lower crust can account for the overall levelling-off of the HREEs in most samples (Fig. 6b) and with residual garnet can explain the fractionated MREEs and HREEs in some samples (Fig. 6d, f). The neodymium model ages (c. 1.0 Ga) relative to depleted mantle (Fig. 9) being much older than their emplacement ages (c. 107−71 Ma) is consistent with remelting of such basement materials as the mafic rocks newly accreted during the Grenvillian orogeny (e.g. Wang et al. Reference Wang, Xu, Hu, Yu, Wu, Zhang, Cai, Shan, Hou and Chen2015). However, the model needs to be enabled in the stability field of plagioclase (<40 km), which would mean residual or fractional crystallization of this mineral during melt extraction and, in turn, the generation of a negative Eu anomaly in the resultant magmas (e.g. Kemp & Hawkesworth, Reference Kemp, Hawkesworth, Holland and Turekian2003). Nevertheless, the REE distributions of the dykes are generally devoid of this signal except for one (Fig. 6b, d, f). The general absence of the negative Eu anomalies may be due to high H2O contents (high f H2O) that can suppress saturation of plagioclase (e.g. Sisson & Grove, Reference Sisson and Grove1993 a,b). Further, the relative high H2O concentrations also mean a relatively oxidized (high fO2) state (e.g. Kemp & Hawkesworth, Reference Kemp, Hawkesworth, Holland and Turekian2003) that would favour three valence Eu3+ like the other REEs, which is incompatible in plagioclase and thus not affected by fractionation of this mineral even if this happens. However, there is an absence of a clear correlation trend between Eu and LOI, even considering only those samples with LOI <4 % (Fig. 5r), thus negating the feasibility of these processes. Besides, though partial melting of mafic lithologies may account for a few samples with evolved compositions, e.g. those with Mg no. <50 (Fig. 5a) (Martin, Reference Martin1999), it is hard to reconcile the samples with Mg no. >50 (especially the three dacites) and the samples with Mg no. <50 but without Nb and Ta anomalies (the basaltic and andesitic rocks with OIB features), which apparently need equilibrium with mantle peridotites. As such, the older neodymium model ages are largely a feature of mantle source regions, which may be affected by the crustal materials to various extents.
Alternatively, the absence of plagioclase fractionation indicates melts derived from a depth below the stability field (>30–40 km) of this mineral (e.g. White, Reference White2001), that is, mantle given the general thin Late Cretaceous continental crust of the South China Block (e.g. Zhou & Li, Reference Li2000). At least the primordial initial ϵNd values (>0) shown by partial samples (Fig. 13b) are congruent with the inference of newly accreted materials from depleted mantle. As such, the relatively flat HREE pattern associated with most samples (Fig. 6b) can be interpreted as representing partial melts in equilibrium with spinel peridotite (Kelemen et al. Reference Kelemen, Hanghoj, Greene, Holland and Turekian2003) where the residue is made up of olivine, clinopyroxene and orthopyroxene. The notable Nb–Ta negative anomalies and Pb positive anomalies (Fig. 6a) are signs of extensive involvement of subduction-related components (fluids or/and melts) in the mantle wedge. In contrast, those dykes with much more fractionated MREEs and HREEs (Fig. 6d, f) can arise from partial melts in the stability field of garnet at a depth greater than 80 km (e.g. Hofmann, Reference Hofmann, Holland and Turekian2003). This is the case for the dacitic dykes with the adakitic characteristics (Fig. 6c, d) that are generally ascribed to partial melting of subducted basalts in the eclogite facies with garnet (± Fe–Ti oxides ± hornblende) in the residual phases (e.g. Martin, Reference Martin1999). Their high Mg no. (>50) (Fig. 5a) is a result of equilibration with peridotites in the mantle wedge, as indicated by the large phenocrysts of plagioclase and pyroxene (Fig. 3h), which may also potentially impart the relatively high Nd and low Sr isotope signatures (Fig. 13b). On the other hand, those basaltic and andesitic dykes with the OIB characteristics (Fig. 6e) represent partial melting of a relatively enriched provenance, like asthenospheric mantle (e.g. Defant & Drummond, Reference Defant and Drummond1993; Martin, Reference Martin1999). This is true for the andesitic dyke DW025-1, which also shows Ba, Sr and Ti negative anomalies due to a large extent of fractional crystallization as indicated by its lowest Mg no. (23) (Fig. 5a). But paradoxically, the fact that this group also possesses high initial ϵNd values (Fig. 13b) indicates that the source is still depleted in previous melt extraction. The positive Pb anomaly (Fig. 6e), though subdued, associated with the basaltic dykes DW011-2 and DW013 of this group is a signal of limited involvement of fluids derived from subduction slabs. Thus, the dyke swarms seem to originate from heterogeneous mantle sources (e.g. Hofmann, Reference Hofmann, Holland and Turekian2003) such as depleted mantle fertilized by slab-derived fluids or melts, subducted oceanic slab and asthenospheric mantle, which, however, are still subduction related in general. The difference in mantle source region may partially explain the spatial coexistence of these three groups of dykes though they are not necessarily emplaced in the same location or in the same time period.
Therefore, the dyke swarms are largely derivatives of partial melts of the depleted mantle already subduction modified (e.g. Li et al. Reference Li, Hu and Rao1997; Li, Reference Li2000), e.g. metasomatized by mobile phases of fluids or melts from subducted oceanic slab with a sediment veneer (Schmidt & Poli, Reference Schmidt, Poli, Holland and Turekian2003). Such slab-derived melts are represented by the dacitic dykes with adakitic features (Fig. 6c, d). The positive correlation of CaO with either MgO (Fig. 5d) or Sc (Fig. 5m) of most samples is indicative of crystal fractionation of clinopyroxene, which is also evidenced by abundant phenocrysts of this mineral (Fig. 3a–c, e). This combined with the absence of olivine phenocrysts indicates that primary magma is in a reaction relationship with olivine (orthopyroxene + clinopyroxene + spinel = olivine + melt) (e.g. Kelemen et al. Reference Kelemen, Hanghoj, Greene, Holland and Turekian2003). Such melts are in equilibrium with olivine, but will not crystallize olivine upon isobaric cooling, and instead will crystallize websterite (two-pyroxene pyroxenite) (Fig. 5a). The positive correlation of MgO with Ni (Fig. 5j) or Cr (Fig. 5k) is consistent with various absorption of olivine. The melts such formed may underplate the lower crust (Zhou & Li, Reference Li2000) or be stored in crustal magma chambers to assimilate surrounding materials, or entrain wall rocks during their rapid ascent through faults such that they pick up signals of continental crust. The scale of such magmas is not likely large, otherwise the heat released would induce crustal melting to produce coeval large-scale arc-related I-type calc-alkaline granitic plutons like those emplaced in Early Cretaceous time (e.g. Zhou et al. Reference Zhou, Sun, Shen, Shu and Niu2006), which however are generally absent in the study regions. Therefore, these dyke swarms seem to be emplaced in a special tectonic setting where subduction was waning and intra-plate magmatism was waxing, in which periodical or intermitted extension created pathways favourable for magma injection or focus.
5.c. Tectonic setting
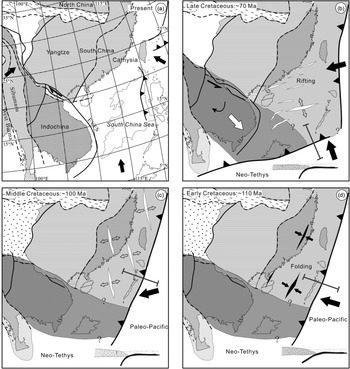
Episodic plate geodynamics around the SE South China Block in late Mesozoic time are responsible for the emplacement of the dyke swarms distributed in coastal Guangdong. The latest Early Cretaceous (c. 110 Ma) dyke swarms are abundant in the southern part of the SE South China Block (e.g. Li et al. Reference Li, Hu and Rao1997; Zhu et al. Reference Zhu, Ling, Shen, Lu, Deng and Tan2008; Dong et al. Reference Dong, Yan, Zhang, Du and Zhu2010) and show a consistent strike of WNW–ESE as is the case here (the dyke DW001; Figs 1f, 2a). These dykes are consistent with a WNW–ESE orientation of compression caused by the low-angle subduction of the Palaeo-Pacific plate in latest Early Cretaceous time (Fig. 14d) (Zhou & Li, Reference Li2000; Zhou et al. Reference Zhou, Sun, Shen, Shu and Niu2006; Li et al. Reference Li, Zhang, Dong and Johnston2014). This process is registered by the contemporaneous (110−100 Ma) high-pressure low-temperature metamorphism in the Yunli ocean–continent suture on the eastern flank of the Central ridge on Taiwan Island (Lo & Yui, Reference Lo and Yui1996). The dyke swarms with ages c. 100 Ma are widespread and have strikes nearly N–S. They are not limited to coastal Guangdong (e.g. the dyke DW025; Figs 1f, 2e), and they also occur in Hainan Island (101−93 Ma) (Ge et al. Reference Ge, Li and Zhou2003; Tang et al. Reference Tang, Chen, Dong, Shen, Cheng and Fu2010; Wang et al. Reference Wang, Li, Jia, Wyman, Tang, Li, Ma, Yang, Jiang and Gou2012; HIGS, 2018), northern Guangdong (105−90 Ma, Li et al. Reference Li, Hu and Rao1997; 90 Ma, Zhu et al. Reference Zhu, Ling, Shen, Lu, Deng and Tan2008) and coastal Fujian–Zhejiang (93 Ma) (Dong et al. Reference Dong, Yan, Zhang, Du and Zhu2010). The corresponding E–W extensional stress regime is also recorded in northeastern Hunan (Zhou et al. Reference Zhou, Xu, Dong, Chi, Deng, Cai, Ning and Wang2021) and even in the Qinling orogen (Cai et al. Reference Cai, Yu, Xu, Gao, Chen, Yu, Jiao, Ye, Zou and Li2020). Therefore, it seems that a prevailing E–W extension dominated the eastern China continent at the time. It is better to contribute this stress regime to the tectonics of the Palaeo-Pacific realm (Fig. 14c). Therefore, from a tectonic perspective, the boundary of the Early to Late Cretaceous possibly marks the onset of a transition from a compressional to extensional regime over the SE South China Block such as induced by the subduction angle change of the Palaeo-Pacific plate from low to high. This change in tectonic regime is much later than the previously suggested transition time from the Jurassic to Cretaceous (e.g. Li et al. Reference Li, Hu and Rao1997; Li, Reference Li2000) and earlier than the time of 73 Ma (Jiang & Li, Reference Jiang and Li2014) or 90 Ma (Li et al. Reference Li, Li, Chung, Li, Xu and Li2012) inferred from granites with arc characteristics.
Cartoons showing schematic evolution of SE Asia in the Cretaceous Period (b–d). The seaward extension of the boundary between the Indochina and South China blocks is hypothetical. EVFS – East Vietnam Fault system.

The youngest (c. 71 Ma) dyke (Fig. 2d) in this study has a strike of nearly E–W, which indicates a nearly N–S extension regime. Those dykes with ages between 98 Ma and 71 Ma have strikes of either NE–SW or NW–SE (Fig. 1f). Note that these dykes occur along fractures that are also present in the surrounding rocks, indicating the pre-existing nature of these structures. Statistics on these dykes reveals a geometric pattern (Fig. 1f) with pretty much symmetry (Morris et al. Reference Morris, Ferrill and Henderson1996; Cai, Reference Cai2019) indicating a stress orientation of N–S extension as well. Considering that this Late Cretaceous stress regime is confined only to the southern part of the South China Block (e.g. Li et al. Reference Li, Zhang, Dong and Johnston2014; Cai et al. Reference Cai, Wu, Xu, Hou, Shan, Zhu and Li2017), thus it is possible that the N–S extension is local and pertains to a tectonic process occurring further to the south, such as the northern subduction of the Neo-Tethys (Fig. 14b) inferred from the arc-related granites in the southern part of Hainan Island (Yuan et al. Reference Yuan, Fang, Zhang and Dong2019) or the southern subduction of a postulated proto-South China Sea beneath the Borneo terrane (Holloway, Reference Holloway1982; Lee & Lawver, Reference Lee and Lawver1995). Of course, it is not totally excluded that this N–S extension regime comes from the E–W compression and thus is related to the Palaeo-Pacific tectonics as well (Fig. 14b), or its subduction direction is in the N–S orientation. It is noted that the sporadic Late Cretaceous magmatic activities are also recorded in Hainan Island (93−73 Ma) (Ge et al. Reference Ge, Li and Zhou2003; Tang et al. Reference Tang, Chen, Dong, Shen, Cheng and Fu2010; Jiang & Li, Reference Jiang and Li2014), coastal Fujian and Zhejiang, and Taiwan Island (97−87 Ma) (Martin et al. Reference Martin, Bonin, Capdevila, Jahn, Lameyre and Wang1994; Li et al. Reference Li, Hu and Rao1997; Li, Reference Li2000; Xing et al. Reference Xing, Chen, Yang, Zhou, Li, Jiang and Chen2009; Ma et al. Reference Ma, Dong, Tang, Lv and Gu2013), the Korean peninsula (94−72 Ma) (Zhang et al. Reference Zhang, Zhai, Hou, Li, Liu and Hu2012) and the Japan arc (90−70 Ma) (Sonehara & Harayama, Reference Sonehara and Harayama2007), which all are attributed to the subduction of the Pacific plate. However, the generally high subduction angle of the Pacific plate in Late Cretaceous time (Zhou & Li, Reference Li2000) precludes a general E–W compression regime inland far away from the subduction front (e.g. Nakamura & Uyeda, Reference Nakamura and Uyeda1980) that was located in Taiwan Island at that time. Considering the large extent of the SE South China Block, it is totally possible that different plate tectonics may have prevailed on its eastern and southern margins, respectively. Anyway, this N–S extension regime has continued into late Tertiary time (30−16 Ma) resulting in the opening of the South China Sea basin with a nearly E–W-trending axis in its earlier development (e.g. Holloway, Reference Holloway1982; Taylor & Hayes, Reference Taylor, Hayes and Hayes1983; Honza & Fujioka, Reference Honza and Fujioka2004).
6. Conclusion
This study reports the dyke swarms distributed in coastal Guangdong. These dykes are mostly basaltic and andesitic rocks with some dacites, and generally they are categorized as high-K calc-alkaline to shoshonite series with a few in the medium-K series. Trace elements of most dykes show typical arc (including adakitic) features, and a few show OIB features. Trace-element ratios and Sr–Nd–Pb isotopes indicate heterogeneous origins, such as depleted sub-arc mantle, subducted oceanic slab and asthenosphere-like enriched mantle, which may be contaminated by continental crustal materials. U–Pb zircon dating reveals latest Early to Late Cretaceous ages (107−71 Ma) for the dyke swarms. The dyke swarms were emplaced in a tectonic setting undergoing a stress regime transition from an E–W to N–S extension, which may pertain to the Palaeo-Pacific and Neo-Tethys tectonics, respectively.
Supplementary material
To view supplementary material for this article, please visit https://doi.org/10.1017/S0016756822000668
Acknowledgements
We would like to thank Prof. Qunshu Tang for his help with the fieldwork. We also thank the two anonymous reviewers and editor for their constructive suggestions that significantly improved the manuscript. This study is supported by the National Natural Science Foundation of China (Grant No. 41572184) and Key Special Project for Introduced Talents Team of Southern Marine Science and Engineering Guangdong Laboratory (Guangzhou) (GML2019ZD0204).