I. INTRODUCTION
GaN high electron mobility transistor (HEMT) technologies demonstrate very interesting capabilities for RF and microwaves power applications thanks to its high breakdown electric field and high spontaneous and piezoelectric polarizations enabling high current densities [Reference Crespo1–Reference Dadgar3]. Nevertheless, devices still suffer from limitations of their RF performances, especially at microwave and millimetre-wave frequencies, when it becomes necessary to reduce short channel effects and achieve high transconductance values to keep high microwave gain. Under high drain bias voltages, these conditions lead to high field area at the gate edge in the gate-drain region. This contributes to increase trapping effects and to degrade transistor performances denoted by current collapse, power slump, or even bias current variations during operation. Preliminary studies realized in our laboratory on InAlN-based heterostructures allowed us to achieve promising results reaching up to 12.5 W/mm at 18 GHz, [Reference Piotrowicz4]. Thanks to its high breakdown electric field and high spontaneous polarization enabling high current densities with a thin lattice matched barrier layer [Reference Jardel2], InAlN HEMT should allow the achievement of devices exhibiting high current densities and very good power performances at millimetre-wave frequencies [Reference Tirelli, Marti, Lugani, Carlin, Grandjean and Bolognesi5, Reference Niida6]. In this paper, we present results obtained on 0.15 µm gate length InAlGaN/GaN devices. To improve two-dimensional electron gas (2-DEG) confinement of these devices having a high sheet carrier density and a short gate length, a patented AlGaN back-barrier was introduced in the HEMT buffer structure. This buffer was designed and optimized thanks to technology computer aided design (TCAD) simulations in order to improve pinch-off characteristics and to minimize the thermal impact added by the back-barrier [Reference Kuzmík7]. In the following sections, we present the HEMT structure and the associated technology process, and the TCAD simulations used for buffer design. Measurements presented include I–V curves in the static and pulsed regime, small signal S-parameters, and large signal load-pull results at 30 GHz.
II. InAlGaN/GaN HEMT TECHNOLOGY
A) HEMT heterostructure
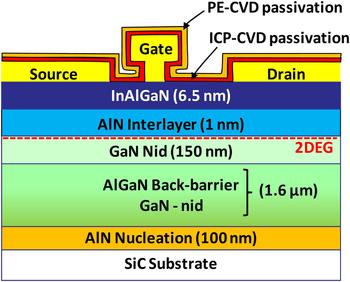
The InAlGaN/AlN/GaN heterostructure studied is presented in Fig. 1. The HEMT structure was grown by low-pressure metal-organic vapor phase epitaxy (MOVPE) on a 3-in. SiC semi-insulating substrate. The heterostructure consists of a 100 nm-thick AlN nucleation layer, a 1.6 µm-thick patented highly resistive buffer layer incorporating an AlGaN back-barrier. Then, the structure is constituted of a 150 nm non-intentionally doped GaN layer followed by the barrier layer composed of a 1 nm thick AlN interlayer and a 6.5 nm-thick undoped InAlGaN layer. The 2-DEG is located at the interface of the non-intentionally doped GaN layer and the barrier layer. The quaternary barrier InAlGaN results from the incorporation of Ga atoms into nominal InAlN films, without the introduction of any Ga precursor in the growth chamber [Reference Ben Ammar8]. The compositional estimates of such barrier, performed by XPS and micro-Auger, yield a Ga content of about 8–10% and an In content ranging from 10 to 12%. Contactless resistance measurements made with an eddy current probe system, before the beginning of the transistor process, gave a sheet resistance and a sheet carrier density of respectively, 270 Ω/sq and 1.6.1013 cm−2.
Cross-section of the heterostructure of fabricated devices.

B) HEMT process description
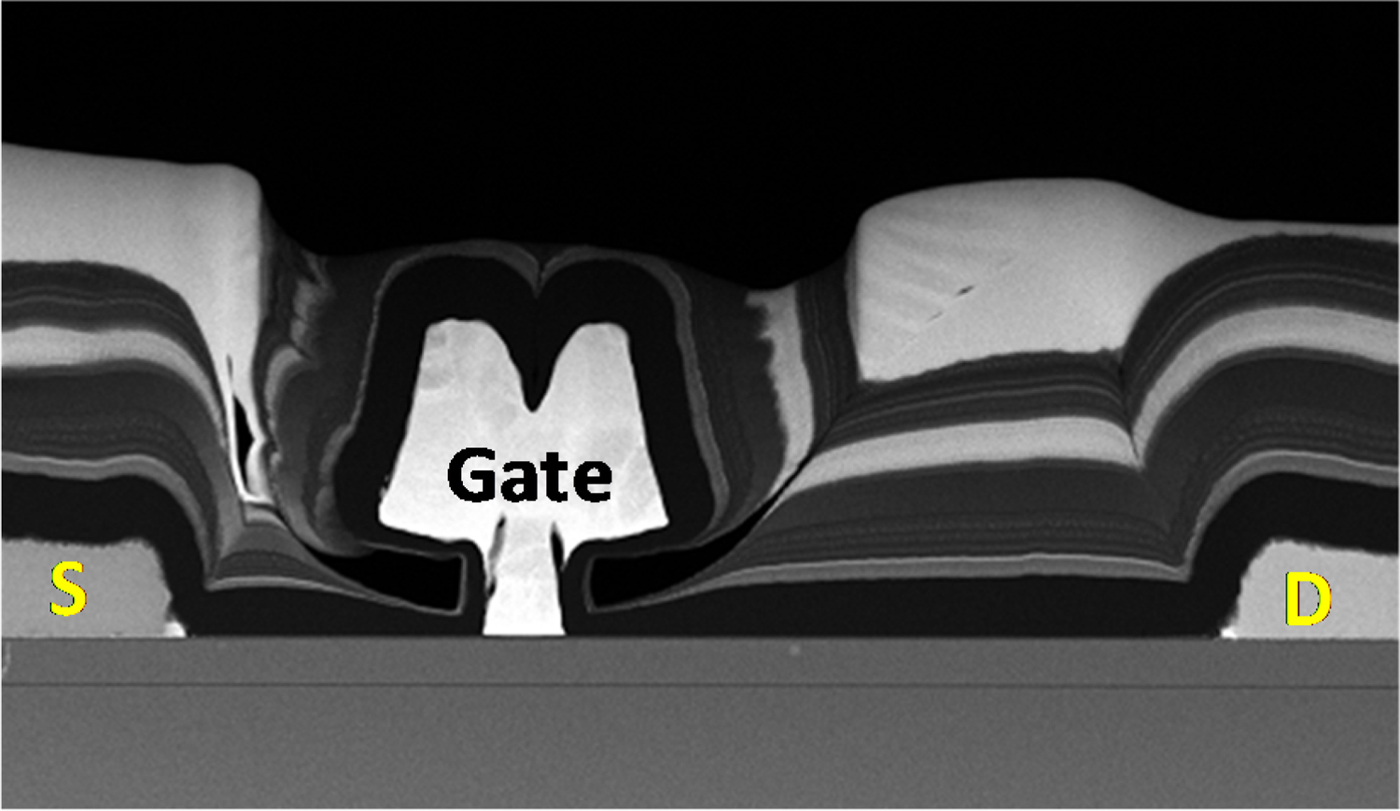
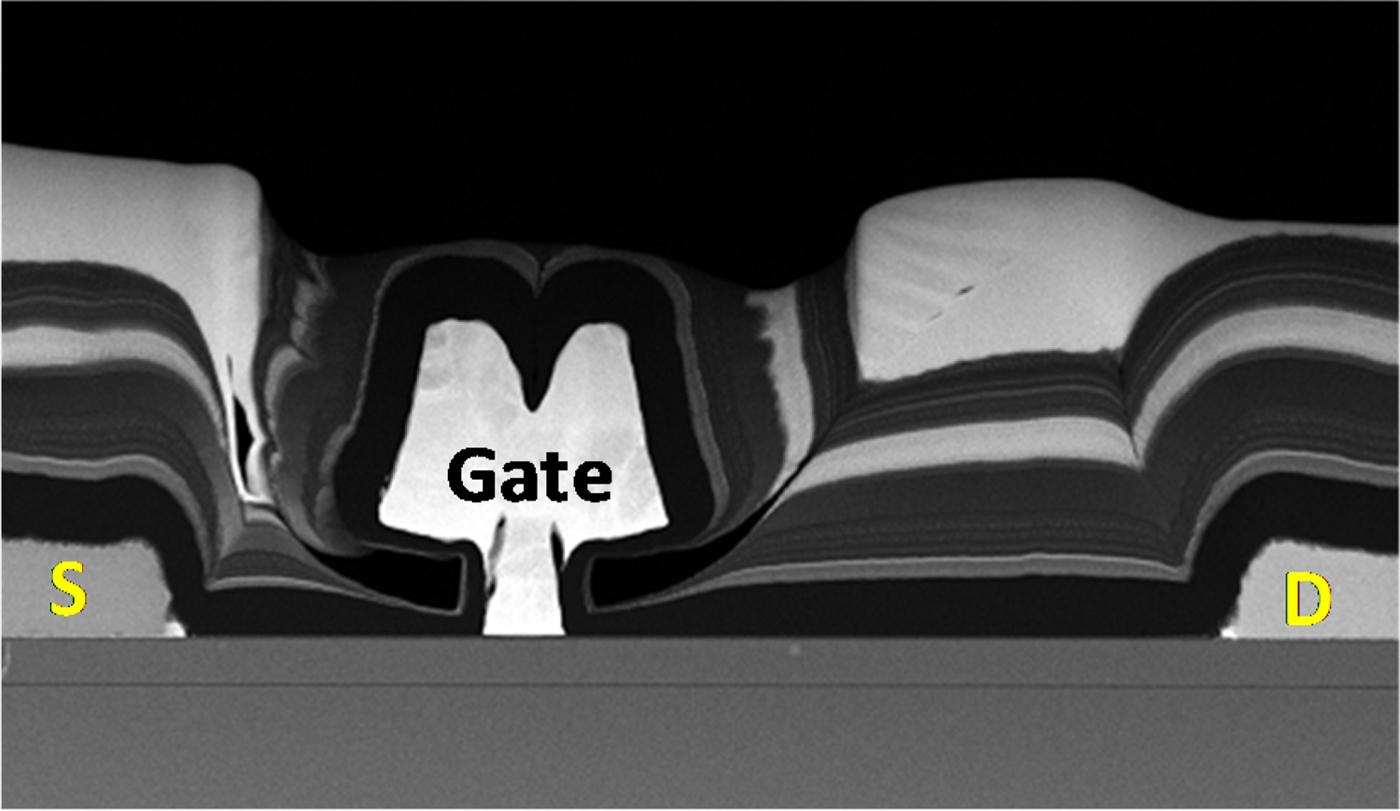
The first process step consists in Titanium-based alignment marks deposition, followed by ohmic contacts formation thanks to Ti/Al/Ni/Au/Ti/Pt multilayer metals stack based on auto-alignment recess with chlorine plasma. The annealing of the ohmic contacts is performed at 850°C during 60 s under nitrogen ambient. An average 0.5 Ω.mm contact resistance is routinely measured. Afterward, argon ion implantation was used for device electrical isolation. The Pt/Au 150 nm length mushroom gate contacts were formed by e-gun evaporation after electron beam lithography (Fig. 2). Devices were then passivated by a 150 nm Si3N4 bi-layer deposited by soft chemical vapor deposition (ICP-CVD) and plasma enhanced chemical vapor deposition (PECVD). A Ti/Pt/Au multilayer deposited by e-gun evaporation was used as interconnection. Multifinger device 3D interconnections were fabricated with plated gold bridge technology.
Cross section SEM image for a 150 nm gate length HEMT device.
III. BUFFER DESIGN BY TCAD
To avoid punch through effects [Reference Uren9] and maintain an efficient control of the 2-DEG with respect to the V GS voltage, the buffer layer should be carefully designed.
One approach consists in incorporating in the buffer layer iron doping [Reference Uren10, Reference Heikman, Keller, DenBaars and Mishra11]. This is a very efficient solution to obtain a good pinch-off. Nevertheless, the temporal evolution of the iron during the de-trapping process can be a drawback in some applications. Another approach consists in using the piezoelectric properties of GaN and AlGaN materials. Several papers have been already reported where GaN devices incorporate AlGaN back-barriers with Al contents in the range of 4–8% [Reference Lee, Piedra, Sun, Gao, Guo and Palacios12–Reference Kamath14].
Nevertheless, at this level of aluminum contents, the back-barrier thickness considerably degrades the thermal conductivity of the buffer layer, which is detrimental for RF power GaN devices [Reference Kuzmík7]. In our patented approach, we took care of this constraint from the design phase of the back-barrier in order to minimize the thermal impact of the whole buffer.
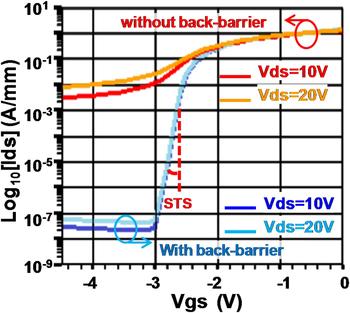
To optimize our buffer, we used TCAD. Figure 3 shows the simulated drain current I DS in log scale versus the V GS gate voltage of a 0.15 µm gate length HEMT device with and without AlGaN back-barrier, for drain voltages V DS of 10 and 20 V. The case without back-barrier is referring to a buffer layer constituted by GaN-Nid. In this case, the pinch-off is poor and the drain current in off-state is very high (>1 mA/mm). With the use of the AlGaN back-barrier, the I ON/I OFF ratio is strongly improved, the pinch-off voltage is −2.6 V at a drain current density of 1 mA/mm. The sub-threshold swing (STS) calculated from these graphs is 100 mV/decade independently of the V DS voltages of 10 or 20 V.
Simulations (TCAD) of the drain current versus the V GS voltage for a 0.15 µm gate length device with or without AlGaN back barrier and for V DS voltages of 10 and 20 V.

IV. MEASUREMENTS
A) DC characteristics
DC measurements were performed, on-wafer, on 2 × 50 × 0.15 µm3 devices. Figure 4 points out a drain current I DS+ measured at V GS = +1 V and V DS = 10 V very close to 1.3 A/mm (median value measured on approximately 10 different devices). The gate reverses leakage current density measured at V GS = −7 V and V DS = 5 V was in the range of 200 µA/mm. The pinch-off voltage, measured at V DS = 10 V, and I DS of 1 mA/mm, is close to −2.9 V. This value is close to the one predicted by TCAD simulations.
DC measurements from 2 × 50 × 0.15 µm2 devices: I DS+ at V GS = +1 V, V DS = +10 V, Gate leakage current IGleak measured at V GS = −7 V, V DS = 5 V and pinch-off voltage V p measured at V DS = 10 V and I DS = 1 mA/mm.

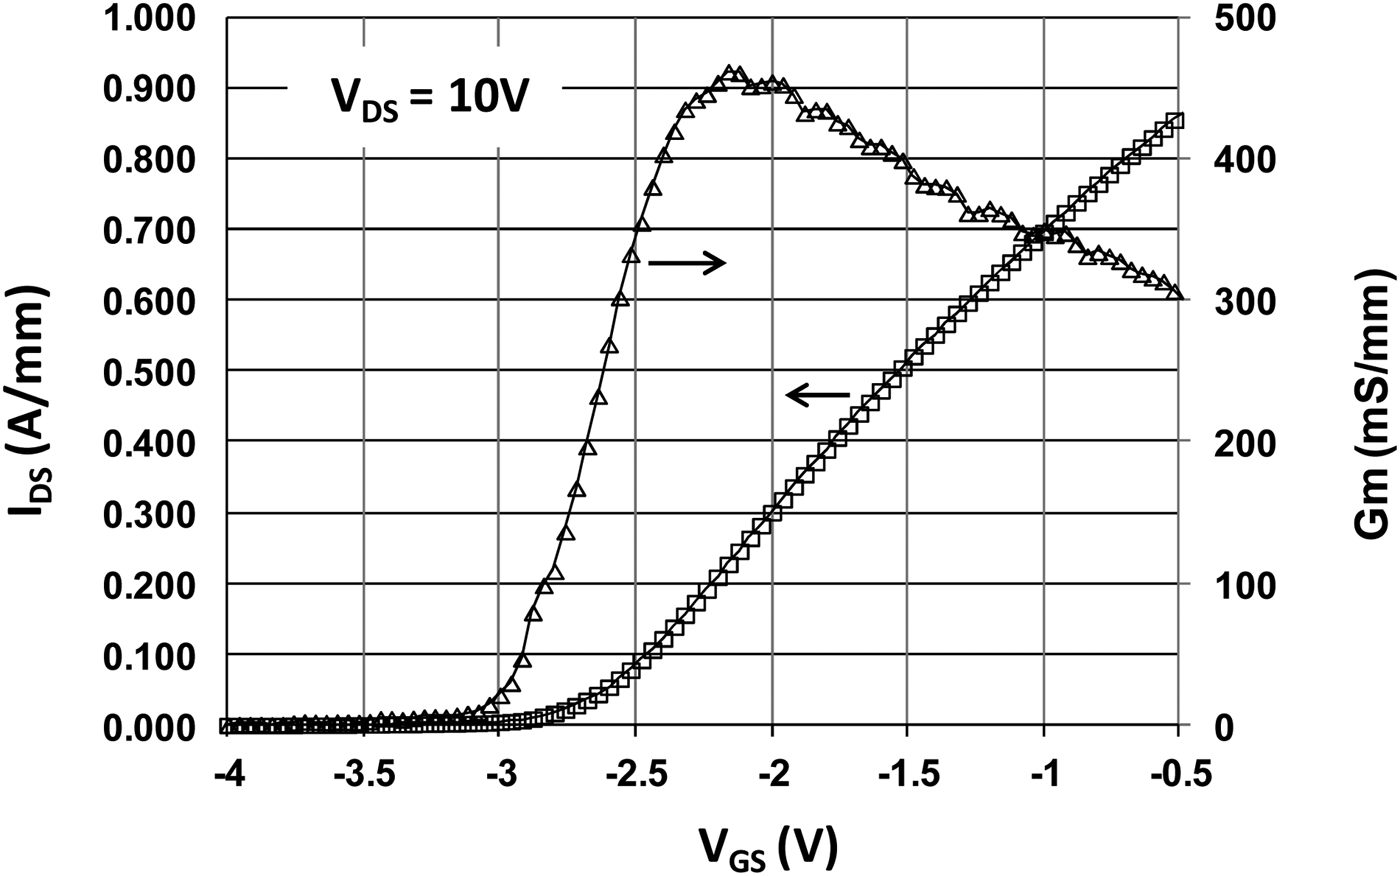
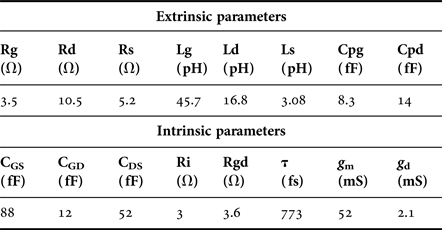
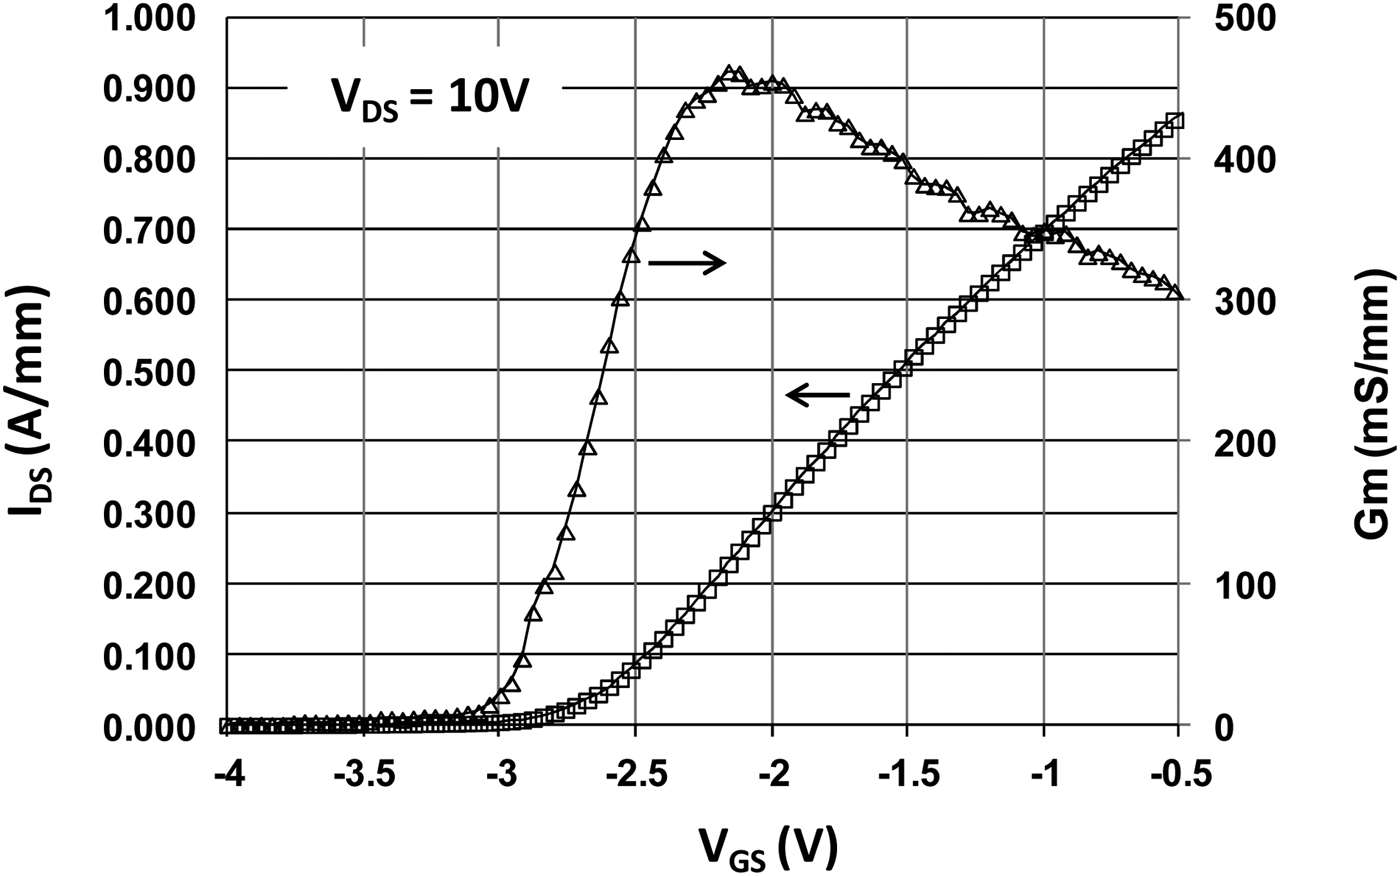
Figure 5 gives the evolution of the drain current density and extrinsic transconductance G m, in linear scale, measured versus the V GS voltage for V DS = 10 V (within the reference-plane of the probes). The maximum extrinsic transconductance obtained at V GS = −2.2 V is 450 mS/mm. Given the formula eq. (1) and the extracted value of the source resistance R s (cf Table 1) the intrinsic maximum transconductance is Gmi 585 mS/mm. The high value of the transconductance is another good indicator of the efficiency of the back-barrier. Nevertheless, it is necessary to focus on V GS values closer to the pinch-off to have a better comparison with initial TCAD simulations.
 $$G_{mi} = \displaystyle{{G_m} \over {(1 - G_m \cdot R_s )}}.$$
Drain current I DS and transconductance G m at V DS = 10 V versus V GS.
Small-signal equivalent circuit elements of a 2 × 50 × 0.15 µm3 transistor biased at V ds = 20 V and I dsq = 200 mA/mm.

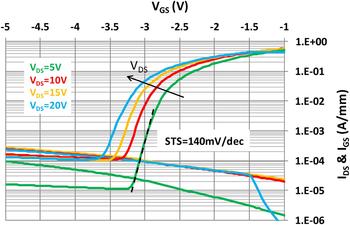
In order to do so, additional measurements were performed to investigate the influence of the drain voltage on the back-barrier efficiency. Gate and drain currents were measured versus V GS voltage and are plotted in a logarithm scale for V DS voltages from V DS = 5 to V DS = 20 V on Fig. 6.
DC transfer characteristics for V DS voltages from 5 to 20 V of 0.15 µm gate length device.

Due to the high level of drain current density during these DC measurements, a compliance level of the dissipated power (I DS × V DS) was set to 9 W/mm. It occurred for the trace measured at V DS = 20 V. In this case, the apparatus limited the drain current and reduced the applied drain voltage resulting in a decrease of the associated gate current (see the blue curve for V GS higher than −1.5 V). Figure 6 shows that a good pinch-off from V DS = 5 to V DS = 20 V is achieved demonstrating the efficiency of the back-barrier to confine the electrons in the channel. Nevertheless, we observe a shift of the pinch-off voltage from −2.9 to −3.45 V (at 1 mA/mm), which is not present on TCAD simulations. This can be attributed to traps below the gate at the semi-conductor interface or in the barrier layer below the gate, which was not taken into account in the TCAD simulations. The gate leakage current remains below 0.5 mA/mm.
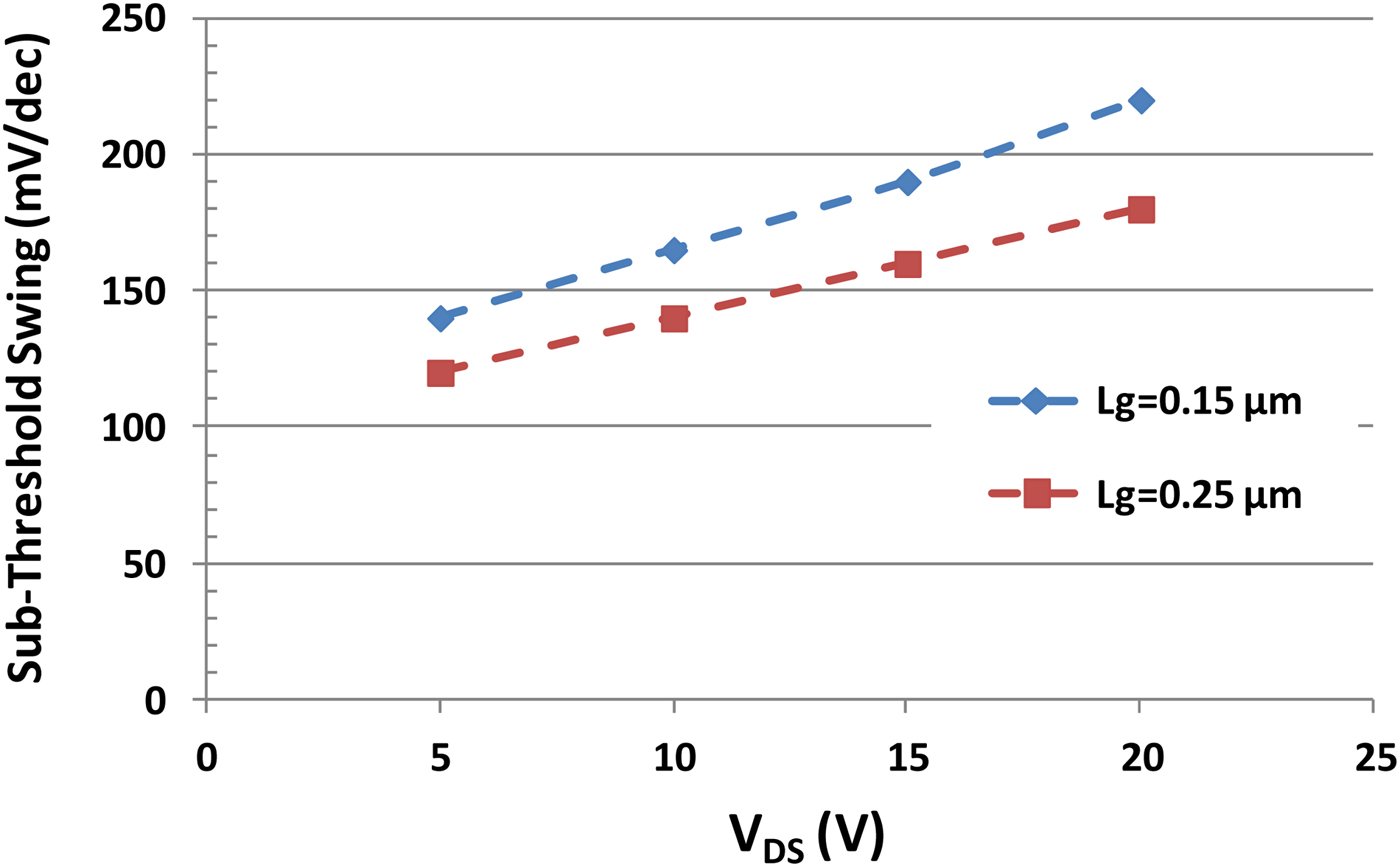
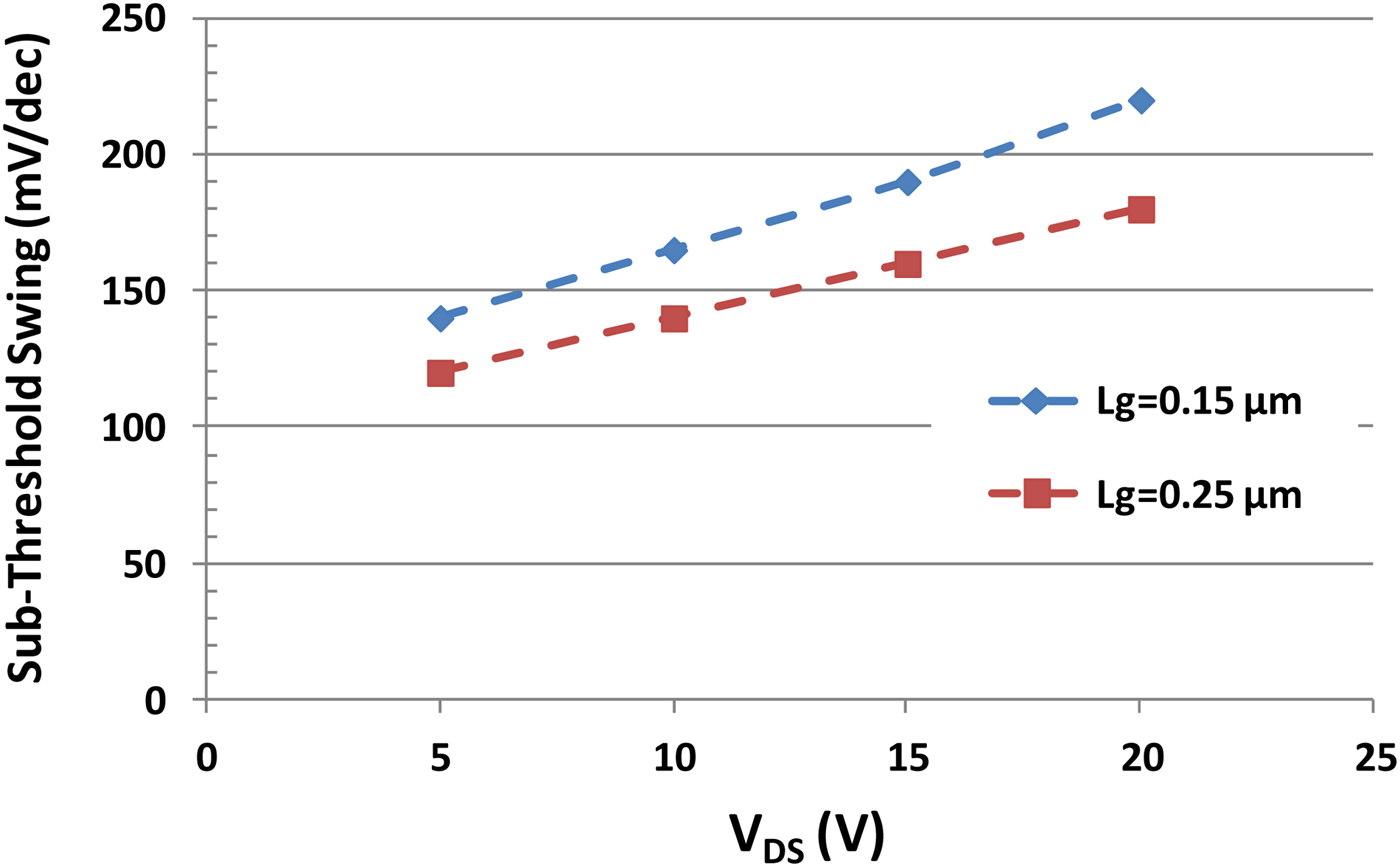
For each curve of Fig. 6, we extracted the STS near the pinch-off and we reported the obtained values in Fig. 7. We also reported STS values for devices realized on the same wafer but processed with a slightly longer gate length of 0.25 µm. For the 0.15 µm gate length device, at a drain voltage of 5 V, the sub-threshold swing is 140 mV/dec while at a drain voltage of 20 V, the sub-threshold swing increases to 220 mV/dec. Despite this increase, 220 mV/dec is still an acceptable value taking into account the drain current density of 1.3 A/mm and the drain voltage of 20 V. Devices realized with a longer gate of 0.25 µm show slightly better pinch-off characteristics with improved sub-threshold swings. Even if the measured STS values are slightly higher than simulated one (100 mV/dec was expected by simulation) and the increase of sub-threshold swings versus V DS was not predicted by initial simulations, the measurements confirm the efficiency of our back-barrier buffer layer to confine the electrons in the 2-DEG with devices designed for gate length as short as 0.15 µm. These results also demonstrate that TCAD simulations are an efficient tool to improve GaN HEMTs performances.
Sub-threshold swing (STS) for 0.15 and 0.25 µm gate length devices versus V DS voltage.
B) Pulsed measurements
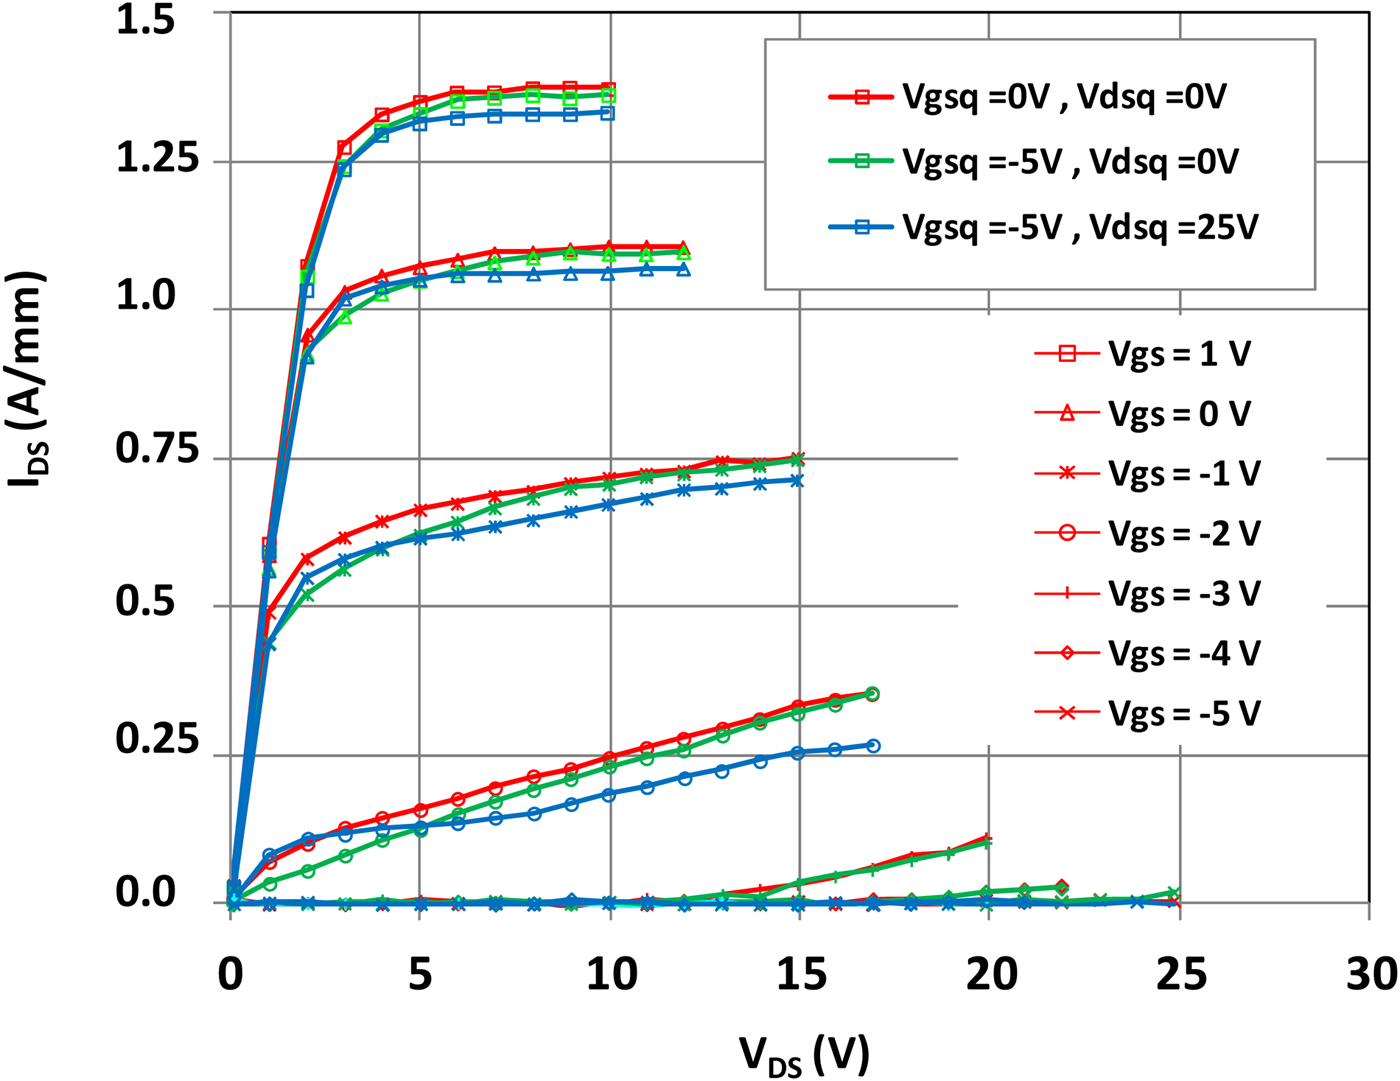
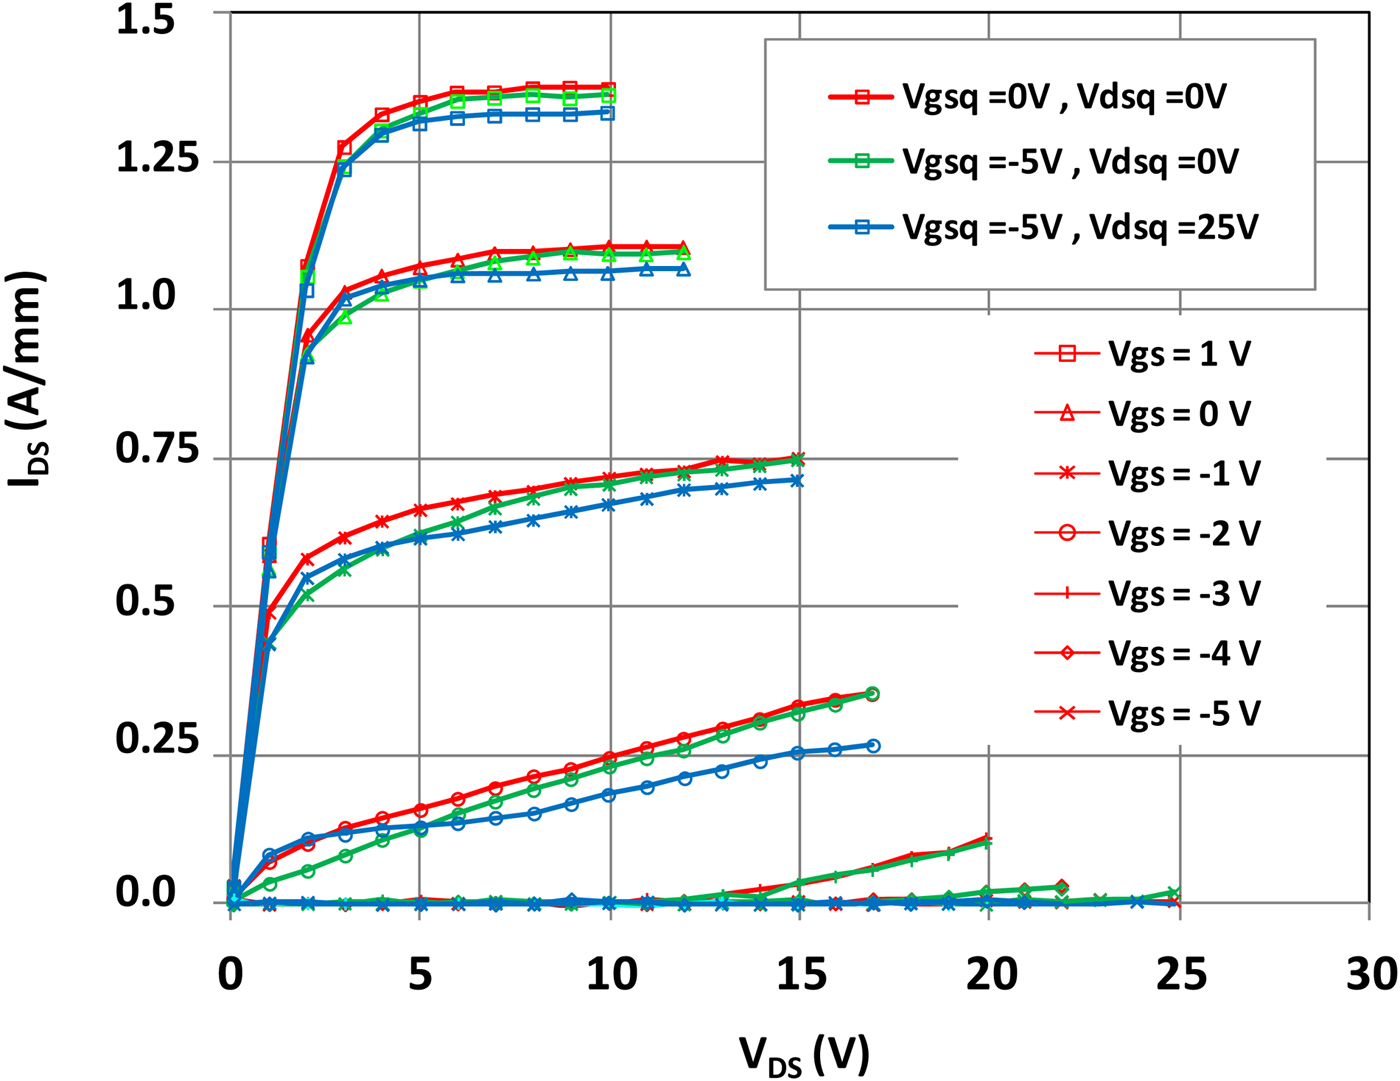
In order to evaluate the trapping effects, pulsed measurements were realized for three different quiescent bias points. Starting from the quiescent point (V GSq, V DSq) = (0,0)V, a maximum drain current of 1.3 A/mm is obtained at V GSi = +1 V. Then, pulses were applied from the quiescent bias point (V GSq, V DSq) = (−5,0)V and (V GSq, V DSq) = (−5,25)V in order to highlight current collapse phenomena (Fig. 8) related to the variation of the gate voltage (“gate lag”) or to the drain voltage (“drain lag”). No significant degradation of the ON-state resistance R ON is observed and the drain current remains very close to the one obtained from the quiescent point (V GSq, V DSq) = (0,0)V indicating low trapping effects even under a drain quiescent voltage of 25 V.
Pulsed I–V characteristics for three quiescent bias points: (V GSq = 0 V, V DSq = 0 V – red curves), (V GSq = −5 V, V DSq = 0 V – green curves) and (V GSq = −5 V, V DSq = 25 V– blue curves).
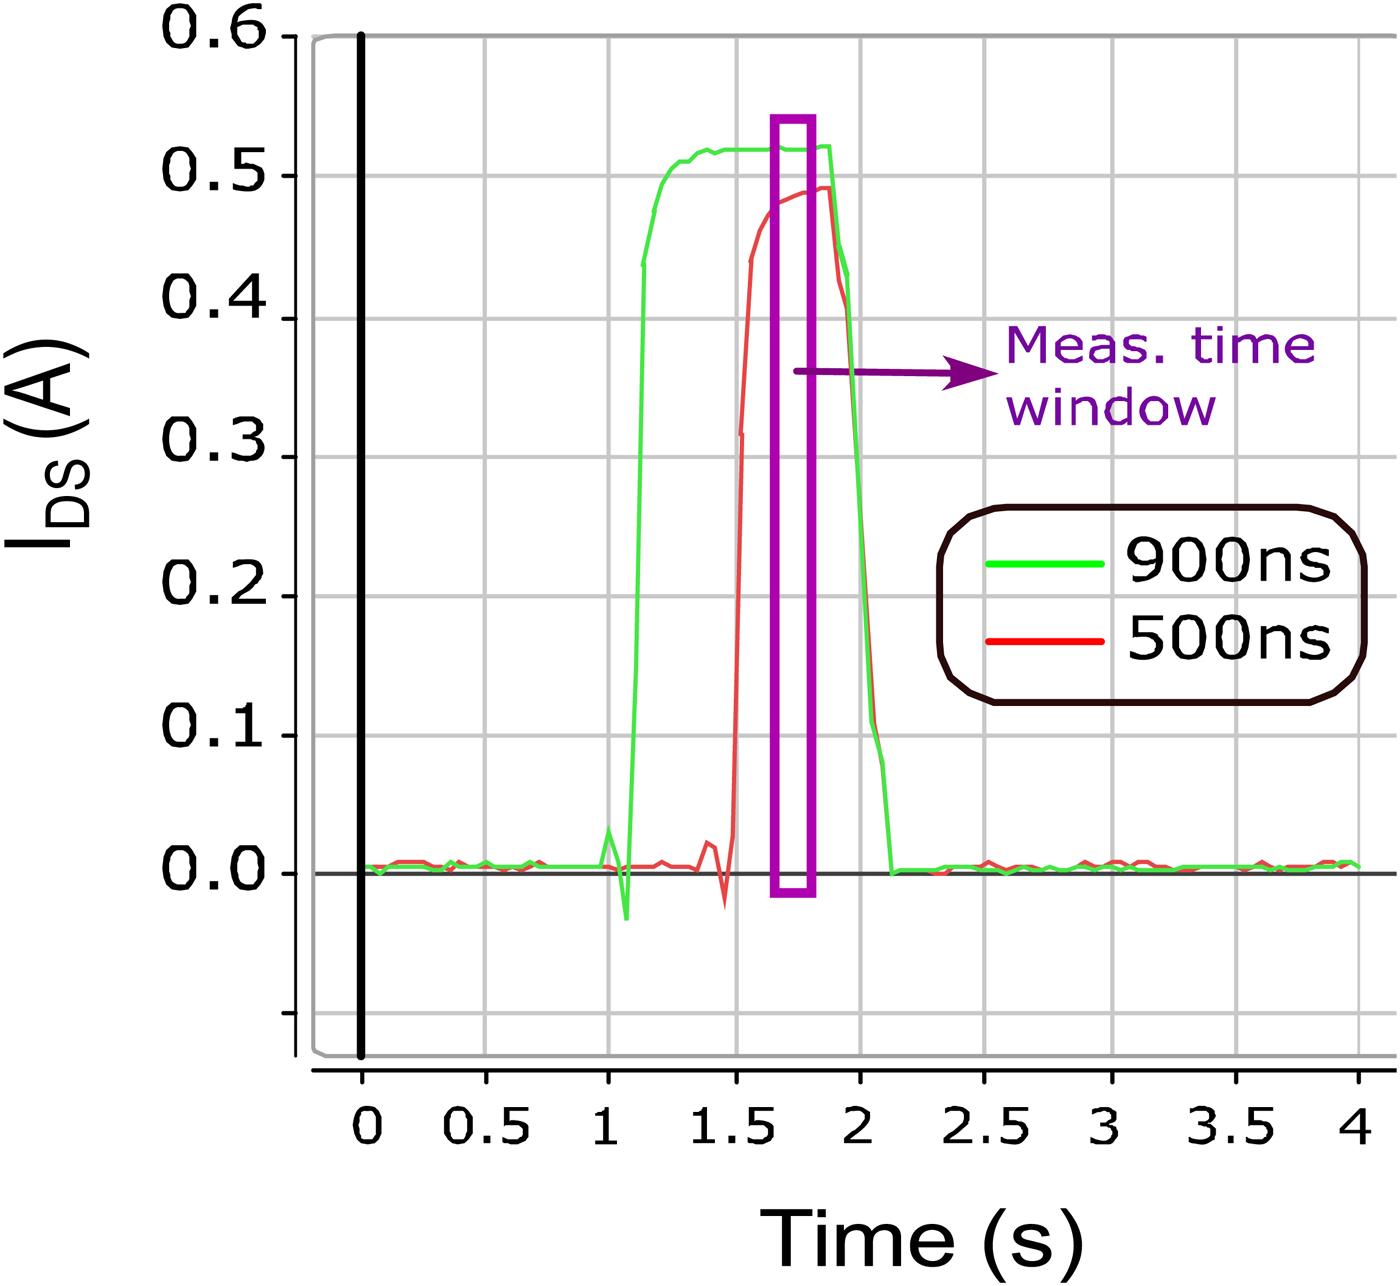
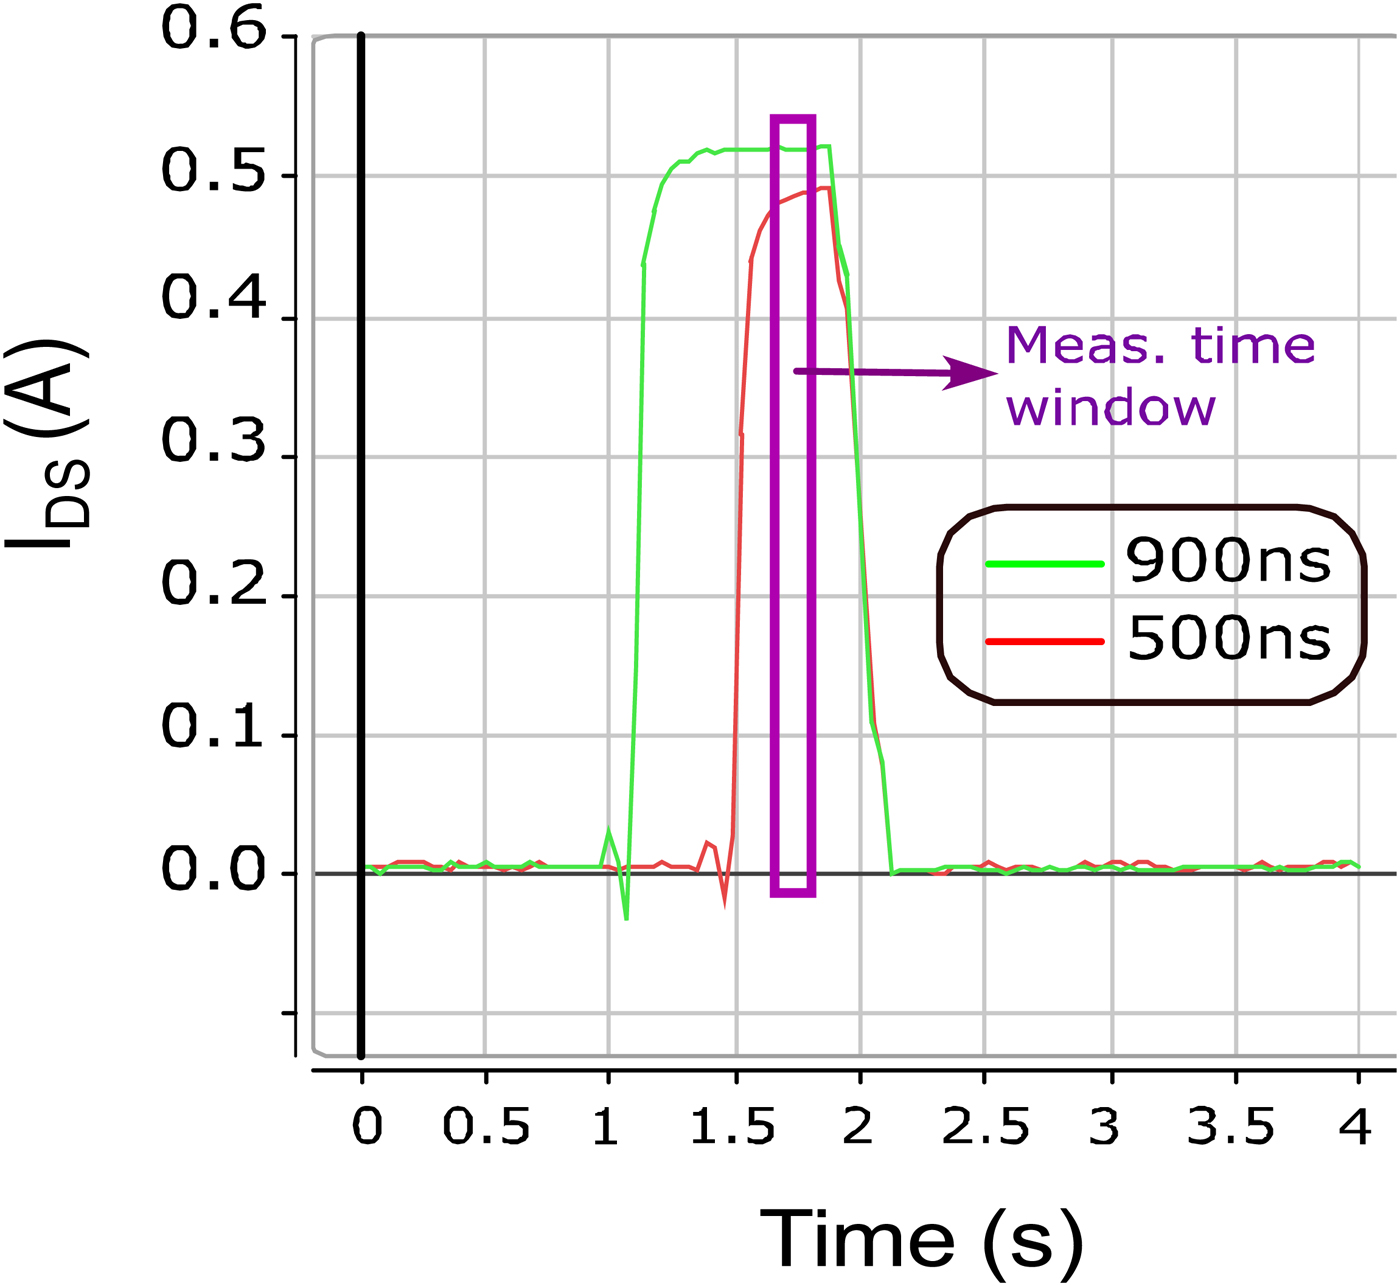
In our standard setup, pulses of 900 ns wide were applied associated with a duty cycle of 0.1% for both gate and drain pulse voltages. These pulses widths correspond to a trade-off between the self-heating generated by the pulses in the devices and the time necessary for the pulses establishment due to the apparatus. To highlight the precautions needed to perform reliable measurements with short pulse widths, Fig. 9 shows the drain current behavior in the time domain obtained with pulse widths of 500 and 900 ns. It clearly shows that the 500 ns pulse width is too short to be completely established when the measurement is performed using our apparatus. Additional measurements realized with a pulse width of 900 ns but with a duty cycle of 10%, or measurements with a longer pulse width of 1800 ns applied with a duty cycle of 0.1% do not show significant variations compared with our standard setup (pulse width = 900 ns; duty cycle = 0.1%).
Pulse widths comparisons: 500 900 ns. Time-domain measurements were acquired for a quiescent bias point of (V GSq, V DSq) = (−5, 25) V and a pulsed bias of (V GSi, V DSi) = (1, 3) V.
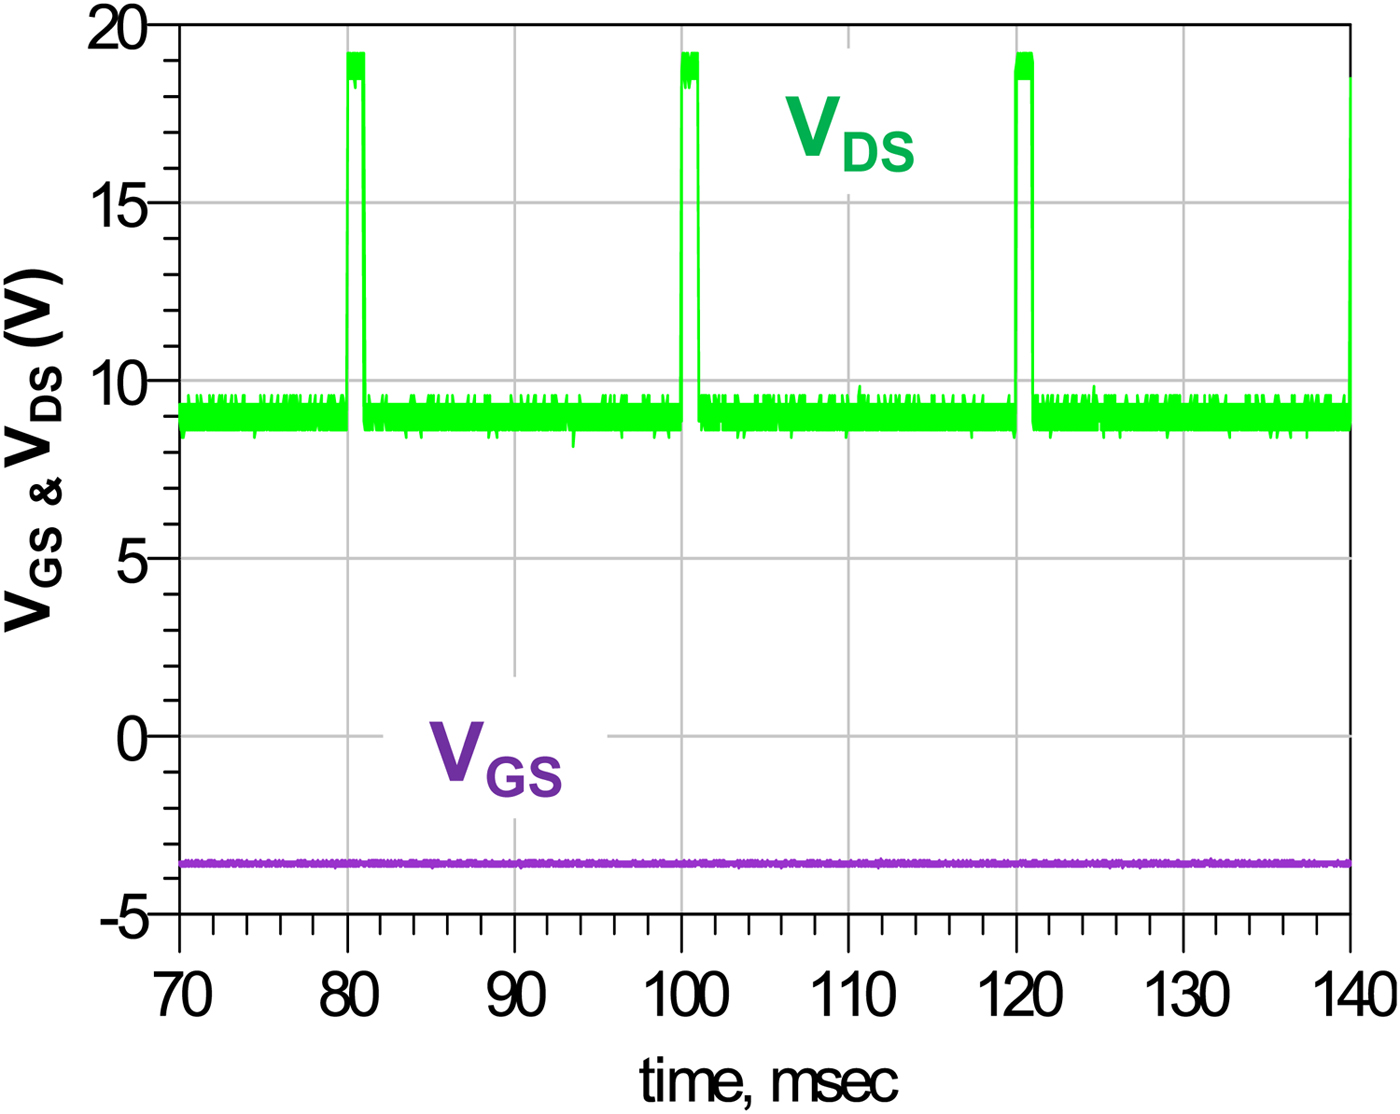
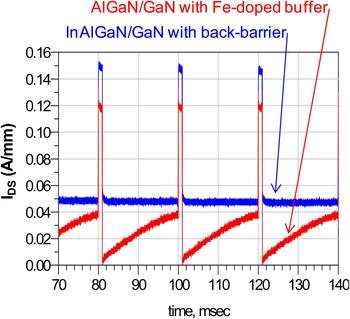
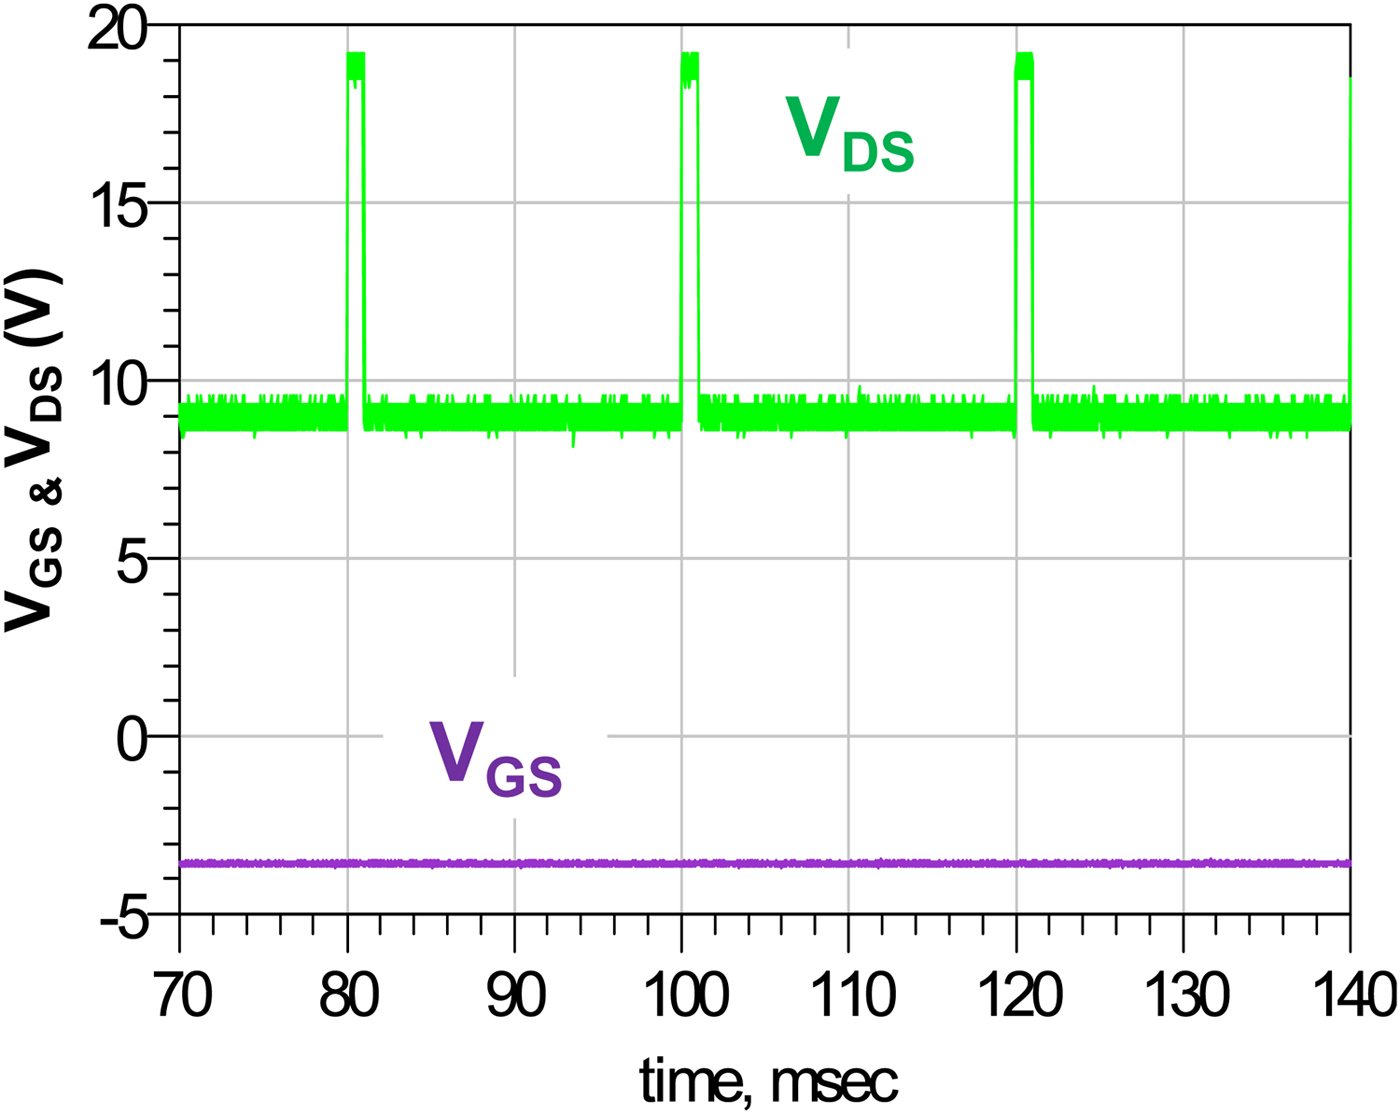
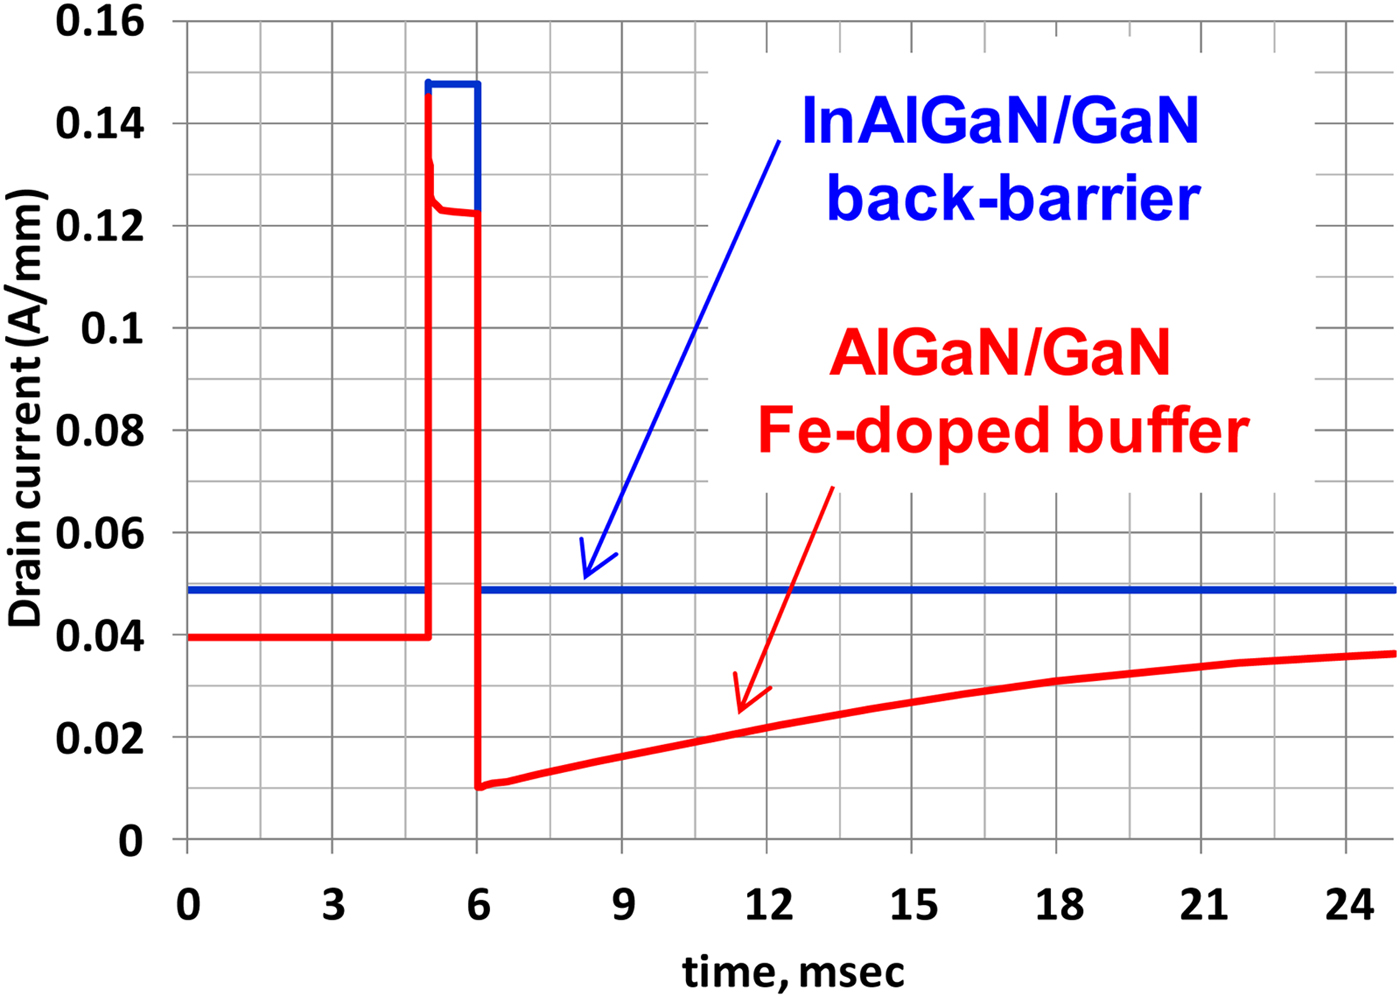
Other pulsed measurements were also carried out to investigate the drain current in the time domain. Figure 10 shows the V DS and V GS voltages applied to the transistor. In the measurement setup, the V DS voltage is pulsed (1.3 ms pulses length with 20 ms period) from 9 to 19 V while the V GS voltage is adjusted to have a quiescent drain current density of 50 mA/mm between drain pulses. The drain current is measured thanks to a Hall Effect probe and a digital oscilloscope. Figure 11 shows the time domain behavior of the drain current of our InAlGaN/GaN device, which includes an AlGaN back-barrier in the buffer structure. Results are compared with similar AlGaN/GaN devices including a Fe-doped buffer layer. During the V DS pulse, the drain current increased due to the output conductance of the transistor. Then, when the V DS voltage returns to 9 V, the drain current of the InAlGaN/GaN device with the AlGaN back-barrier in the buffer follows the evolution of the V DS voltage. This is not the case for the device with a Fe-doped buffer layer, which needs around 20 ms to recover its initial current density between each pulse. These devices, with an improved buffer structure, show the reduced recovery time of drain current, which should have a positive impact on pulsed or modulated signal applications.
V DS applied to the transistor for recovery time measurements. Pulse length is 1.3 ms with a 20 ms period at constant gate voltage.
Drain current measured using Hall Effect probe for an InAlGaN/GaN device including a back-barrier buffer layer and an AlGaN/GaN device including a Fe-doped buffer layer.

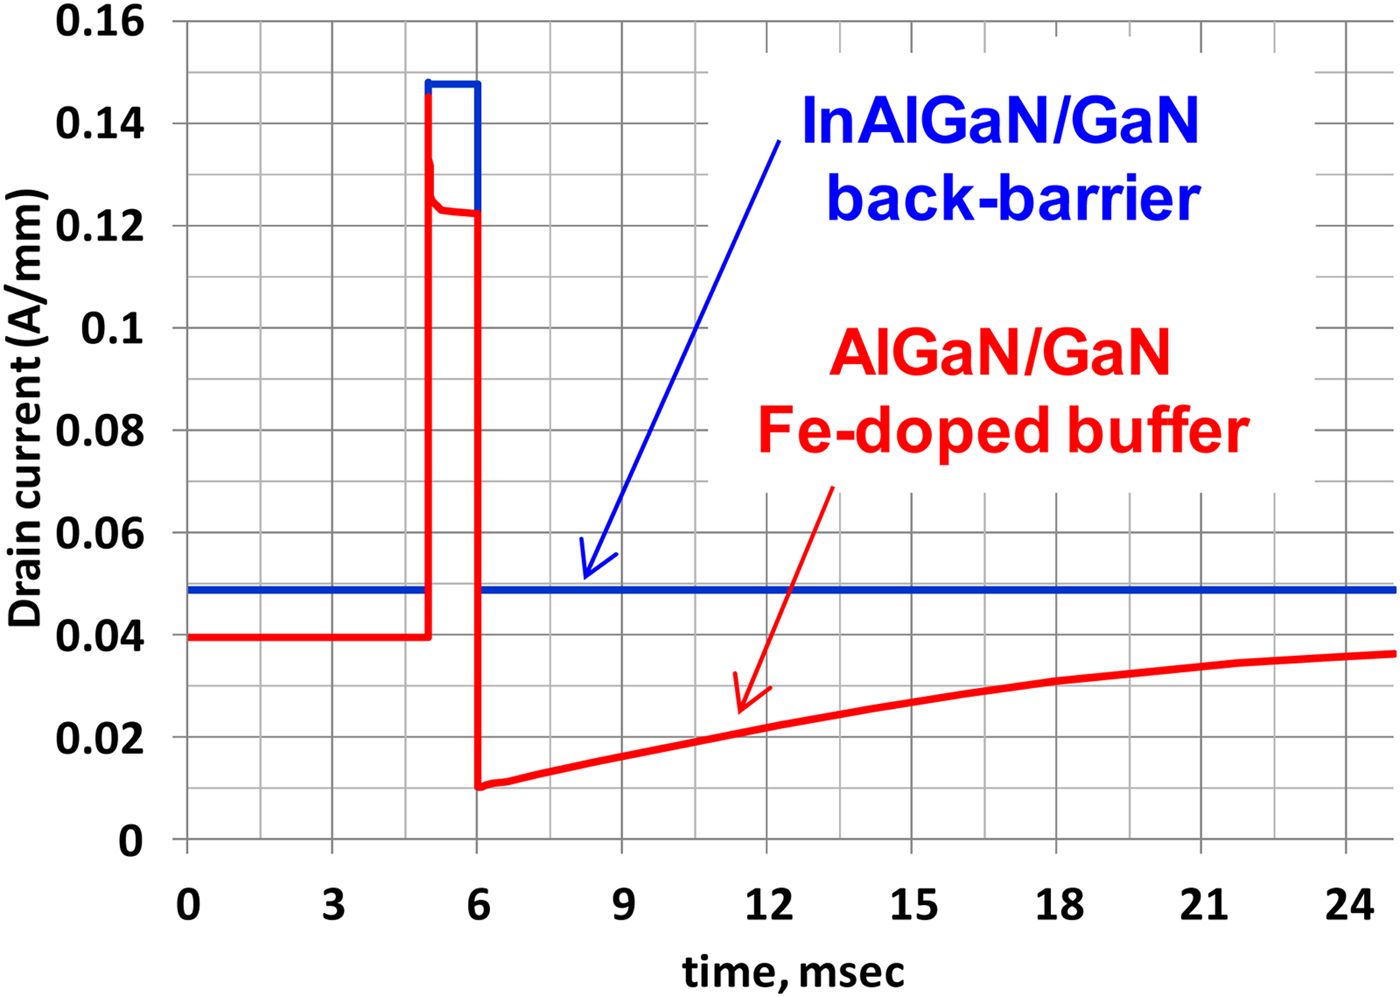
These results were compared with TCAD simulations performed during the design phase of the HEMT structure (Fig. 12). In these simulations, only traps located in the buffer are taken into account. We observe that the behavior predicted by TCAD simulations is very close to the measurements. They confirm the absence of recovery time on the device having an AlGaN back-barrier and validate also that the time dependence of the drain current observed on the device with the Fe-doped buffer is due to the presence of the Fe doping.
TCAD simulations of the drain current for an InAlGaN/GaN device including a back-barrier buffer layer and an AlGaN/GaN device including a Fe-doped buffer layer when a single pulse V DS is applied from 9 to 19 V. The V GS voltage is maintained fixed to reach 40 or 50 mA/mm outside the pulse.
C) S-Parameter measurements
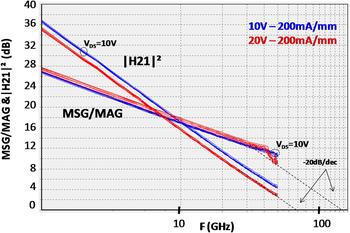
On-wafer [S]-parameters were measured to extract small signal figures of merit of the InAlGaN/GaN devices. Measurements are presented directly in the probes reference planes, without additional de-embedding. Figure 13 shows the maximum stable gain (MSG), maximum available gain (MAG) and the current gain |H21|2 of 2 × 50 × 0.15 µm3 biased at V DS = 10 V and V DS = 20 V for a drain current density of 200 mA/mm. Extrapolation of the measurements at V ds = 20 V with a 20 dB/dec slope gives a current gain cut-off frequency and MAG cut-off frequency of 70 and 140 GHz, respectively. The MSG gain is improved by 0.6 dB from V DS = 10 to V DS = 20 V confirming the good pinch-off of the devices: i.e. no decrease of the RF transconductance is observed. The MSG gain is 13 dB at 30 GHz and V DS = 20 V.
MSG/MAG and |H21|2 Gains of 2 × 50 × 0.15 µm3 InAlGaN devices biased at V DS = 10 and V DS = 20 V.

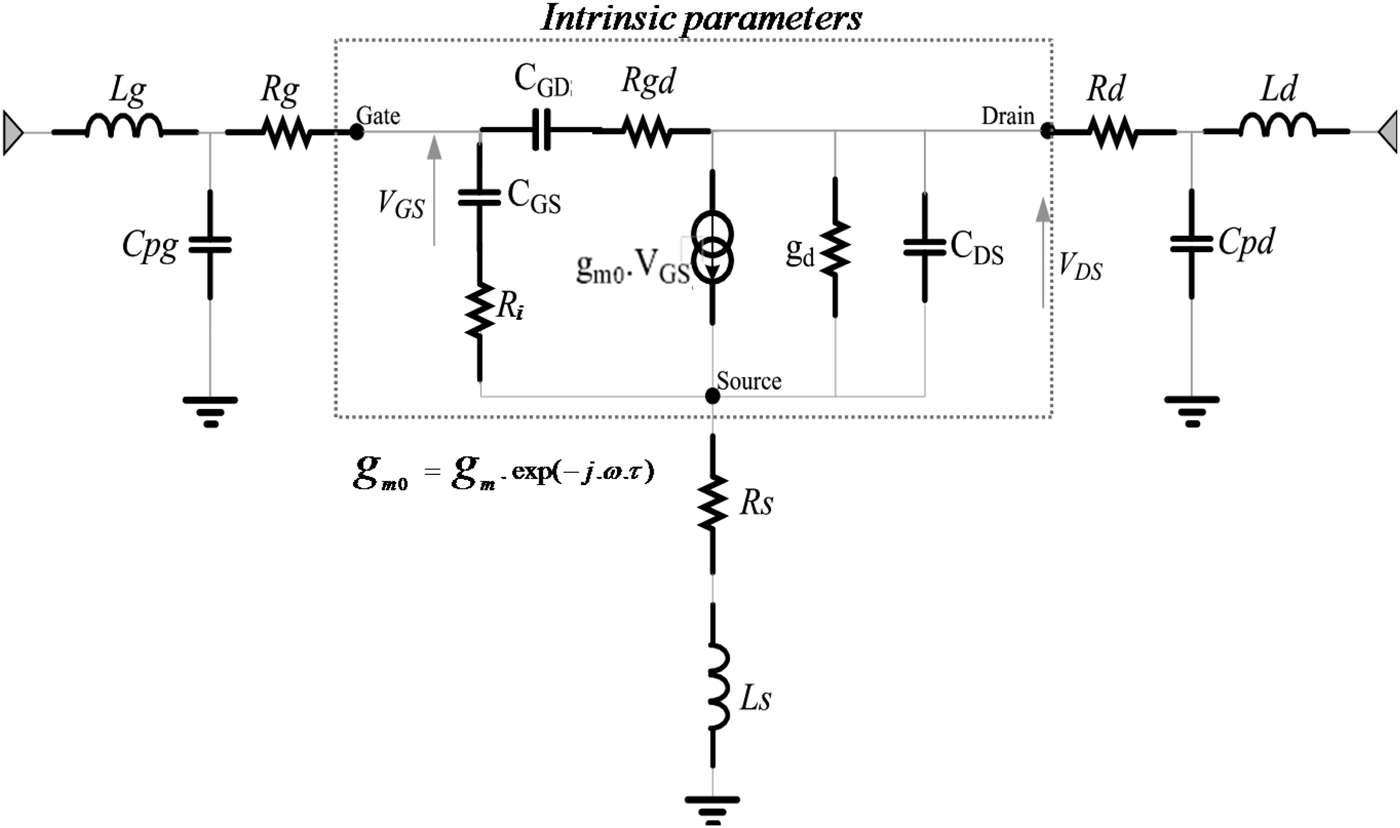
Afterwards, after a correct de-embedding applied to the on-wafer measurement in order to remove the effects of the access lines of these devices, we extracted the elements of the well known small-signal equivalent circuit presented in Fig. 14.
Schematic of the small-signal equivalent circuit of the transistor.
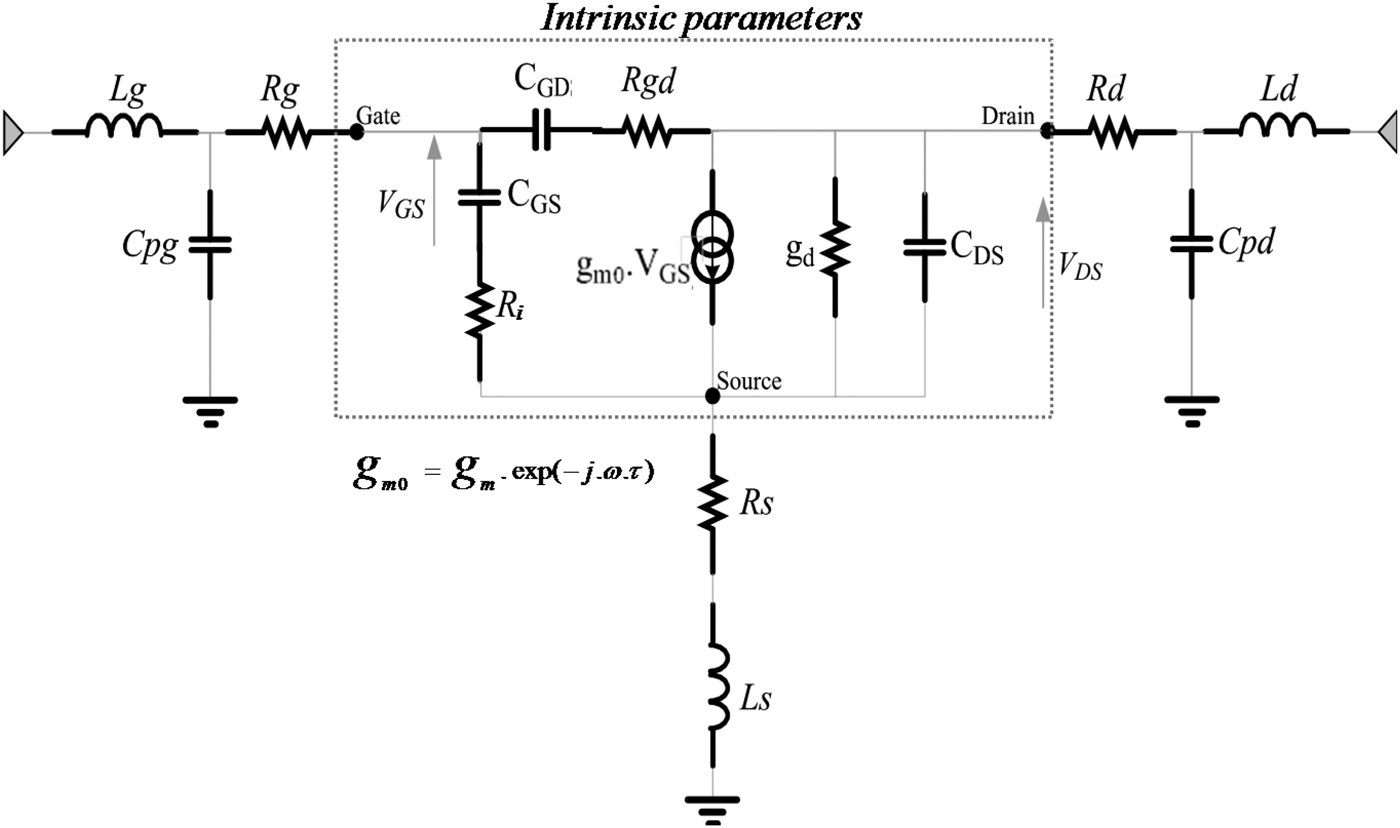
The elements of the small signal equivalent circuit of the 2 × 50 × 0.15 µm2 HEMT device are reported in Table 1. The extraction was performed for the biasing conditions of V DS = 20 V and I DS = 200 mA/mm.
D) Large signal measurements
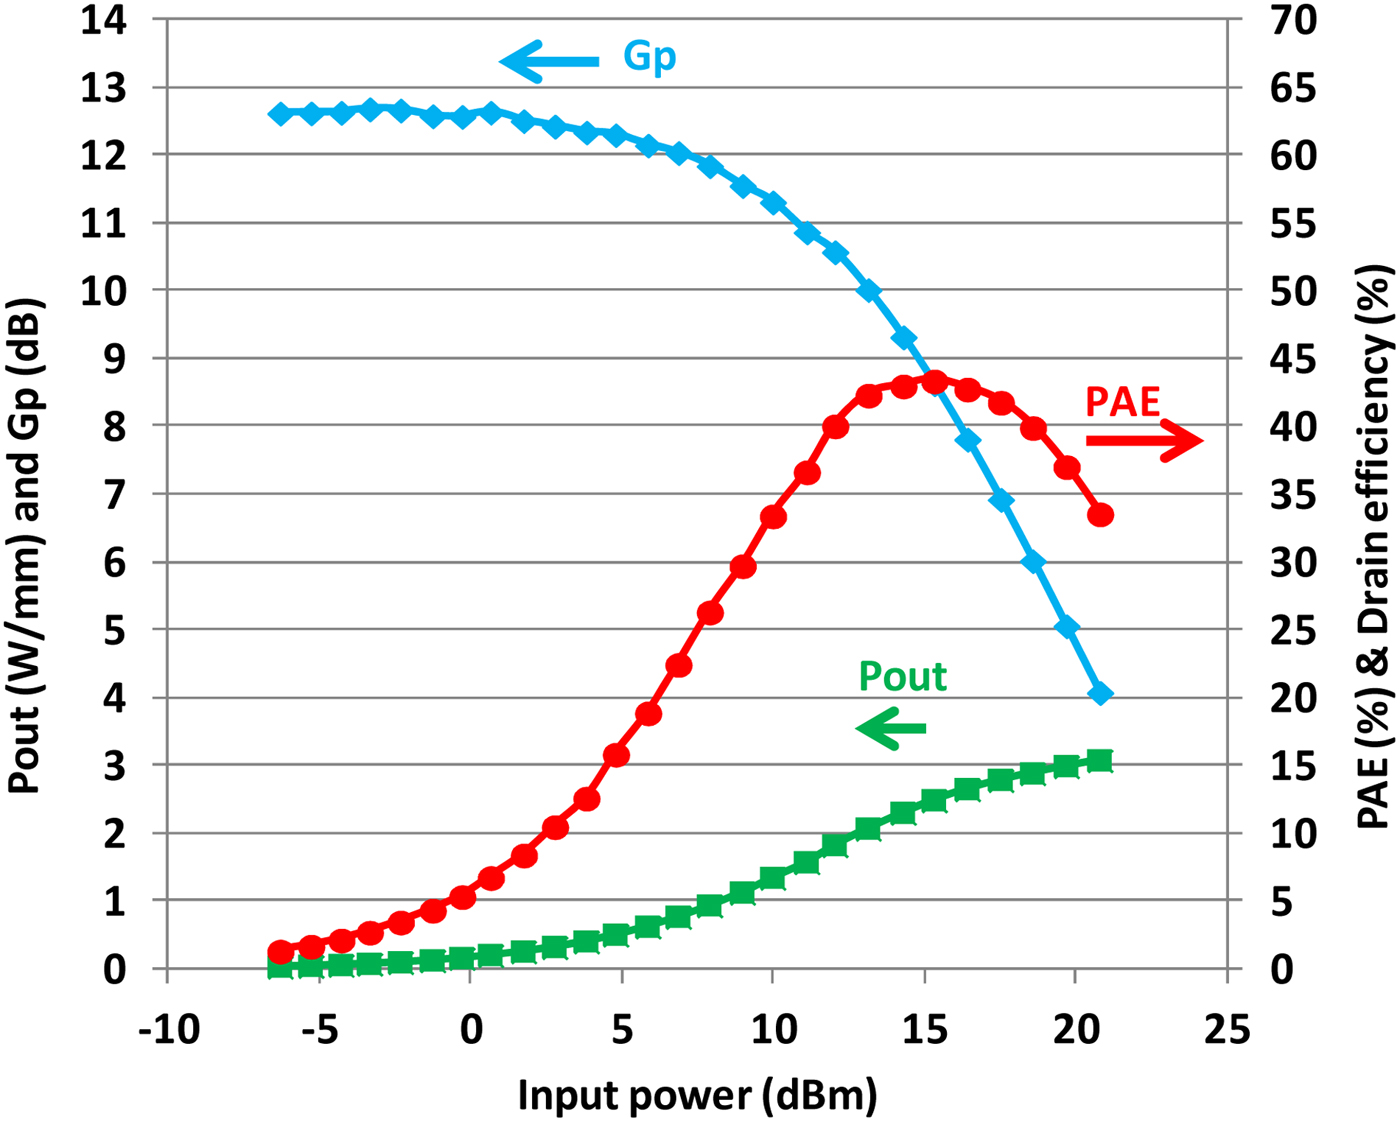
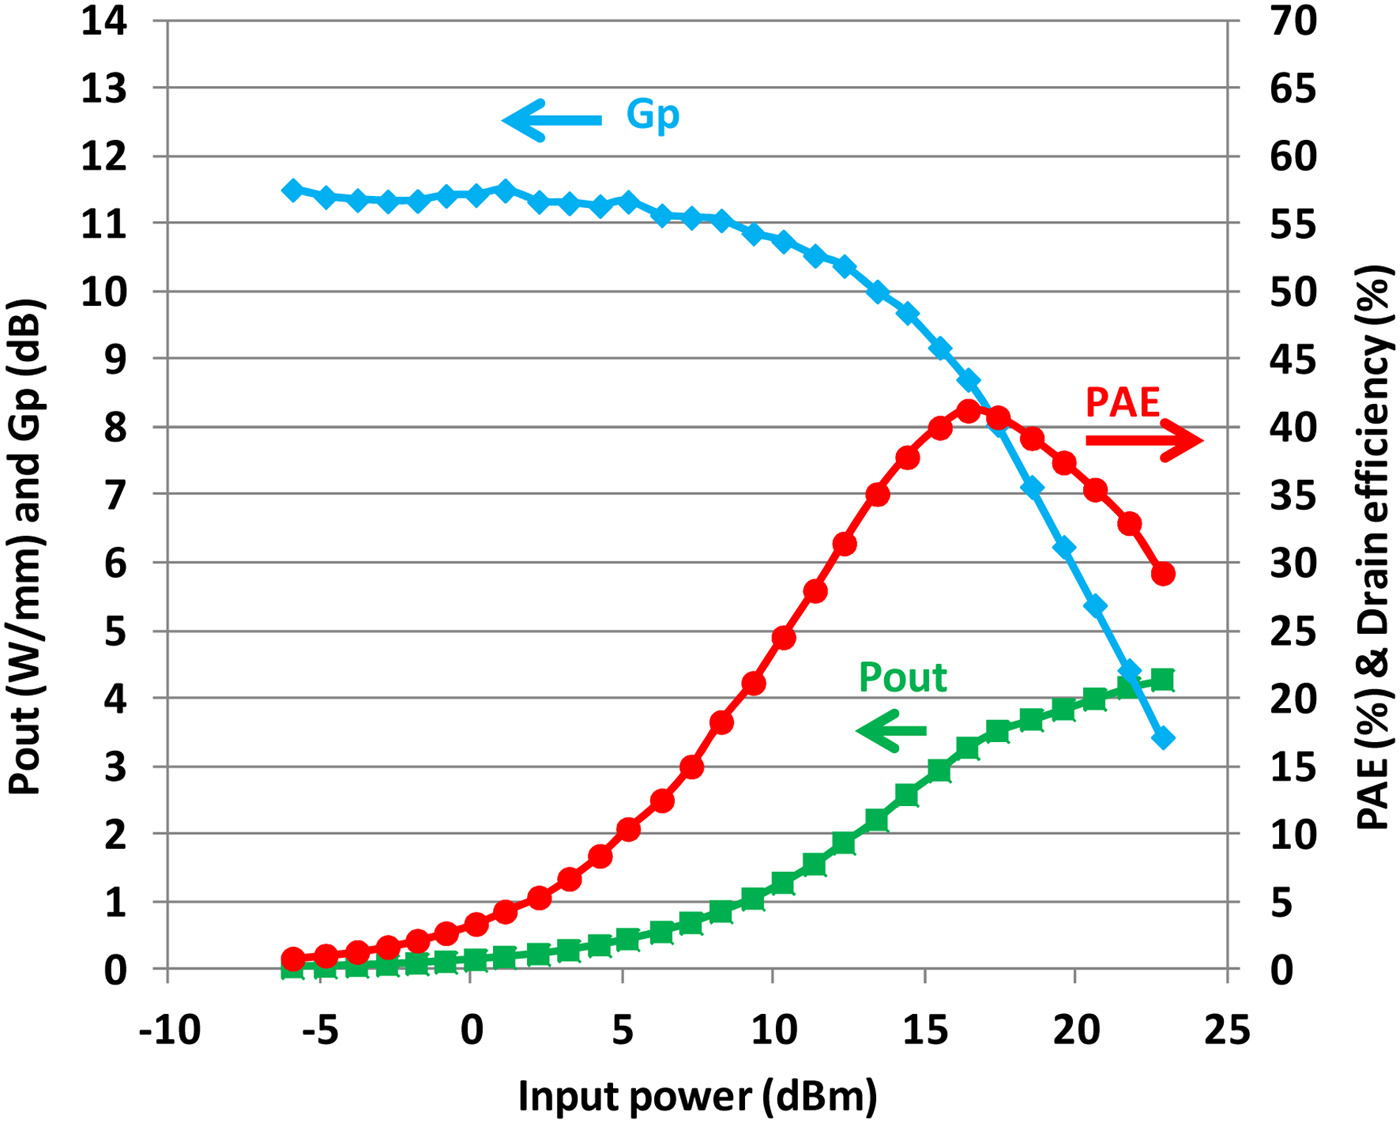
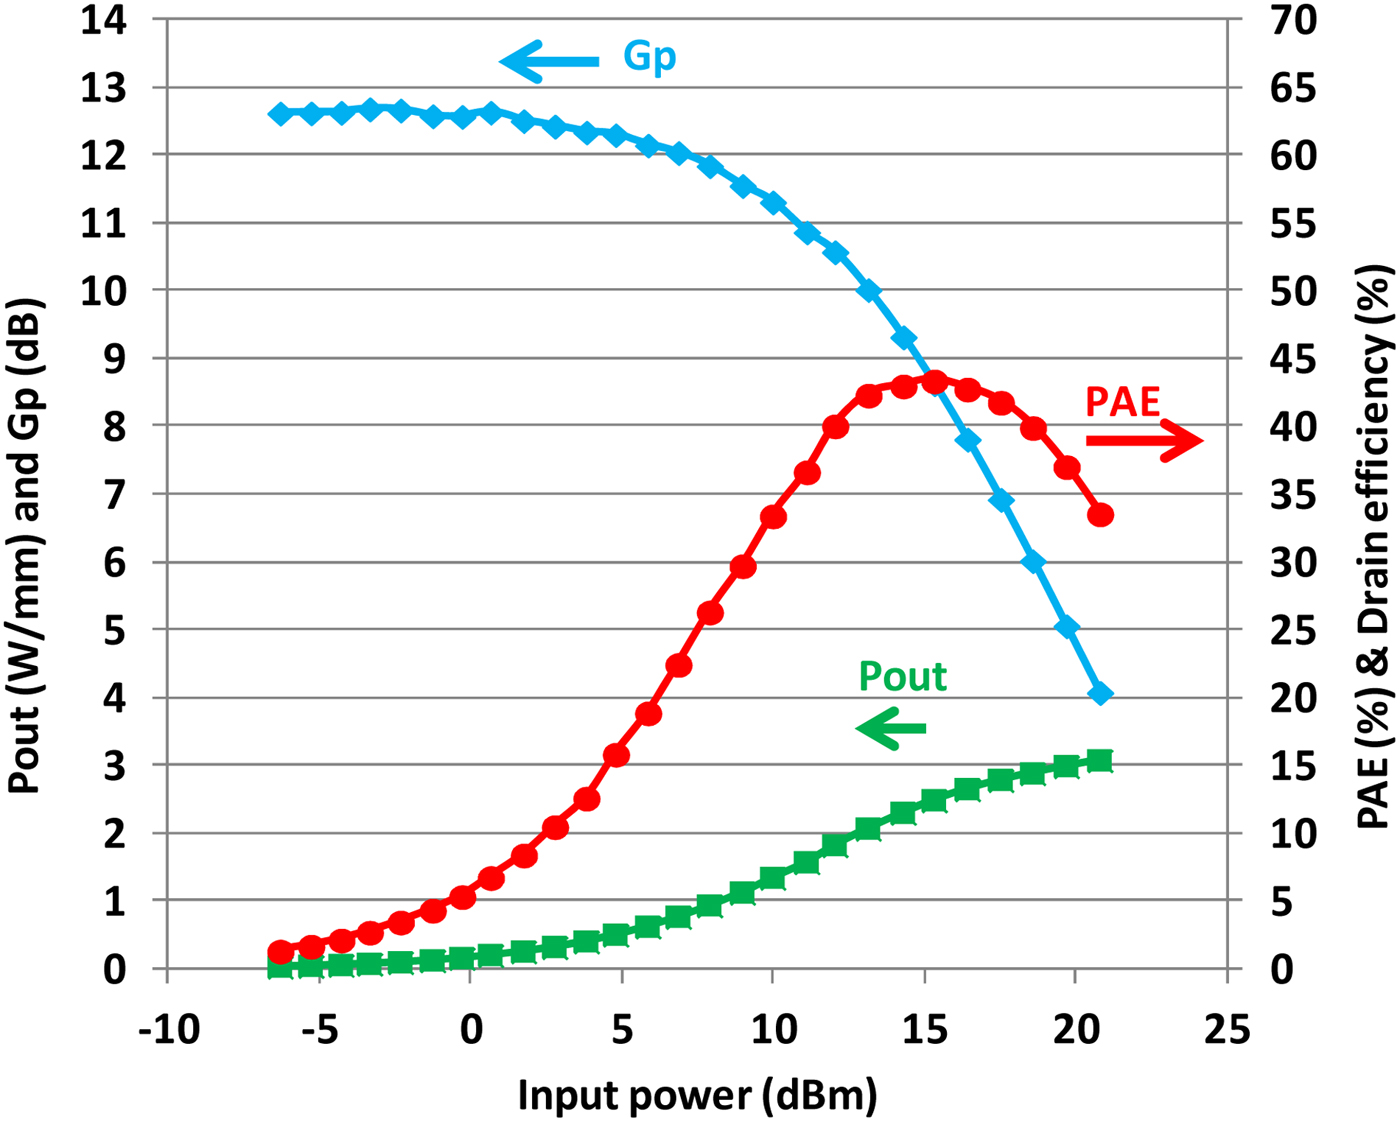
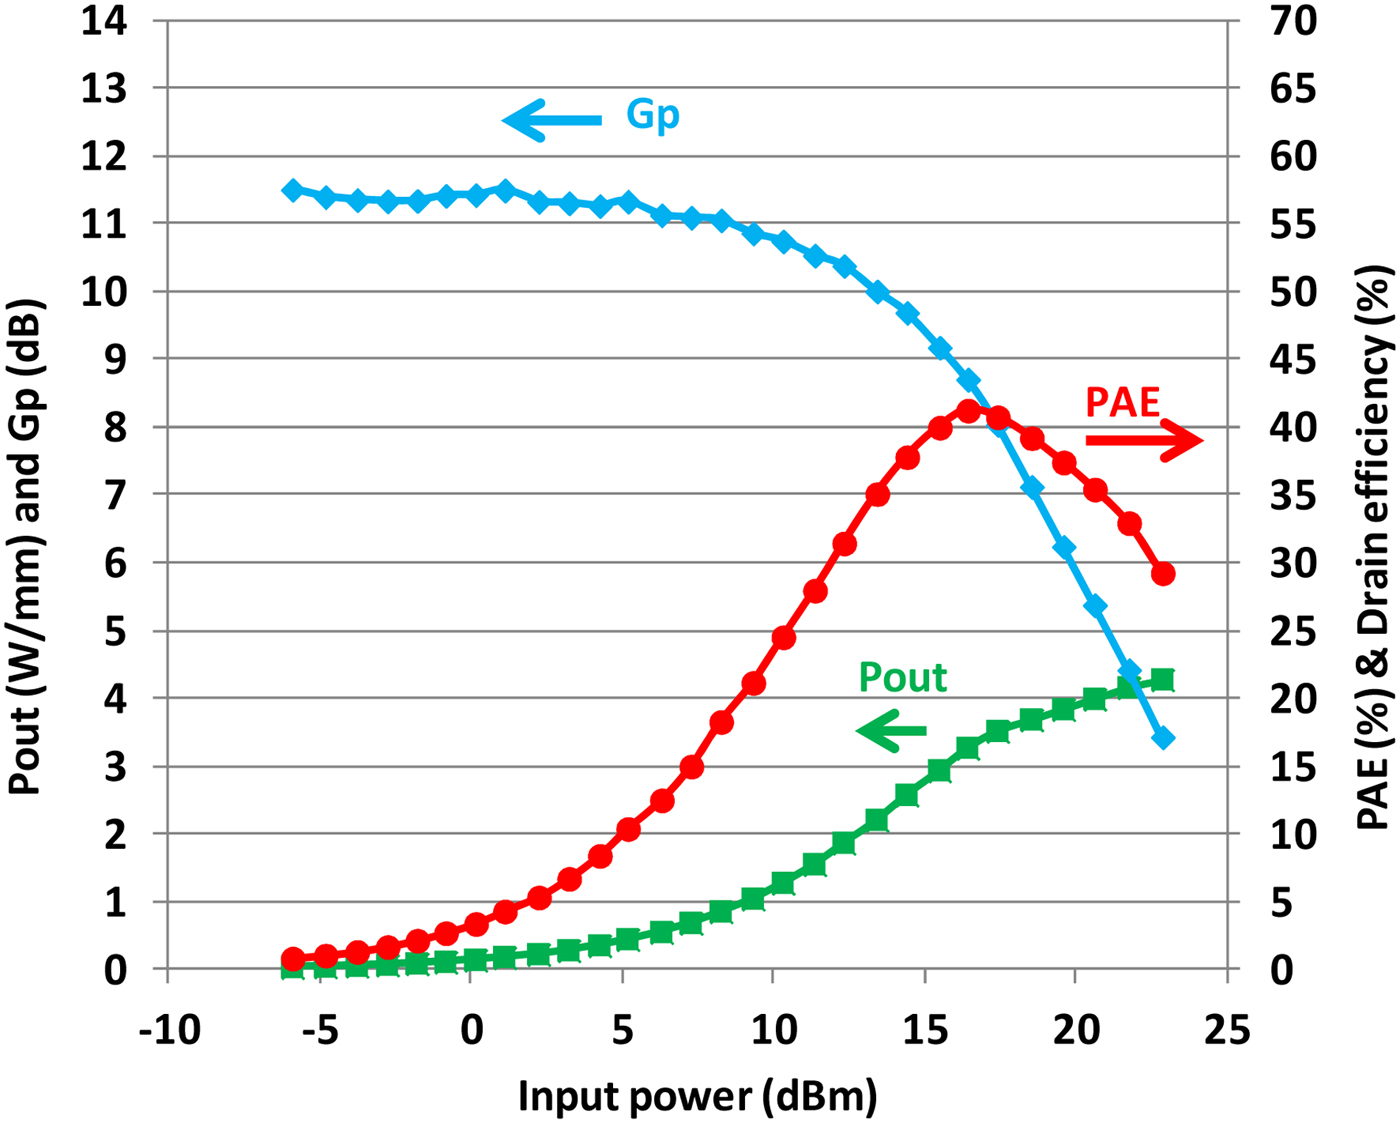
Power measurements were performed at 30 GHz in continuous wave (CW) mode using a commercial Vectorial Network Analyser (VNA)-based Load-pull bench combining both passive and active matching. Figure 15 shows the output power, power gain, and power-added efficiency (PAE) of a 2 × 50 × 0.15 µm3 transistor versus the input power for a drain bias voltage V DS = 15 V and a quiescent drain current density of 200 mA/mm. The measurements are presented for the optimum load impedance, which maximizes the PAE: 36 + j × 100 Ω. The peak PAE reaches 43% with an associated output power density of 2.5 W/mm and 8.5 dB of gain. Figure 16 shows the performances obtained at a higher drain voltage V DS = 20 V (Zload = 33.5 + j × 105 Ω). At the peak PAE of 41%, the output power density reaches 3.5 W/mm with a gain of 8 dB. We can observe that the output power density increases from 2.5 to 3.5 W/mm in the same proportion as the increase of the quiescent drain voltage from 15 to 20 V confirming the negligible knee walk-out and current collapse observed on the pulsed I-V measurements of Fig. 8.
Load-pull measurement of 2 × 50 × 0.15 µm3 InAlGaN/GaN HEMT biased at V DS = 15 V and J DS = 200 mA/mm at 30 GHz (CW mode – Zload = 36 + j × 100 Ω).
Load-pull measurement of 2 × 50 × 0.15 µm3 InAlGaN/GaN HEMT biased at V DS = 20 V and J DS = 200 mA/mm at 30 GHz (CW mode – Zload = 33.5 + j × 105 Ω).
V. CONCLUSION
This paper presents results achieved with InAlGaN/AlN/GaN heterostructure grown by MOVPE on a 3-in. SiC substrate. The HEMT structure, design by TCAD simulations, uses a patented AlGaN back barrier to improve 2-DEG confinement with an optimized thermal resistance. The processed devices exhibit a maximum DC extrinsic transconductance of 450 mS/mm and drain current density of 1.3 A/mm. The transfer characteristics of 0.15 µm gate length device shows a sub-threshold swing of 140 and 220 mV/dec at V DS = 5 V and V DS = 20 V, respectively confirming the efficiency of the back-barrier of the buffer to confine the electrons into the channel.
Time domain measurements were also performed showing improved drain current recovery time behavior under-drain bias variation when compared with devices that use a Fe-doped buffer layer. These behaviors are in agreement with TCAD simulations used for the design of the HEMT structure.
Small signal characterizations of 2 × 50 × 0.15 µm3 devices gave F T and F MAG of 70 and 140 GHz respectively.
Load-pull power measurements at 30 GHz allow one to achieve a maximum PAE of 43% associated with an output power density of 2.5 W/mm when biased at V DS = 15 V, for an optimized output load maximizing the PAE. Biased at V DS = 20 V, a peak PAE of 41% associated with an output power density of 3.5 W/mm is also obtained. These devices, with an improved buffer structure, show the reduced recovery time of drain current, which should have a positive impact on pulsed or modulated signal applications.
ACKNOWLEDGEMENT
This work was supported by French Ministry of Economy (project VEGaN), French MOD and EDA (project EuGaNiC) and CNES. The authors would like to acknowledge Professor Juan Obregon for constant technical discussions.
 Stéphane Piotrowicz received the Ph.D. Degree in Electronics from the University of Lille in 1999 at Institute for Electronics Microelectronics and Nanotechnology (IEMN). In 2000, he joined the Thales Research Center and worked on the design of hybrid and MMIC power amplifiers on InGaP/GaAs HBT technology for Radar and Space Applications. He is currently in charge of the GaN HEMT for RF applications program at III-V Lab (a joint lab of Nokia Bell Labs France, Thales Research and Technology & CEA Leti). His background concerns design, modeling and RF characterization at transistor and circuit levels, power switches, power amplifiers and low noise amplifiers for T/R modules.
 Jean-Claude Jacquet received the Engineer degree from the Ecole Supérieure d'Optique, Orsay, France, in 1990. He subsequently joined the Central Research Laboratory of Thales, as a Research Staff Member, where he was involved with spintronic devices. He focused his efforts on the giant magnetoresistive effect and found a new physical effect called the magnetorefractive effect. Since 1999, he has been involved with GaInP HBT and GaN HEMT microwave power devices. He is currently in charge of the thermal management and of the physical modeling aspects on GaN Hemt with the Alcatel/Thales III–V Laboratory.
 Piero Gamarra received the Ph.D. degree in material science from the University of Lyon, France, in 2012. He is currently Senior Scientist in charge of the III-N growth activities at III-V Lab, Thales Research and Technology, France. His research interests include the MOVPE growth and the physical characterization of nitride heterostructures for electronic and optoelectronic devices. He holds two patents and has authored or co-authored more than 20 papers in peer-reviewed journals.
 Olivier Patard received the Engineer degree from INSA Rennes, in 2008, and the Ph.D. degree from INSA Rennes in 2012. His doctoral research, performed at III-V lab focused on the regrowth by MOVPE of semi-insulating InP for buried optoelectronic heterostructures. His work also includes fabrication and characterizations of advanced photonic integrated circuits on InP for telecommunication. Since 2012, he is a research engineer at III-V Lab for GaN microelectronic activities. He is now in charge of the process team working on the development of GaN devices.
 Christian Dua received the Engineer degree in Physics from the University of Clermont Ferrand (France). He joined THOMSON-CSF Group (previous name of THALES) in 1982. He has been working in two different Units of the Group whose main activities were microwave devices (mainly diodes) and optoelectronic components (lasers and LEDs). During this period he gained experience in crystal growth (using several techniques such as Vapor Phase Epitaxy, Liquid Phase Epitaxy, Metal-Organic CVD and Chemical Beam Epitaxy and physical and electrical characterization of Semiconductor epi-layers and substrates. He is currently involved in the study of the reliability of the GaN technology.
 Eric Chartier received the M.Sc degree in physics from Ecole Superieure de Physique et Chimie de PARIS (ESPCI), Paris, France, in 1979. Since 1981, he has been at Thales Research and Technology Laboratory and has worked for developing transistor on amorphous then 3–5 semiconductors. His research interest includes microwaves measurements of transistors and MMICs.
 Nicolas Michel received the Ph.D. in Microwave and Microtechnology from the University of Lille 1, France, in 2004. Has been involved in high power diode laser engineering from 2004 to 2010 and in GaN device processing from 2010 to 2017, both at III-V Lab.
 Mourad Oualli was born in France in 1982. He was graduated from the Ecole Polytechnique and the Ecole Supérieure d'Electricité (Supélec) in 2007. He then joined the Alcatel-Thales III-V lab as a research engineer in the development of the AlGaN/GaN and AlInN/GaN HEMT technologies. He especially contributes to the improvement of reliability aspects by studying parasitic effects.
 Cedric Lacam received a Master degree in materials science and engineering from the University of Saclay, Orsay, France, in 2011. He is currently a MOCVD process engineer at III-V Lab, Palaiseau, France. His research interests are the growth and characterization of GaN-based heterostructures for electronic and optoelectronic devices, such as high power RF HEMTs, vertical p-n diodes and emissive micro-displays.
 Clément Potier was graduated Engineer from INSA Lyon, France, in 2012. He received his Ph.D. degree in high frequencies electronics from the University of Limoges in 2016, in the frame of the common laboratory MITIC between XLIM and III-V Lab. Since 2016, he is a research engineer at III-V Lab and is involved in the development of GaN HEMT power devices. He is in charge of electrical characterizations, transistor modeling, and circuit design.
 Philippe Altuntas received the Ph.D. Degree in Microelectronics and Nanotechnologies from the University of Lille in 2015 at Institute for Electronics Microelectronics and Nanotechnology (IEMN). His thesis topic was focus on the fabrication and characterization of GaN-based devices for microwaves power applications. In 2016, he joined III-V Lab (a joint lab of Nokia Bell Labs France, Thales Research and Technology & CEA Leti) as research engineer involved in the technological development of GaN-based devices and MMIC.
 Sylvain Delage obtained his Ph.D. from University Paris VII in 1985. Afterwards he was for 2 years with IBM T.J. Watson Research Center as research staff member, where he did participate in the first demonstration of Si/SiGe HBT. In 1988, he joined the Central Research Laboratory of Thomson-CSF, now Thales Research and Technology, where he was in charge of the Power Transistor Program for Microwave Applications. This work was carried out with a team of about 15 people that gave rise to the demonstration of InGaP/GaAs HBT devices and microwave circuits. He is now working with III-V Lab, where he is now in charge of the GaN programs. He has been in charge or strongly involved in various European or French projects. He contributes to more than 100 publications and 25 patents.