Introduction
Compensatory or catch-up growth (CG) may be defined as a physiological process whereby an animal accelerates its growth following a period of growth restriction as compared with non-restricted control animals (Hornick et al., Reference Hornick, van Eenaeme, Gérard, Dufrasne and Istasse2000). Wyllie et al. (Reference Wyllie, Speer, Ewan and Hays1969) and Fabian et al. (Reference Fabian, Chiba, Kuhlers, Frobish, Nadarajah, Kerth, McElhenney and Lewis2002) have observed complete CG in growing pigs following a period of amino acid (AA) intake restriction. However, several studies have shown incomplete CG (Kyriazakis et al., Reference Kyriazakis, Stamataris, Emmans and Whittemore1991; de Greef et al., Reference de Greef, Kemp and Verstegen1992; Whang et al., Reference Whang, Kim, Donovan, McKeith and Easter2003) or have failed to demonstrate CG in pigs (Chiba et al., Reference Chiba, Kuhlers, Frobish, Jungst, Huff-Lonergan, Lonergan and Cummins2002; Ferguson and Theeruth, Reference Ferguson and Theeruth2002). In previous studies (Martínez-Ramírez et al., 2008a and 2008b), some of the potential mechanisms that are involved in CG and compensatory whole-body protein deposition (CPd) following AA intake restriction have been described. It appears that in growing pigs, CPd takes place during the energy-dependent phase of whole-body protein deposition (Pd) only. The latter seems to be driven by constraints on chemical body composition, represented by the ratio between whole-body lipid and whole-body protein mass (LB/PB), and not by constraints on the composition of growth, as was suggested by de Greef et al. (Reference de Greef, Kemp and Verstegen1992). Apparently, the animal’s upper limit to Pd (Pdmax) determines the maximum rate of CPd (Martínez-Ramírez et al., 2008a and 2008b). However, limited information is available about the physiological control of CG following AA intake restriction. The objective of this study was to determine the effects of the AA intake restriction during the early grower phase (15 to 38 kg BW) on growth performance, blood urea nitrogen (BUN), cortisol, leptin, insulin-like growth factor I (IGF-I), growth hormone (GH), carcass traits and final body composition during the subsequent re-alimentation phase (38 to 110 kg BW) in pigs with high lean tissue growth potentials.
Material and methods
Animals and general design
Thirty-six purebred Yorkshire entire male pigs, from 20 different litters and with uniform BW of approximately 10 kg, were obtained from the University of Guelph swine herd and transported to the animal metabolism unit at the University of Guelph in five different batches. Housing and general management of pigs were described previously (Martínez-Ramírez et al., 2008a and 2008b).
At a BW of 15.9 ± 1.03 kg, an identical number of pigs in each batch were assigned to one of the two dietary treatments: adequate AA intake (control) or AA-limiting diets (AA-30%; Martínez-Ramírez et al., 2008b). Throughout the experiment, pigs were scale-fed at 90% of voluntary digestible energy intake according to the National Research Council (1998) and kept individually in floor pens. Once pigs reached 38 kg BW, they all received common diets that were not limiting in AA and other essential nutrients until they reached 110 kg BW (Martínez-Ramírez et al., 2008b). The period from 15 to 38 kg BW and from 38 to 110 kg BW will be referred to as the restriction and re-alimentation phase, respectively.
When pigs reached approximately 34 kg BW, seven pigs per treatment were fitted with jugular catheters (de Lange et al., Reference de Lange, Sauer, Mosenthin and Souffrant1989) to determine dynamic changes in blood metabolites and selected hormones at the end of the restriction phase and during the re-alimentation phase. Starting at 37 kg BW, ultrasound measurements were taken every 2 weeks until pigs reached 110 kg BW. At 110 kg BW, all pigs were slaughtered and routine carcass evaluation was conducted. Detailed carcass dissection was conducted on eight pigs per treatment.
Blood sampling and plasma analysis
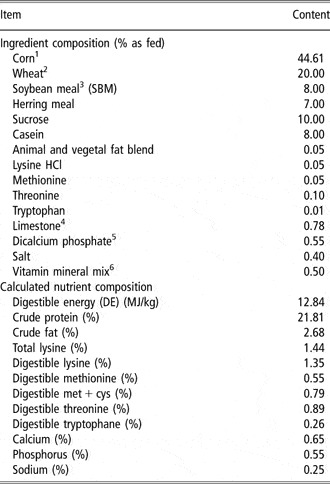
Blood samples were obtained from the catheterized pigs at 38, 45, 53 and 68 kg BW and at slaughter. Before obtaining blood samples, pigs were fasted overnight for 16 h and then fed a test meal (Table 1) at 0800 h. The amount of feed offered was equivalent to 0.58 g N/BW0.75 (Whang et al., Reference Whang, Donovan and Easter2000). Blood samples were collected at 2, 3 and 4 h after feeding to obtain peak post-prandial BUN values according to Whang et al. (Reference Whang, Donovan and Easter2000). At 110 kg BW, a single blood sample was obtained in fasted pigs. At each sampling, 8 ml blood was collected in heparinized tubes and centrifuged at 2000 × g for 20 min. The harvested plasma was frozen at −20°C until analysis.
Ingredient composition (%) and estimated nutrient contents of experimental diets fed to pigs during blood sampling

1Corn contains 7.8% crude protein.
2Wheat contains 12.5% crude protein.
3Soybean meal contains 47.8% crude protein.
4Limestone contains 38% calcium.
5Dicalcium phosphate contains 17% calcium and 21% phosphorus.
6Supplied per kg of diet: vitamin A, 4000 IU; vitamin D3, 400 IU; vitamin E, 16 IU; vitamin K, 1 mg; choline, 200 mg; pantothenic acid, 6 mg; riboflavin, 2 mg; folic acid, 0.8 mg; niacin, 10 mg; thiamin, 0.6 mg; vitamin B6, 0.6 mg; biotin, 0.08 mg; vitamin B12, 0.01 mg; Cu, 15 mg; Zn, 100 mg; Fe, 100 mg; Mn, 20 mg; I, 0.3 mg; Se, 0.3 mg.
All analyses were carried out in triplicate. Plasma concentration of BUN was determined using a commercially available kit (Teco Diagnostics, Anaheim, CA 92807, USA). Plasma concentration of cortisol was determined using a competitive binding radioimmunoassay kit (Marchant-Forde et al., Reference Marchant-Forde, Lay, Pajor, Richert and Schinckel2003; GammaCoat, DiaSorin, Stillwater, MN, USA). A Multi Species Leptin Ria kit (Cat. #XL-85 K Linco Research, St Charles, MO, USA) was validated and used to determine the plasma concentration of leptin (Fabian et al., Reference Fabian, Chiba, Kuhlers, Frobish, Nadarajah and McElhenney2003). A conventional radioimmunoassay method (Buonomo et al., Reference Buonomo, Lauterio, Baile and Campion1987) was used to determine the plasma concentration of IGF-I with slight modifications according to Okere et al. (Reference Okere, Hacker and Werchola1997). Plasma concentration of GH was determined according to Parlow (Reference Parlow2004). Reagents for analyses of IGF-I (RhIGF-I DGR-010; Anti-hIGF-I, A.S., RIA, Lot# AFP4892898) and GH (Standard for bGH Lot MO10-001 NHPP-NIDDK; bGH for Id AFP9884C; anti-bGH A.S., RIA, AFPB55 [baboon]) were purchased from A.F. Parlow, Inc. (NHPP, Torrance, CA, USA). For cortisol, leptin, IGF-I and GH analyses, the intra-assay CV were 3.7%, 5.3%, 2.0% and 4.2%, respectively, whereas the inter-assay CV for the hormone analyses were 6.3%, 5.9%, 7.1% and 6.7%, respectively.
Ultrasound, slaughter and carcass measurements
In a sub-sample of eight pigs per treatment, backfat thickness, loin depth and loin eye area were measured with an ultrasound machine (AgroScan Linear Model; S.E.C. Repro Inc. Ange-Gardien-de-Rouville, QC, Canada) in a cross-section of loin between the third and fourth last ribs. Loin depth and backfat were measured 40 to 50 mm from the midline.
The chemical and physical body composition of pigs at 15 and 38 kg BW was derived from data presented by Martínez-Ramírez et al. (2008b). Once pigs reached 110 kg BW, pigs were slaughtered to determine physical and chemical body composition. Slaughter procedures and management of viscera and the right-hand side of the carcasses for determining chemical body composition were described in detail previously (Martínez-Ramírez et al., 2008a). In short, at slaughter, the eviscerated carcass was split longitudinally through the vertebrae midline. Warm carcass weight was recorded as well as backfat depth and muscle depth between the third and fourth last ribs and 7 cm from the midline using the Hennesy grading probe (CA and Associates, Mississauga, ON, Canada; Anonymous, 1986). Immediately after probing, the right-hand side of the carcass (including head and feet) was frozen at −20°C and processed as described in Martínez-Ramírez et al. (2008b). The left-hand side of the carcass was chilled for 24 h at 4°C, re-weighed and dissected into wholesale cuts, according to the Canadian carcass grading system (Anonymous, 1986). Loin, backfat and loin meat quality (subjective colour, firmness and marbling) measurements were also taken manually according to the procedures adapted from the National Pork Producers Council (1991). Loin meat colour (whiteness, redness and yellowness represented by L, a and b values, respectively) was measured objectively using a Minolta Chromameter CR 200b (Minolta, Toronto, ON, Canada).
Calculations and statistical analysis
All the calculations to determine body composition, whole-body lipid deposition (Ld) and Pd were described in detail by Martínez-Ramírez et al. (2008a). The statistical analyses were performed using the mixed procedure of SAS (SAS Inst. Inc., Cary, NC, USA, 2003) and according to a completely randomized block design. In this experiment, two dietary AA levels, five blocks (groups of pigs upon arrival, random effect) were considered as sources of variation; the effect of litter was deemed not significant (P > 0.10). Initial BW was used as a covariate when growth performance was evaluated. Differences among treatment means were assessed using the Tukey honestly significant difference test. Statistical analyses for plasma hormones and BUN were analysed by the analysis of variance specific for repeated measures using the mixed procedure of SAS. Analysis of correlation was performed according to the CORR procedure of SAS. Probability levels less than P < 0.05 were considered to represent significance, while 0.05 < P < 0.10 was considered to represent a trend.
Results and discussion
General observations
Generally, the pigs appeared in good health and no abnormalities in animal behaviour were observed. However, data obtained during the re-alimentation phase from one pig on control and two pigs on AA-30% were eliminated due to lack of appetite. Unfortunately, between 45 and 53 kg BW in more than 50% of the pigs’ patency of jugular catheters was lost. During the re-alimentation phase, blood samples were taken by puncture from the suborbital sinus cavity and plasma levels of cortisol were not evaluated. Plasma hormone levels appeared to be in accordance with previous reports in the literature (Smith et al., Reference Smith, Underwood and Clemmons1995; Fabian et al., Reference Fabian, Chiba, Kuhlers, Frobish, Nadarajah and McElhenney2003). However, IGF-I levels were slightly greater than published values (Owens et al., Reference Owens, Gatford, Walton, Morley and Campbell1999; Whang et al., Reference Whang, Donovan and Easter2000). These values might represent either a greater sensitivity of the analytical protocol, pig type or experimental conditions.
Growth performance
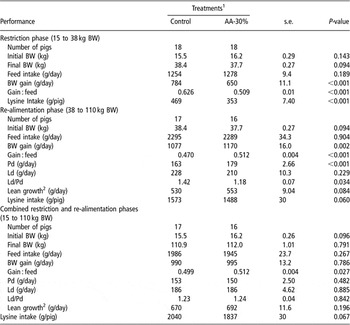
Initial and final BW did not differ between treatments (P > 0.10). During the restriction phase, pigs on AA-30% had poorer growth rates (650 v. 784 g/day; P < 0.001) and feed efficiency (gain : feed ratio; 0.509 v. 0.626; P < 0.001) than pigs on control. Reduced growth performance due to AA intake restriction was consistent with previous observations in our laboratory carried out under similar conditions (Martínez-Ramírez et al., 2008a and 2008b).
During the re-alimentation phase, growth performance was inversely related to AA levels in diets that were fed during the restriction phase (Table 2). Pigs on AA-30% were 9% more efficient and gained 9% faster than pigs on control (P < 0.002) and tended to have greater lean tissue growth rates (P = 0.084; Table 2). Although there was no difference in average daily feed intake between treatments, total feed intake was 6% lesser in pigs on AA-30% than pigs on control (148 v. 157 kg; P < 0.05). These findings are similar to our previous results (Martínez-Ramírez et al., 2008b). The improvements in growth performance observed during the re-alimentation phase cannot be attributed to differences in feeding level and must be the result of changes in the composition of growth or nutrient utilization efficiency.
Growth performance, whole-body protein deposition (Pd) and whole-body lipid deposition (Ld) of entire male pigs during the restriction phase, subsequent re-alimentation phase and combined restriction and re-alimentation phases

1During the restriction phase (15 to 38 kg BW), pigs were fed diets differing in AA content: control, 115% of the calculated amino acid requirements; AA-30%, restriction at 70% of the calculated amino acid requirements. After 38 kg BW, all pigs were fed common non-limiting diets.
2The rate of carcass lean accretion was estimated by the equation reported by NPPC (1991), NPPC (1991), lean (kg/day) = [(3.280 + 0.437 × HCWT + 0.2726 × LMA − 0.3348 × BF) − (0.418 × IWT−1.656)]/day; where HCWT is hot carcass weight (kg), LMA is longissimus muscle area (cm2), BF is 10th rib backfat thickness (mm) and IWT is initial weight (kg).
Over the combined restriction and re-alimentation phases, AA intake restrictions did not affect overall ADG (P > 0.10; Table 2). However, the overall feed efficiency was 3% greater in pigs on AA-30% than pigs on control (P < 0.05; Table 3). The current findings indicate that entire male pigs of this type show complete CG following AA intake restriction during the early grower phase. Besides Wyllie et al. (Reference Wyllie, Speer, Ewan and Hays1969), Fabian et al. (Reference Fabian, Chiba, Kuhlers, Frobish, Nadarajah, Kerth, McElhenney and Lewis2002) and Martínez-Ramírez et al. (2008b), few reports show full CG in terms of BW gain following AA intake restriction. In contrast, in several studies, incomplete or no CG has been observed (Kyriazakis et al., Reference Kyriazakis, Stamataris, Emmans and Whittemore1991; de Greef et al., Reference de Greef, Kemp and Verstegen1992; Chiba et al., Reference Chiba, Kuhlers, Frobish, Jungst, Huff-Lonergan, Lonergan and Cummins2002; Ferguson and Theeruth, Reference Ferguson and Theeruth2002). As discussed previously (Martínez-Ramírez et al., 2008a and 2008b), this discrepancy across studies may be attributed to differences in pig growth rates, season or environmental temperature, diet composition during the re-alimentation phase and timing, duration and severity of nutrient intake restriction between studies.
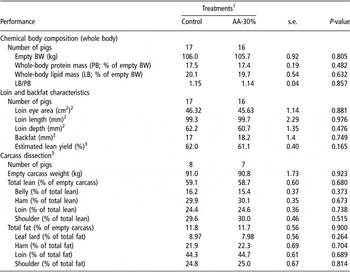
Chemical body composition and carcass characteristics of entire male pigs at 110 kg BW

1During the restriction phase (15 to 38 kg BW) pigs were fed diets differing in amino acid content: control, 115% of the calculated amino acid requirements; AA-30%, restriction at 70% of the calculated amino acid requirements. After 38 kg BW all pigs were fed common non-limiting diets.
2According to the National Pork Producers Council (1991).
3According to the Canadian carcass grading system (Anonymous, 1986).
Ultrasound measurements, chemical body composition and carcass characteristics
Based on ultrasound measurements, at the end of the restriction phase, pigs on AA-30% had greater backfat thickness (7.56 v. 6.56 mm; P < 0.02) and reduced loin area (12.2 v. 14.2 cm2; P < 0.001) compared with pigs on control. These results are consistent with nutrient-induced differences in chemical body composition (Martínez-Ramírez et al., 2008a and 2008b) and suggest that at the end of the restriction phase, pigs on AA-30% were fatter than pigs on control. These results are supported by other studies (Chiba et al., Reference Chiba, Kuhlers, Frobish, Jungst, Huff-Lonergan, Lonergan and Cummins2002; Fabian et al., Reference Fabian, Chiba, Kuhlers, Frobish, Nadarajah, Kerth, McElhenney and Lewis2002).
Ultrasound measurements indicated that during the re-alimentation phase, the nutrition-induced differences in backfat thickness, loin depth and loin eye area between treatments were still evident up to 64 kg BW (P < 0.06; data not shown). These results are consistent with serial slaughter data presented in Martínez-Ramírez et al. (2008b). However, at 80 kg BW, loin depth and loin eye area were no longer different between treatments (P > 0.10), while backfat thickness was still greater in pigs on AA-30% than in pigs on control (11.7 v. 9.5 mm; P < 0.05). At slaughter, probe and manual measurements showed that pigs on AA-30% had numerically greater backfat thickness compared with pigs on control, but these differences were not significant (P > 0.10; Table 3). At slaughter weight, observed relationships between manual and probe backfat thickness measurements (P < 0.003; r = 0.51; n = 15), manual and ultrasound measurements (P = 0.08; r = 0.22; n = 15), and between probe backfat thickness measurements and ultrasound measurements (P < 0.001; r = 0.61; n = 15) may raise some concern about the repeatability and accuracy of these measurements, and of ultrasound measurements in particular, but this needs to be further explored.
At the final BW, physical and chemical composition of the viscera, carcass and whole body as well as weights of primal cuts did not differ between treatments (P > 0.10; Table 3). Moreover, none of the loin meat quality characteristics that were evaluated were influenced by dietary treatments (P > 0.10; data not shown). The results illustrate that the AA intake restriction induced differences in body composition at 38 kg BW but had no significant effects on carcass characteristics at final BW of scale-fed entire male pigs. Similar observations were made in pigs fed ad libitum (Fabian et al., Reference Fabian, Chiba, Kuhlers, Frobish, Nadarajah, Kerth, McElhenney and Lewis2002). The current findings and those reported in Martínez-Ramírez et al. (2008b) suggest that compensation in body composition took place primarily in the carcass. Similar observations were made by Kyriazakis et al. (Reference Kyriazakis, Stamataris, Emmans and Whittemore1991) and Whang et al. (Reference Whang, Kim, Donovan, McKeith and Easter2003).
Body protein deposition, body Ld and lean tissue growth
During the re-alimentation phase, pigs on AA-30% had greater Pd (P < 0.001) and lesser Ld/Pd (P < 0.05; Table 2) than pigs on control, whereas no differences in Pd, Ld and Ld/Pd were observed over the combined restriction and re-alimentation phases (P > 0.10). These results are consistent with previous results and are discussed in detail elsewhere (Martínez-Ramírez et al., 2008b).
Compensatory Pd, which is closely associated with muscle or lean tissue growth, can be attributed to increased hypertrophy of the satellite cells in skeletal muscle tissue and occurs only when the number of muscle fibre cells is not reduced due to nutrient intake restriction (Handel and Strickland, Reference Handel and Strickland1988). Dietary nutrient intake restriction likely reduces hypertrophy of muscle fibres (Lodge et al., Reference Lodge, Sarker and Friend1977; Campbell and Dunkin, Reference Campbell and Dunkin1983), which may explain the poorer growth performance as well as lesser Pd, loin muscle area and loin depth during the restriction phase in pigs on AA-30% than in pigs on control. Since skeletal muscles are attached to bones, the extent of CG may be related to bone length. For example, surgical extension of bone length dramatically increases muscle growth (Novakofski and McCusker, Reference Novakofski and McCusker1993). In the current experiment, the length of the femur did not differ between treatments, neither at 38 (14.1 v. 14.3 cm for control and AA-30%, respectively; P > 0.10) nor at 110 kg BW (19.4 v. 19.2 cm for control and AA-30%, respectively; P > 0.10). Apparently, lengthening of bones is not impeded during AA intake restriction and may act as a control of CG and CPd during the re-alimentation phase.
BUN and endocrine status
Restriction phase
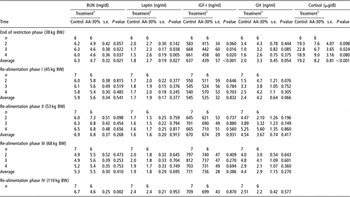
Based on blood samples taken at 2, 3 and 4 h post prandially and at the end of the restriction phase, pigs on control had greater circulating plasma levels of BUN, IGF-I and cortisol and lesser circulating plasma levels of leptin and GH compared with pigs on AA-30% (P < 0.05; Table 4).
Blood urea nitrogen concentration (BUN) and endocrine status of entire male pigs at 2, 3 and 4 post feeding (time) at the end of the restriction phase (38 kg BW) and during the re-alimentation phase

n = number of pigs.
1During the restriction phase (15 to 38 kg BW) pigs were fed diets differing in amino acid content: control, 115% of the calculated amino acid requirements; AA-30%, restriction at 70% of the calculated amino acid requirements. After 38 kg BW, all pigs were fed common non-limiting diets.
Plasma BUN levels reflect the utilization of dietary absorbed AA for Pd. In contrast to other studies (Whang et al., Reference Whang, Donovan and Easter2000 and Reference Whang, Kim, Donovan, McKeith and Easter2003), in the current study BUN values did not differ between 2, 3 and 4 h post prandrial (P > 0.10). The lesser BUN levels observed in pigs on AA-30% compared with control are consistent with the observations made by Whang et al. (Reference Whang, Donovan and Easter2000) and Fabian et al. (Reference Fabian, Chiba, Kuhlers, Frobish, Nadarajah, Kerth, McElhenney and Lewis2002). Because AA intake levels in the blood test diet (Table 1) were similar in both treatments, lesser plasma urea levels in pigs on AA-30% indicate that these pigs had greater Pd than the pigs on control. Likely, pigs on AA-30% already showed some compensatory Pd when the BUN test diet was fed.
Plasma cortisol is a potent stimulant of muscle protein degradation (Ferrando et al., 2001). The substantial reductions in plasma cortisol level due to AA intake restriction suggested that protein degradation is reduced in pigs fed AA-limiting diets. Apparently, reductions in Pd induced by feeding AA-limiting diets is associated with reductions in both protein degradation and protein synthesis. To our knowledge, this study is the first to demonstrate that the lesser plasma cortisol levels in a defined population of pigs is an indicator of AA-induced reductions in Pd in growing pigs.
It has been reported that leptin fulfills the role of adipostat, a sensor of body adiposity (Barb et al., Reference Barb, Yan, Azain, Kraeling, Rampacek and Ramsay1998; Houseknecht et al., Reference Houseknecht, Baile, Matteri and Spurlock1998). The role of adipostat is based on the strong association between leptin gene expression, circulating leptin levels, and body fat content across animals of different genotypes (Frederich et al., Reference Frederich, Hamann, Anderson, Lollmann, Lowell and Flier1995; McDougald et al., Reference McDougald, Hwang, Fan and Lane1995). Leptin receptors are present in the hypothalamus (Chua et al., Reference Chua, Chung, Wu-Peng, Zhang, Liu, Tartaglia and Leibel1996), and increases in plasma leptin concentrations have been shown to inhibit feed intake, reduce Ld, and increase metabolic rate (Campfield et al., Reference Campfield, Smith, Guisez, Devos and Burn1995; Halaas et al., Reference Halaas, Boozer, Blair-West, Fidahusein, Denton and Friedman1997). The role of leptin as an adipostat is confirmed by the increases in plasma leptin levels (Table 4; P < 0.05) at the end of the restriction phase and when AA intake was reduced. The observation that leptin inhibits cortisol synthesis by adrenal cells (Bornstein et al., Reference Bornstein, Uhlmann, Haidan, Ehrhard-Bornstein and Scherbaum1997; Pralong et al., Reference Pralong, Roduit, Waeber, Castillo, Mosimann, Thorens and Gaillard1998) is supported by the negative correlation observed in this experiment between plasma circulating leptin and cortisol (P < 0.01; r = −0.74). In contrast, the observation that leptin increases GH plasma concentration (Barb et al., Reference Barb, Yan, Azain, Kraeling, Rampacek and Ramsay1998) is supported by the positive correlation between plasma levels of the two hormones observed in this experiment (P < 0.01; r = 0.81). To our knowledge, this study is the first to demonstrate that circulating leptin levels reflect nutrition-induced differences in body fatness within a defined population of pigs.
The close relationships between GH, satellite cell proliferation (lean mass) and IGF-I plasma levels have been well documented (Millward Reference Millward1990; Brodsky, Reference Brodsky2006). In other mammalian species, restrictions of protein or energy intake reduced circulating plasma levels of insulin (Millward, Reference Millward1990), tri-iodothyronine (T3) (Clemmons and Underwood, Reference Clemmons and Underwood1991), IGF-I (Hornick et al., Reference Hornick, van Eenaeme, Gérard, Dufrasne and Istasse2000; Whang et al., Reference Whang, Donovan and Easter2000), abundance of hepatic IGF-I mRNA (Straus and Takemoto, Reference Straus and Takemoto1990), and increased plasma IGF-I-binding protein levels (Millward, Reference Millward1990; Clemmons and Underwood, Reference Clemmons and Underwood1991; Smith et al., Reference Smith, Underwood and Clemmons1995). The latter will, via negative feedback mechanisms on the hypothalamic–pituitary axes, lead to an increase in GH secretion and greater plasma GH levels. This is consistent with the observed impact of the AA intake restriction on average plasma IGF-I (P < 0.001) and GH (P = 0.054) levels in the current study (Table 4). The role of the IGF-I axes in regulating cell growth, proliferation and differentiation as well as protein retention and turnover (Millward, Reference Millward1990) is consistent with the observed treatment effects on plasma IGF-I levels, BW gains, Pd, and lean mass at the end of the restriction phase (Tables 2–4).
Re-alimentation phase
There were no long-term effects of the previous AA intake restriction on plasma BUN levels during the re-alimentation phase (P > 0.10). Fabian et al. (Reference Fabian, Chiba, Kuhlers, Frobish, Nadarajah, Kerth, McElhenney and Lewis2002) reported similar findings. However, Whang et al. (Reference Whang, Donovan and Easter2000) observed that during the first week of the re-alimentation phase, BUN was reduced in pigs previously fed AA-limiting diets. In the current experiment at 45 kg BW, pigs on AA-30% had numerically lesser BUN than control; however, the treatment effect was not significant (P > 0.10). These observations suggest that plasma BUN measurements were not sufficiently sensitive to identify treatments effects on Pd during the re-alimentation phase (Table 4; P > 0.10). Whang et al. (Reference Whang, Kim, Donovan, McKeith and Easter2003) concluded that BUN can be used as an indicator of CG. However, this conclusion should be re-evaluated.
At 45 kg BW, plasma GH levels tended to be greater in pigs on AA-30% than in pigs on control (Table 4; P = 0.066). Similarly, leptin levels were numerically greater in pigs on AA-30% than in pigs on control, but this difference was not significant (P > 0.10). Thereafter, treatment-induced differences in circulating leptin, IGF-I and GH concentrations were no longer observed (P > 0.10). This experiment confirms the close relationship between circulating leptin concentration and body fatness as was suggested by others (Fabian et al. Reference Fabian, Chiba, Kuhlers, Frobish, Nadarajah and McElhenney2003). However, both GH and leptin are likely involved in the physiological regulation of body fatness.
In the current study, the plasma levels of IGF-I and GH were consistent with the observations reported by Clemmons and Underwood (Reference Clemmons and Underwood1991) and Smith et al. (Reference Smith, Underwood and Clemmons1995). These authors suggested that during the first days of re-feeding after a nutrient intake restriction, plasma IGF-I levels increase rapidly and in concert with improvements in Pd. The latter is consistent with improvements in N-balance during the first part of the re-alimentation phase, as reported earlier (Martínez-Ramírez et al., 2008b). Circulating IGF-I may either act via endocrine mechanism to stimulate lean tissue growth (Owens et al., Reference Owens, Gatford, Walton, Morley and Campbell1999) or reflect somatic tissue production of IGF-I, which acts as a paracrine growth factor (Clemmons and Underwood, Reference Clemmons and Underwood1991; Smith et al., Reference Smith, Underwood and Clemmons1995).
Conclusions and implications
The current study strongly supports our previous findings on complete CG in pigs with high lean tissue growth potentials following the AA intake restriction during the early growing phase. When combined with our previous findings, CG following a period of AA intake restriction appears to take place within the energy-dependent phase of Pd and to be driven by a target body composition, which may be represented by LB/PB. Complete CG was observed in the whole body (carcass and viscera components), as reflected by the absence of any effect of nutritional history on chemical and physical body composition at the final slaughter weight of 110 kg. The coordinated physiological adaptation to the AA intake restriction involves changes in plasma levels of key hormones that are related to protein and fat metabolism in pigs. During the re-alimentation period, plasma concentrations of leptin and GH appear to control the pigs’ target body composition via the hypothalamic–pituitary axes. Plasma levels of IGF-I may be associated with BW gains and hyperplasia of satellite cells in carcass. To more fully explore the physiological control of growth, other hormones, such as cortisol, insulin, glucagon, testosterone, IGF-binding proteins, T3 and thyroxine (T4) as well as hormone receptors and possibly the expression of selected genes, may need to be monitored.
Acknowledgements
This research was financially supported by Degussa AG, Ontario Pork and the OMAFRA Research Programme at the University of Guelph, Ontario. The authors greatly appreciate and acknowledge the technical assistance of Julia Zhu, Jay Squire, Aileen Libao-Mercado, Morgan Radford, Anooshrokh Rakhshandeh, Drew Woods, Linda Trouten-Radford, Kristina Braun, Manfred Hansel, George Werchola and Chanelle Toerien.