Introduction
The birth weight and early child growth are strong predictor of both short- and long-term health outcomes. Reference Mertens, Benjamin-Chung and Colford1 Birth weight is a marker of intrauterine growth and is associated with subsequent childhood growth patterns, risk of stunting, and later obesity or metabolic syndrome. Reference Cauzzo, Chiavaroli and Di Valerio2
Maternal overweight and obesity significantly increase the risk of gestational diabetes, hypertensive disorders, cesarean delivery, and postpartum complications, as demonstrated in review and meta-analyses studies. Reference Zhang, Zhang and Chi3,Reference Creanga, Catalano and Bateman4 Mechanistically, maternal obesity amplifies pregnancy-associated insulin resistance, disrupts adipokine balance, and promotes chronic low-grade inflammation, with increased levels of proinflammatory cytokines (e.g., TNF-α) and altered placental hormone signaling. Reference Creanga, Catalano and Bateman4,Reference Bellissimo, Beristain and Sloboda5 These changes contribute to placental dysfunction, malperfusion, and inflammatory injury, which are implicated in adverse fetal development and increased neonatal adiposity. Reference Creanga, Catalano and Bateman4,Reference Bellissimo, Beristain and Sloboda5
In this context, investigating dietary factors in mothers with overweight is relevant, as maternal diet quality during pregnancy may directly influence birth weight and early childhood growth trajectories. Such evidence could inform future prevention strategies such investigations might guide future prevention strategies, especially in populations at increased risk of adverse outcomes associated with elevated maternal BMI. Reference Lipsky, Cummings and Siega-Riz6,Reference Saros, Vahlberg and Koivuniemi7
Studies conducted in high-income countries, including the United States, France, the Netherlands and Ireland, have shown that greater maternal adherence to healthier dietary patterns in early pregnancy, such as the DASH or Mediterranean diets, was associated with higher birth weight and a reduced risk of infants being small for gestational age (SGA). Reference Chen, Aubert and Shivappa8,Reference Yisahak, Mumford and Grewal9
In less developed countries, few studies have been conducted, and these have mainly focused on assessing the effects of micronutrient supplementation initiated in early pregnancy on birth weight and infant growth at six months of age. The Women First trial (Democratic Republic of the Congo, Guatemala, India and Pakistan) demonstrated that maternal dietary supplementation starting preconception or in early pregnancy led to improved linear growth and reduced stunting at six months, with the greatest benefits observed in settings with higher baseline nutritional risk. Reference Krebs, Hambidge and Westcott10
Maternal diet during early pregnancy may influence birth weight and infant anthropometric outcomes at six months through several interrelated pathways. Adequate maternal nutrition ensures the supply of essential nutrients for fetal growth and organ development, Reference Reis, Teixeira and Maia11,Reference Van Vliet, Schoenmakers and Willemsen12 supports optimal metabolic health by regulating gestational weight gain and glycemic control, Reference Raghavan, Dreibelbis and Kingshipp13,Reference Kyrkou, Athanasiadis and Chourdakis14 and contributes to healthy placental vascularization and nutrient transport. Reference Reed, Ashley and Silver15,Reference Connor, Kibschull and Matysiak-Zablocki16 Moreover, higher maternal diet quality may shape the infant’s gut microbiota and metabolic programming, with potential downstream effects on growth and adiposity in early infancy. Reference Yang, Snelson and El-Osta17,Reference Barrientos, Ronchi and Conrad18
Diet quality is commonly assessed through indices developed from theoretical frameworks linking foods and nutrients to health outcomes and adapted to specific populations according to cultural dietary patterns, food availability, and physiological needs. In Brazil, the Diet Quality Index Adapted for Pregnant Women (IQDaG) was developed based on the Brazilian Dietary Guidelines and the Ministry of Health’s recommendations for maternal nutrition. 19,Reference Crivellenti, Zuccolotto and Sartorelli20 The IQDaG comprises nine components, including four key nutrients for pregnancy (iron, folate, calcium and omega-3), three food groups (fresh fruits, vegetables and legumes), dietary fiber, and one moderation component representing the percentage of energy from ultra-processed foods (UPF). Reference Santos, Crivellenti and Franco21
Evidence from a previous study indicated that higher IQDaG scores in late pregnancy [≥24 gestational weeks (GW)] were associated with reduced odds of delivering large-for-gestational-age (LGA) infants. Reference Sartorelli, Crivellenti and Manochio-Pina22
These findings reinforce the relevance of assessing maternal diet quality in early pregnancy to better understand its influence on perinatal and early growth outcomes. We hypothesized that higher maternal diet quality during early pregnancy would be associated with more favorable infant growth patterns, characterized by anthropometric measures within the expected range for age and sex. Conversely, we hypothesized that poorer maternal diet quality would be associated with less favorable growth trajectories and a greater likelihood of deviations from adequate growth, including inadequate linear growth and anthropometric indicators at either end of the nutritional spectrum (insufficient or excessive weight).
Accordingly, the present study aimed to investigate the association between the Diet Quality IQDaG score in early pregnancy (3–15 GWs) among Brazilian women with overweight and both newborn anthropometry and infant growth indicators at six months of age.
Materials and methods
The present study is a secondary analysis of the randomized controlled trial “Effectiveness of a minimally processed food-based nutritional counselling intervention on weight gain in overweight pregnant women: a randomized controlled trial,” conducted in a Brazilian municipality with 350 pregnant women with overweight receiving prenatal care at seven health units between 2018 and 2021. Reference Sartorelli, Crivellenti and Baroni23
Women aged 18 years or older, with a pre-pregnancy body mass index (BMI) between 25.0 and 29.9 kg/m2 and GW of up to 15 weeks and 6 days, were included in the study. Exclusion criteria comprised a previous diagnosis of diabetes, use of weight loss medications, or twin pregnancies.
Participants were allocated into control (CG) and intervention (IG) groups based on a spreadsheet with randomly generated numbers. Pregnant women assigned to the IG were invited to participate in three nutritional counseling sessions designed to promote the consumption of fresh and minimally processed foods instead of UPF and to encourage regular physical activity aimed at preventing excessive gestational weight gain.
Pregnant women who agreed to participate provided written informed consent and were subsequently allocated to one of the study groups (counseling or control) using the Research Electronic Data Capture software, which generated a random sequence and assigned participants according to the health unit where they were receiving prenatal care. This allocation criterion was adopted to account for potential differences in prenatal care practices among health units and socioeconomic variability in the regions. At the time of allocation, both the research dietitians and the participants were aware of the group assignment.
The primary objective of the trial was to evaluate the effectiveness of a nutritional counseling protocol on gestational weight gain. The methodology related to the counseling procedures, data collection, assessments, and intervention protocol has been described in a previous publication. Reference Sartorelli, Crivellenti and Baroni23
In previous analysis of the clinical trial, it was observed that nutritional counseling was effective in preventing excessive gestational weight gain. Reference Baroni, Carvalho and Da Silva Santos24 The intervention showed no effect on neonatal fat mass, fat-free mass, or birth weight. Reference Santos, Carvalho and Baroni25 Furthermore, the nutritional counseling had no effect and child anthropometry at six months of age: weight-for-length Z-score, length-for-age Z-score, weight-for-age Z-score and BMI-for-age Z-score. Reference Crivellenti, Carreira and de Lima26
After the intervention period, the proportion of women that reported a frequency of consumption of vegetables ≥10x/week (at lunch and dinner), and frequency of consumption of UPF ≤2 days/week was higher in the IG (51% for vegetables and 76% for UPF), when compared to the CG (35% for vegetables and 62% for UPF), while evaluated by a screener. No difference between groups was found for fruits, legumes or sugary beverages. 27
For this present secondary analysis of the prior randomized controlled trial, a non-probabilistic convenience sampling approach was adopted. All mother–child pairs from the clinical trial with available data on the maternal diet at the beginning of pregnancy and child anthropometric outcomes at birth and 6 months were included in the analyses (Fig. 1). Because this study used a fixed sample derived from the randomized controlled trial, the sample size was determined by the number of eligible participants with complete data rather than by an exposure-specific power calculation. As shown in Table S1, our sample shares key demographic and epidemiological characteristics with the Brazilian population, supporting the external relevance of our findings.
Study flowchart. BMI, body mass index; GW, gestational week.

Figure 1. Long description
A flowchart illustrating the stages of a study on birth weight and early child growth. The study assessed 492 participants for eligibility. 96 participants were excluded due to various criteria such as gestational week, BMI, diabetes, and twin pregnancy. 46 participants declined to participate. 350 participants were randomized into two groups: the control group with 176 participants and the intervention group with 174 participants. Initial losses occurred in both groups: 10 in the control group and 5 in the intervention group due to reasons like loss of contact, withdrawal from the study, and miscarriage. This left 166 participants in the control group and 169 in the intervention group. During follow-up losses in pregnancy, 18 participants were lost in the control group and 38 in the intervention group due to miscarriage, withdrawal from the study, and other reasons. This resulted in 148 newborns in the control group and 131 in the intervention group. Further losses occurred due to various reasons like not attending primary care follow-up, incomplete anthropometric measurements, and no data on the pregnant womanʼs diet in early pregnancy. Finally, 124 newborns in the control group and 114 in the intervention group had primary and secondary birth data plus maternal diet data. At six months, 94 infants in the control group and 98 in the intervention group had complete secondary anthropometric data.
Anthropometric data at birth and at six months
This study included all mother–child pairs with complete data on maternal diet collected at the first assessment (3–15 GW) and complete infant anthropometric measurements of weight (g) and length (cm) at birth and at six months of age.
Information regarding maternal and infant health at delivery was obtained during a face-to-face assessment conducted at the first postpartum visit of the mother and newborn to the health unit (between 3 and 28 days postpartum): either at the time of the neonatal screening test or during the first medical consultation (with the gynecologist or pediatrician).
Data on the child’s sex, birth weight (kg), birth length (cm), and gestational age at delivery were extracted from hospital discharge records. These data were entered into the Neonatal Size Calculator for newborn infants between 24 + 0 and 42 + 6 weeks’ gestation to generate Z-scores for birth weight and length according to the INTERGROWTH-21st criteria [https://intergrowth21.tghn.org/newborn-size-birth/#c4].
Low birth weight (LBW) was defined as birth weight <2500 g, and macrosomia as birth weight ≥4000 g. 28,Reference Gardosi, Chang and Kalyan29 SGA and large for gestational age (LGA) were defined as birth weight below the 10th and above the 90th percentiles for gestational age and sex, respectively, based on a reference population. Reference Slaughter, Lohman and Boileau30
Neonatal adiposity was estimated using anthropometric measurements. The newborn’s weight (g) was measured using a pediatric digital scale (Welmy®), length (cm) was measured using a horizontal infant anthropometer (infantometer), and triceps, subscapular, and thigh skinfold thicknesses (mm) were measured using a Harpenden® skinfold caliper with a precision of 0.2 mm.
Skinfold thicknesses were measured using a technique adapted for neonates. Reference Slaughter, Lohman and Boileau31,Reference Roje, Ivo and Ivica32 The caliper was applied at a 90° angle for the triceps skinfold, measured at the midpoint between the acromion and the olecranon, and at a 45° angle for the subscapular skinfold, measured at the inferior angle of the scapula, and the thigh skinfold, measured at the anterior midpoint of the quadriceps between the inguinal fold and the superior border of the patella. Each measurement was performed in duplicate, and the mean of the two measurements was used for analysis. If the difference between the two measurements exceeded 0.2 mm, a third measurement was obtained and the most discrepant measurement was discarded.
The ponderal index (PI) was calculated by dividing birth weight (g) by birth length (cm) cubed (g/cm3), providing a measure of neonatal body proportionality. PI is an anthropometric indicator widely used to assess fetal growth patterns. By reflecting the proportionality between weight and length at birth, it helps distinguish proportionate from disproportionate fetal growth and may provide additional insight into intrauterine growth restriction or fetal overgrowth. Reference Deierlein, Thornton and Hull33
Neonatal body composition was estimated using the equation proposed by Deierlein et al., which was validated against the air displacement plethysmography (PEA POD®) method. 34
Secondary anthropometric data at six months of age – weight (g) and length (cm) – were obtained from physical medical records at the health units or from the municipal electronic health record system (HygiaWeb). Anthropometric indicators recommended by the World Health Organization (WHO) for monitoring the growth of children under five years of age – including weight-for-age, length-for-age, weight-for-length, and body mass index-for-age – were calculated using the WHO Child Growth Standards with the WHO Anthro software [https://www.who.int/tools/child-growth-standards/software]. These indicators were expressed as Z-scores, which classify children’s growth relative to the WHO reference population. 35
Assessment of maternal diet
After enrollment in the study, during the first assessment (conducted up to the 16th GW), two non-consecutive 24-h dietary recalls (24 h) were collected to assess dietary intake in early pregnancy. The median interval between the two recalls was 8 days (range: 2–44 days), regardless of the day of the week or season. A second 24 h was obtained from 82.9% of the pregnant women. Data collection occurred prior to the nutritional counseling sessions delivered to participants in the intervention group.
The 24 h were collected following the seven-step multiple-pass method. 36 Initially, participants provided a continuous and uninterrupted list of all foods and beverages consumed on the previous day. Subsequently, the research dietitian probed for details on food and beverage characteristics, using a photographic manual to improve portion size estimation. Reference Haubrock, Nöthlings and Volatier37
Participants were also asked about the time and location of each eating occasion. Finally, the dietitian reviewed the updated food list with the participants to confirm completeness and to identify any additional items consumed. When new foods or beverages were recalled, detailed information on their characteristics was collected following the same procedure.
The 24 h data were entered into the Nutrition Data System for Research, developed by the Nutrition Coordinating Center, University of Minnesota (Minneapolis, MN, USA), to estimate energy, macronutrient, and micronutrient intakes.
Usual dietary intake was estimated using the Multiple Source Method, which computes habitual intake based on the probability of consumption on a random day derived from single-day consumption data, thus eliminating the need for a large number of repeated recalls. Reference Monteiro, Cannon and Moubarac38
Usual intake data were used to compute the Diet Quality Index Adapted for Pregnant Women (IQDaG). Reference Crivellenti, Zuccolotto and Sartorelli20 Information on the consumption of food groups – fresh fruits, vegetables, and legumes (in servings per 1000 kcal) – and on intakes of fiber (g), omega-3 fatty acids (g), calcium (mg), folate (µg), and iron (mg) were used to calculate the adequacy components of the index. The percentage of total energy intake derived from UPF and beverages was used to calculate the moderation component of the IQDaG.
To classify the UPF and beverages, the NOVA food classification was employed, and it was expressed in percentage of the total energy (%E) of the diet. UPF are industrial formulations primarily or entirely made from sugar, salt, oils, fats, starches, and many substances derived from foods not typically used in kitchens, and cosmetic additives, including those used to imitate the sensory qualities of natural foods or disguise undesirable qualities of the final product, such as soft drinks, sugar-sweetened beverages, crackers, cookies, instant noodles, flavored yogurts, bread with additives). Reference Monteiro, Louzada and Steele-Martinez39,Reference Tennant, Murray and Arnold40
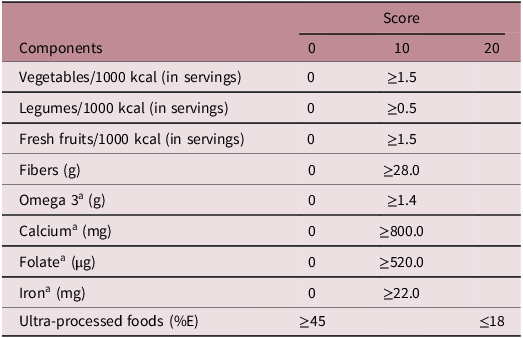
The formulas used to calculate each component of the IQDaG are detailed in Crivellenti, Zuccolotto, and Sartorelli (2018), Reference Crivellenti, Zuccolotto and Sartorelli20 and the corresponding component scores are presented in the Table 1.
Components and criteria for the score of the Diet Quality Index Adapted for Pregnant Women (IQDAG)

Table 1. Long description
A table detailing the components and criteria for scoring the Diet Quality Index Adapted for Pregnant Women. The table has two columns: Components and Score. The Components column lists various dietary components, and the Score column provides the criteria for scoring each component. The table includes the following rows: Vegetables per 1000 kcal in servings, Legumes per 1000 kcal in servings, Fresh fruits per 1000 kcal in servings, Fibers in grams, Omega 3 in grams, Calcium in milligrams, Folate in micrograms, Iron in milligrams, and Ultra-processed foods in percent energy. Each row specifies the threshold values for scoring 0 and 10, except for Ultra-processed foods, which has thresholds for scoring 0 and 20.
Source: Adapted from Crivellenti et al. Reference Crivellenti, Zuccolotto and Sartorelli20
a Estimates from the diet and use of dietary supplements.
%E: energy percentage.
Covariates
Maternal covariates were collected at baseline using structured questionnaires and included maternal age (years), self-reported skin color [(white, black, brown, or yellow) which is used in Brazil as a proxy for race/ethnicity], smoking status (yes/no), years of schooling, socioeconomic status (Brazilian ABEP score), alcohol consumption in the previous month (yes/no) and physical activity (minutes per week).
Statistical analysis
Maternal and child characteristics (at birth and at six months) were described as mean ± standard deviation (SD) for continuous variables and as absolute and relative frequencies n (%) for categorical variables. The distribution of anthropometric indicators was presented for birth outcomes – birth weight and birth length – and for six-month outcomes: weight-for-age (very low weight, low weight, adequate weight, high weight), length-for-age (very short stature, short stature, adequate stature), weight-for-length (severe thinness, thinness, normal weight, risk of overweight, overweight, obesity), and BMI-for-age (severe thinness, thinness, normal weight, risk of overweight, overweight, obesity), all expressed as Z-scores.
Linear regression models were applied to examine the association between the total IQDaG score and neonatal anthropometric parameters – birth weight and length in absolute values and as Z-scores, fat mass (kg), PI (g/cm3) and sum of skinfolds thicknesses (mm) – and at six months of age (weight-for-age Z-score, length-for-age Z-score, weight-for-length Z-score, and body mass index-for-age Z-score). The overall IQDaG score was defined a priori as the primary exposure of interest, based on the study hypothesis that better maternal diet quality during pregnancy is associated with more favorable child anthropometric outcomes at birth and at six months of age.
Covariates included in the regression models were identified a priori through Directed Acyclic Graphs (DAGs), constructed using the DAGitty platform [https://www.dagitty.net/ (Presented in supplementary Material, Figures S1 and S2)]. The DAGs were used to identify the minimally sufficient adjustment set to estimate associations between maternal diet quality and child anthropometric outcomes while minimizing confounding. Reference Mulcaire-Jones and Scanlon41
According to the DAGs, models for birth outcomes were adjusted for maternal smoking (yes/no), education (years of schooling), socioeconomic status [from A (highest status) to E (lowest status)], frequency of alcohol consumption in the previous month (yes/no), physical activity (minutes per week), self-reported skin color (white, black, brown, and yellow), and maternal age (years).
For all models, including those at six months of age, analyses were additionally adjusted for trial allocation (control/intervention) to account for potential influence of the intervention on maternal dietary behavior, which directly contributes to the IQDaG score.
Considering the exploratory nature of the study and the correlated structure of exposures and outcomes, no formal correction for multiple comparisons was applied. Results were interpreted based on the magnitude, direction, consistency, and precision of associations, and 95% confidence intervals. All analyses were conducted using the Statistical Package for the Social Sciences (SPSS, version 24.0), with the significance level set at p < 0.05.
Results
Complete maternal dietary data at early pregnancy and newborn anthropometric data were obtained for 238 mother–child pairs, and complete 6-month anthropometric data were available for 192 infants. No differences were observed between women with and without child data at 6 months (Supplementary Material, Table S2).
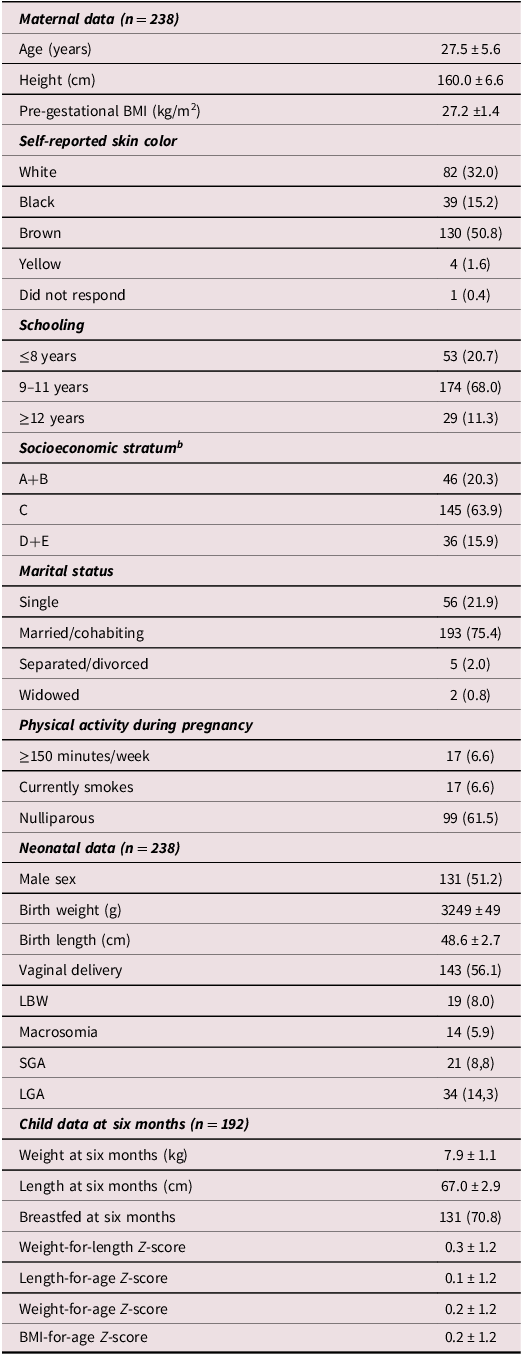
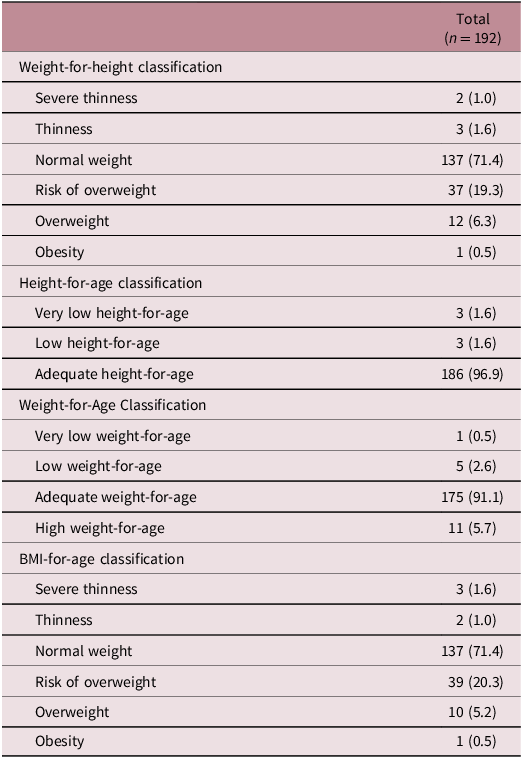
The mean (SD) maternal age was 27.5 (5.6) years, and the mean (SD) pre-pregnancy BMI was 27.2 (1.4) kg/m2. Most women self-reported brown skin color and 63.9% were classified into socioeconomic status C. Among the infants, 51,2% were male, and 56,1% of children were born by vaginally delivery (Table 2). After classifying the children’s anthropometric indicators at six months, it was observed that 71.4% of the children were classified as having normal weight in the weight-for-height parameter; 96.9% of the children presented adequate height-for-age; 91.1% were classified as having adequate weight-for-age; and 71.4% were classified as having normal weight in the BMI/I parameter (Table 3).
Maternal and child characteristics a

Table 2. Long description
A table summarizing maternal and child characteristics. The table has 238 rows and 19 columns. Column headers are: Maternal data (n = 238), Age (years), Height (cm), Pre-gestational BMI (kg/m^2), Self-reported skin color, White, Black, Brown, Yellow, Did not respond, Schooling, <=8 years, 9-11 years, >=12 years, Socioeconomic stratum, A+B, C, D+E, Marital status, Single, Married/cohabiting, Separated/divorced, Widowed, Physical activity during pregnancy, >=150 minutes/week, Currently smokes, Nulliparous, Neonatal data (n = 238), Male sex, Birth weight (g), Birth length (cm), Vaginal delivery, LBW, Macrosomia, SGA, LGA, Child data at six months (n = 192), Weight at six months (kg), Length at six months (cm), Breastfed at six months, Weight-for-length Z-score, Length-for-age Z-score, Weight-for-age Z-score, BMI-for-age Z-score. Row 1: Maternal data (n = 238), Age (years), 27.5 ± 5.6, Height (cm), 160.0 ± 6.6, Pre-gestational BMI (kg/m^2), 27.2 ± 1.4, Self-reported skin color, White, 82 (32.0), Black, 39 (15.2), Brown, 130 (50.8), Yellow, 4 (1.6), Did not respond, 1 (0.4), Schooling, <=8 years, 53 (20.7), 9-11 years, 174 (68.0), >=12 years, 29 (11.3), Socioeconomic stratum, A+B, 46 (20.3), C, 145 (63.9), D+E, 36 (15.9), Marital status, Single, 56 (21.9), Married/cohabiting, 193 (75.4), Separated/divorced, 5 (2.0), Widowed, 2 (0.8), Physical activity during pregnancy, >=150 minutes/week, 17 (6.6), Currently smokes, 17 (6.6), Nulliparous, 99 (61.5), Neonatal data (n = 238), Male sex, 131 (51.2), Birth weight (g), 3249 ± 49, Birth length (cm), 48.6 ± 2.7, Vaginal delivery, 143 (56.1), LBW, 19 (8.0), Macrosomia, 14 (5.9), SGA, 21 (8.8), LGA, 34 (14.3), Child data at six months (n = 192), Weight at six months (kg), 7.9 ± 1.1, Length at six months (cm), 67.0 ± 2.9, Breastfed at six months, 131 (70.8), Weight-for-length Z-score, 0.3 ± 1.2, Length-for-age Z-score, 0.1 ± 1.2, Weight-for-age Z-score, 0.2 ± 1.2, BMI-for-age Z-score, 0.2 ± 1.2.
a Values presented as mean ±S D or n (%).
b According to the Brazilian Economic Classification Criterion, which categorizes socioeconomic status from class A (highest level) to class E (lowest level).
Anthropometric parameters of children at 6 months of age, n = 192 a

Table 3. Long description
The table presents the anthropometric parameters of children at six months of age, with a total sample size of 192. It includes classifications based on weight-for-height, height-for-age, weight-for-age, and BMI-for-age. The table has 19 rows and 2 columns. The columns are labeled Weight-for-height classification, Height-for-age classification, Weight-for-Age Classification, and BMI-for-age classification. The rows list different classifications and their corresponding counts and percentages. For weight-for-height, the classifications include severe thinness, thinness, normal weight, risk of overweight, overweight, and obesity. For height-for-age, the classifications include very low height-for-age, low height-for-age, and adequate height-for-age. For weight-for-age, the classifications include very low weight-for-age, low weight-for-age, adequate weight-for-age, and high weight-for-age. For BMI-for-age, the classifications include severe thinness, thinness, normal weight, risk of overweight, overweight, and obesity. Notable trends include a high percentage of children with normal weight in the weight-for-height parameter (71.4%) and adequate height-for-age (96.9%).
Values presented as n (%).
a Total mother–child pairs included in the sample with primary and secondary data.
Abbreviations: BMI, body mass index.
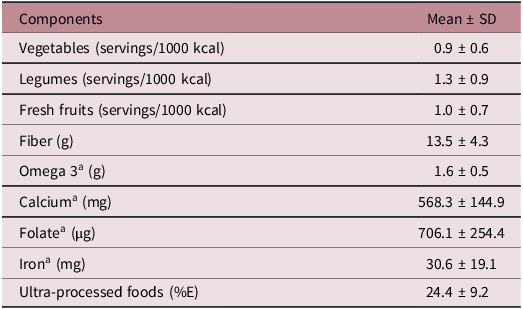
The mean (SD) IQDaG score at early pregnancy was 72.0 (10.9), ranging from 26.0 to 96.5. The distribution of dietary components contributing to the IQDaG is presented in Table 4. The main food sources contributing to the IQDaG components were as follows: fruits – banana, star fruit, and mango; vegetables – eggplant, pumpkin, and zucchini; legumes – brown beans, black beans, and peas; fiber sources – fresh coconut, natural star-fruit juice, and beans; folate sources – liver, mango, and cornmeal soup with collard greens; calcium sources – chocolate-flavored dairy drink, strawberry smoothie, and cheese; iron sources – chicken heart, pork offal stew, and liver; omega-3 sources – sardine pie and tilapia; and UPF – soft drinks, sandwich biscuits, and packaged snacks. The differences in IQDaG scores between early and late pregnancy are presented in Supplementary Table S3. These findings should be interpreted with caution due to the substantial loss to follow-up (56.7%), as dietary data at the end of pregnancy were available for only a reduced number of participants (135 pregnant women).
Estimated intake of the components of the Diet Quality Index Adapted for Pregnant Women (IQDaG) score at the beginning of pregnancy in the study population

Table 4. Long description
A table showing the mean and standard deviation of various dietary components in a study population at the beginning of pregnancy. The table has two columns: Components and Mean ± SD. The Components column lists different dietary components, and the Mean ± SD column provides the mean and standard deviation for each component. The table includes the following rows: Vegetables (servings/1000 kcal) with a mean of 0.9 ± 0.6, Legumes (servings/1000 kcal) with a mean of 1.3 ± 0.9, Fresh fruits (servings/1000 kcal) with a mean of 1.0 ± 0.7, Fiber (g) with a mean of 13.5 ± 4.3, Omega 3 (g) with a mean of 1.6 ± 0.5, Calcium (mg) with a mean of 568.3 ± 144.9, Folate (µg) with a mean of 706.1 ± 254.4, Iron (mg) with a mean of 30.6 ± 19.1, and Ultra-processed foods (%E) with a mean of 24.4 ± 9.2.
a Estimated from diet and dietary supplements.
%E: energy percentage.
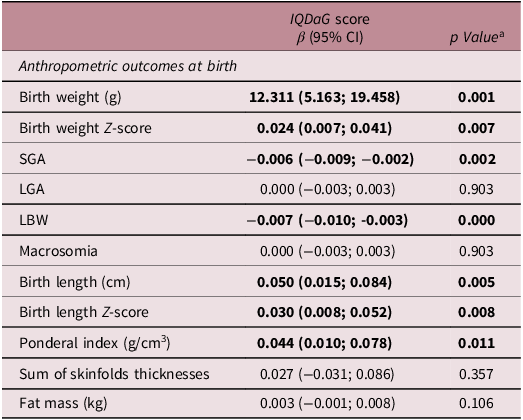
In adjusted linear regression models, higher IQDaG scores at the beginning of pregnancy were positively associated with birth weight (g) (β = 12.311; 95% CI: 5.163, 19.458; p = 0.001), birth weight Z-score (β = 0.024; 95% CI: 0.007, 0.041; p = 0.007), birth length (β = 0.050; 95% CI: 0.015, 0.084; p = .005), birth length Z-score (β = 0.030; 95% CI: 0.008, 0.052; p = .008), and PI (β = 0.044; 95% CI: 0.010, 0.078; p = 0.011). Conversely, higher IQDAG scores were inversely associated with the occurrence of SGA (β = −0.006; 95% CI: −0.009, −0.002; p = 0.002) and LBW (β = −0.007; 95% CI: −0.010, −0.003; p = .000). No statistically significant associations were observed between maternal IQDAG score and LGA, macrosomia, the sum of four skinfold thicknesses, or fat mass at birth (Table 5).
Association between the Diet Quality Index Adapted for Pregnant Women (IQDaG) score at the beginning of pregnancy with child anthropometric parameters at birth. n = 238

Table 5. Long description
A table with 12 rows and 4 columns showing the association between the Diet Quality Index Adapted for Pregnant Women (IQDaG) score at the beginning of pregnancy and child anthropometric parameters at birth. The columns are labeled ʼAnthropometric outcomes at birthʼ, ʼIQDaG scoreʼ, ʼβ (95% CI)ʼ, and ʼp Valueʼ. The rows list various anthropometric outcomes and their corresponding IQDaG score, beta values with 95% confidence intervals, and p-values. Row 1: Birth weight (g), 12.311 (5.163; 19.458), 0.001. Row 2: Birth weight Z-score, 0.024 (0.007; 0.041), 0.007. Row 3: SGA, -0.006 (-0.009; -0.002), 0.002. Row 4: LGA, 0.000 (-0.003; 0.003), 0.903. Row 5: LBW, -0.007 (-0.010; -0.003), 0.000. Row 6: Macrosomia, 0.000 (-0.003; 0.003), 0.903. Row 7: Birth length (cm), 0.050 (0.015; 0.084), 0.005. Row 8: Birth length Z-score, 0.030 (0.008; 0.052), 0.008. Row 9: Ponderal index (g/cm³), 0.044 (0.010; 0.078), 0.011. Row 10: Sum of skinfolds thicknesses, 0.027 (-0.031; 0.086), 0.357. Row 11: Fat mass (kg), 0.003 (-0.001; 0.008), 0.106.
LBW: Low birth weight; LGA: Large for gestational age; SGA: Small for gestational age.
a Linear regression models adjusted for treatment groups (control/intervention), smoking (yes/no), maternal education (years of study), socioeconomic stratum (ABEP score), alcohol consumption in the last month (yes/no), physical activity (minutes per week), self-reported skin color (White/Black/Brown/Yellow), maternal age (years).
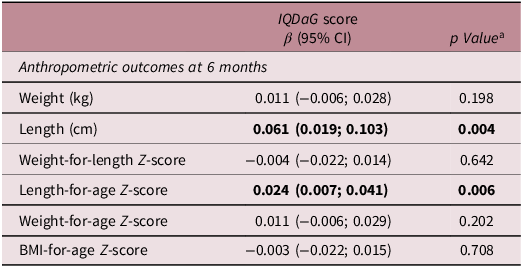
At six months, overall maternal diet quality was positively associated with infant length (cm) (β = 0.061; 95% CI: 0.019, 0.103; p = 0.004) and length Z-score (β = 0.204; 95% CI: 0.007, 0.401; p = 0.006), but no associations were observed between maternal diet quality and weight-related indicators (Table 6).
Association between the score of the Diet Quality Index Adapted for Pregnant Women (IQDaG) at the beginning of pregnancy with infant anthropometric parameters at six months. n = 192

Table 6. Long description
A table titled Association between the score of the Diet Quality Index Adapted for Pregnant Women (IQDaG) at the beginning of pregnancy with infant anthropometric parameters at six months. The table has 8 rows and 3 columns. The columns are labeled IQDaG score beta (95% CI), p Value, and Anthropometric outcomes at 6 months. The rows list different anthropometric outcomes and their corresponding beta values, 95% confidence intervals, and p-values. Row 1: Weight (kg), 0.011 (-0.006; 0.028), 0.198. Row 2: Length (cm), 0.061 (0.019; 0.103), 0.004. Row 3: Weight-for-length Z-score, -0.004 (-0.022; 0.014), 0.642. Row 4: Length-for-age Z-score, 0.024 (0.007; 0.041), 0.006. Row 5: Weight-for-age Z-score, 0.011 (-0.006; 0.029), 0.202. Row 6: BMI-for-age Z-score, -0.003 (-0.022; 0.015), 0.708.
a Linear regression models adjusted for treatment group (control/intervention).
Discussion
In the present study, higher maternal diet quality at the beginning of pregnancy, assessed by the IQDaG score, was positively associated with birth weight, birth weight Z-score, birth length, birth length Z-score, and PI, while being inversely associated with the occurrence of SGA and LBW. No significant associations were observed with LGA, macrosomia, neonatal fat mass, or the sum of four skinfold thicknesses. At six months, higher maternal diet quality remained positively associated with infant length and length Z-score, but not with weight-related indicators.
These results suggest that better maternal diet quality in early pregnancy may be associated with more favorable fetal growth, moreover, the observed positive associations may extend beyond birth outcomes, particularly for linear growth through 6 months of age. These findings are consistent with the hypothesis that maternal dietary patterns during pregnancy may be associated with early growth and developmental trajectories, in line with the Developmental Origins of Health and Disease (DOHaD) framework. Reference Zou, Ngo and Wang42
Maternal diet during early pregnancy can affect birth weight and child anthropometric outcomes at 6 months of age through several interconnected mechanisms. First, maternal diet influences the supply of essential nutrients to the developing fetus, which directly impacts fetal growth and organ development. Reference Reis, Teixeira and Maia11,Reference Van Vliet, Schoenmakers and Willemsen12 Second, maternal dietary patterns modulate maternal metabolic health, including gestational weight gain and glycemic control. Reference Raghavan, Dreibelbis and Kingshipp13,Reference Kyrkou, Athanasiadis and Chourdakis14 Third, maternal diet may influence placental function, including vascular development and nutrient transport capacity, thereby affecting fetal growth trajectories and birth outcomes. Reference Reed, Ashley and Silver15,Reference Connor, Kibschull and Matysiak-Zablocki16 Additionally, maternal diet quality can impact the infant’s gut microbiota and metabolic programming, which may have downstream effects on growth and adiposity at 6 months. Reference Barrientos, Ronchi and Conrad18,Reference Liu, Cheng and Mi43
Regarding birth outcomes, better maternal diet quality during early pregnancy was positively associated with birth weight, birth weight Z-score, birth length, birth length Z-score, and PI, while being inversely associated with the occurrence of SGA and LBW. These findings suggest that adherence to an overall healthy dietary pattern during early pregnancy may support optimal fetal growth. Similar associations between higher maternal diet quality and more favorable birth outcomes have been reported in previous studies. Reference Zou, Ngo and Wang42–Reference Martínez-Galiano, Amezcua-Prieto and Salcedo-Bellido44
Specifically, a large cross-sectional study in China demonstrated that women with medium or high adherence to a dietary pattern rich in legumes, soy products, vegetables, and animal-source foods had significantly higher birth weights and reduced risks of LBW and SGA, with the effect most pronounced among socio-demographically disadvantaged women. Reference Martínez-Galiano, Amezcua-Prieto and Salcedo-Bellido44 A case-control study in Spain found an inverse association between legume intake and risk of small for gestational age (SGA), with higher quintiles of legume consumption associated with lower odds of SGA (trend p = 0.02). Reference Gete, Waller and Mishra45 A systematic review also concluded that maternal diets high in legumes are associated with lower risk of SGA and potentially LBW, though findings across studies are not entirely consistent. Reference Risnes, Vatten and Baker46
SGA and LBW are recognized indicators of impaired fetal growth. LBW is defined as birth weight less than 2500 g and is a predictor of neonatal mortality and morbidity, as well as an increased risk of noncommunicable diseases such as diabetes and cardiovascular disease later in life. Reference Gardosi, Chang and Kalyan29,Reference Larroque, Bertrais, Czernichow and Léger47,Reference de Onis and Habicht48 SGA is defined as birth weight below the 10th percentile for gestational age and sex, based on a reference population, and is widely used as an indicator of impaired fetal growth. Reference McMillen, MacLaughlin and Muhlhausler49 SGA infants have an increased risk of neonatal morbidity and mortality and may also experience adverse long-term outcomes, including impaired growth, neurodevelopmental deficits, and a higher risk of cardiometabolic diseases in later life. Reference Lawn, Ohuma and Bradley50–Reference Silveira, Portella and Goldani53 Therefore, the observed associations reinforce the importance of adequate maternal nutrition during early pregnancy, a critical period of fetal and placental development, and are consistent with the DOHaD hypothesis, which proposes that early-life nutritional exposures can influence health trajectories across the life course. Reference Rodríguez-Bernal, Rebagliato and Iñiguez54
In addition, overall maternal diet quality was positively associated with infant length and z-score length at six months of age, suggesting that the benefits of maternal nutrition during pregnancy may extend beyond birth and continue to influence postnatal linear growth. This association is supported by previous prospective cohort studies that have evaluated maternal dietary patterns using validated indices such as the Dietary Approaches to Stop Hypertension (DASH) score, and the Alternative Healthy Eating Index. Reference Chen, Aubert and Shivappa8,Reference Rodríguez-Bernal, Rebagliato and Iñiguez54
This study has some limitations. Part of the data collection was conducted during the COVID-19 pandemic, a period that affected lifestyle and dietary habits worldwide. This was a secondary analysis of a randomized controlled clinical trial in which participants in the intervention group were advised to increase their intake of fruits, vegetables, and legumes, and to reduce the consumption of UPF. To minimize potential bias related to the intervention, all analyses were adjusted for treatment group (control/intervention); additionally, analyses restricted to participants in the control group were performed.
Although the sample size was relatively small compared with similar studies, it was considered adequate according to the predefined sample size calculation, ensuring sufficient statistical power for the proposed analyses. Another limitation was the use of software based on international food composition databases, which may not fully represent the nutrient composition of foods commonly consumed in Brazil.
Despite these limitations, the study stands out for its strong methodological quality. Data collection was conducted by trained nutritionists, ensuring standardized procedures. The use of the multiple-pass method for dietary recall minimized memory bias, and the application of the Multiple Source Method to estimate usual intake reduced the need for multiple 24-h recall replications.
Conclusion
In conclusion, our findings suggest that better maternal diet quality in early pregnancy, assessed by the IQDaG score, is associated with more favorable fetal growth outcomes, including higher birth weight, birth length, birth weight and length Z-scores, and PI, as well as a lower likelihood of small for gestational age and LBW. Moreover, these associations may extend beyond birth, particularly with respect to linear growth during the first six months of life.
These results emphasize the importance of promoting healthy dietary patterns and nutritionally balanced diets from the beginning of pregnancy. Furthermore, the evidence supports the relevance of public health strategies aimed at improving diet quality among women of reproductive age to prevent adverse early-life outcomes and promote optimal child growth and development.
Future cohort studies with larger sample sizes are warranted to confirm these associations and further elucidate the biological mechanisms linking maternal diet quality during early pregnancy and offspring growth trajectories.
Supplementary material
The supplementary material for this article can be found at https://doi.org/10.1017/S2040174426100749.
Acknowledgements
The authots thank all research team.
Financial support
This study was supported by the São Paulo Research Foundation (FAPESP grants 2017/15386–2, 2017/18980–2, 2021/06486-9, 2021/06586-3, and 2021/06468-0), the National Council for Scientific and Technological Development (CNPq grants 406000/2018–2 and 302487/2018–2), the Coordination for the Improvement of Higher Education Personnel (CAPES; Finance Code 001), and the Teaching, Research and Assistance Support Foundation of the University Hospital, Ribeirão Preto Medical School, University of São Paulo (FAEPA grants 1039/2018, 1114/2018, 61/2019, 62/2019 and 754/2021).
Competing interests
None.
Ethical standard
The authors assert that all procedures contributing to this work comply with the ethical standards of the relevant national guidelines on human experimentation (CNS n° 466/2012) and with the Helsinki Declaration of 1975, as revised in 2008, and have been approved by the institutional committees (Research Ethics Committee of the School Health Center, Ribeirão Preto Medical School, University of São Paulo (Ribeirão Preto, SP, Brazil) under approval numbers CAAE 69.997.717.6.0000.5414 and 97.288.818.0.0000.5414).
Artificial intelligence
During the preparation of this study, the author(s) used ChatGPT to improve the readability and language of the article. Furthermore, Open Evidence was used to assist in the search for bibliographic references related to the topic. After using these tools, the author(s) reviewed and edited the content when needed and take full responsibility for the content of the published article.