1. Introduction
Delamination is a very important Earth science problem that is still poorly understood. Previous studies have proposed corresponding models and mechanics of lithospheric delamination (Bird, Reference Bird1979; Nelson et al. Reference Nelson, Davidson and Sullivan1992; Bonin, Reference Bonin2004; Linda, Reference Linda, Foulger, Natland, Presnell and Anderson2005; Levander et al. Reference Levander, Schmandt, Miller, Liu, Karlstrom, Crow, Lee and Humphreys2011; Jeffery, Reference Jeffery2015). A new hot topic regarding lithospheric delamination is whether the delaminated slab breaks off and sinks into the asthenosphere as an integral whole or in stages. Although the process of lithospheric delamination in orogenic belts cannot be directly observed, large-scale postcollisional magmatic events provide petrologic constraints on delamination (Zhang et al. Reference Zhang, Wang, Li, Jin and Jia2006). Most granites formed by such magmatism are the products of young mantle-derived materials added to the crust through basaltic underplating. Therefore, this type of granite in a postcollisional setting is an important probe to explore the delamination and vertical growth of continental crust (Wang et al. Reference Wang, Tong and Wang2018). In addition, A2-type granite is a special kind of granitic rock widely distributed in the postcollisional stage (Whalen et al. Reference Whalen, Currie and Chappell1987; Eby, Reference Eby1990, Reference Eby1992; Frost et al. Reference Frost, Frost, Chamberlain and Edwards1999). Hence, these A2-type granites not only suggest the dynamic evolution of lithosphere thinning triggered by delamination but also indirectly record the vertical growth of the young crust.
The Altai–eastern Junggar region is a typical accretionary orogen in the Central Asian Orogenic Belt (CAOB), which is located in Xinjiang province, part of NW China, and there was extensive crustal growth in the eastern Junggar in the late Palaeozoic period (Han et al. Reference Han, Ji, Song, Chen and Zhang2006; Wang et al. Reference Wang, Tong and Wang2018). During the early Carboniferous period, the Junggar Ocean closed and the Siberian plate collided with the Kazakhstan–Junggar plate (Liang et al. Reference Liang, Chen, Han, Wu, Zhang, Zhao and Wang2017); whereafter, there is extensive late Palaeozoic postcollisional magmatism in the eastern Junggar. However, owing to the lack of reports on the existence of syncollisional granites (Han et al. Reference Han, Ji, Song, Chen and Zhang2006), when the postcollisional evolution began in this region has long been controversial. In particular, whether the postcollisional magmatism is 305–280 Ma or 325–310 Ma in the Karamaili area has been a hot topic for a long time (Bi et al. Reference Bi, Shen and Xu1994; Han et al. Reference Han, Ji, Song, Chen and Zhang2006). The Karamaili granite belt is a very special example of extensive magmatism in the eastern Junggar, where a series of contemporaneous A2-type granites associated with tin mineral resources are exposed from the postcollisional stage. According to previous reports (Su et al. Reference Su, Tang, Liu, Hou and Liang2006, Reference Su, Tang and Cong2008; Tang et al. Reference Tang, Qu, Su, Hou and Cong2007; Yang et al. Reference Yang, Li, Si, Wu and Jin2010; Han et al. Reference Han, Tang and Gan2012), the Karamaili granite belt is usually defined as an area of concentrated alkali granites exclusive of the Kamusite pluton, which does not have significant alkaline granite characteristics and was once thought to be an S-type granite (Gao & Yang, Reference Gao and Yang1992). With its inconsistent petrographic and geochemical characteristics, the Kamusite pluton differs notably from the other A-type granites in the Karamaili granite belt (Zhang et al. Reference Zhang, Ran and Li2012). This difference may indicate the particularity of the delamination model in the Karamaili tectonic belt. In addition, the A-type granites in the eastern Junggar have strong tin mineralization, which is obviously different from the other granites in the CAOB (Zhang et al. Reference Zhang, Ran and Li2012). Moreover, the Kamusite pluton has widespread mineralization and contains the newly discovered largest tin deposit in this region. However, few studies have focused on the Kamusite pluton, and only a small number of zircon U–Pb dating results and whole-rock Nd isotopes have been reported (Wu et al. Reference Wu, Liao, Chen, Hu, Tian, Wang and Fan2015).
Thus, in this paper, we not only present new zircon U–Pb dating results for the Kamusite granites to define the time limit of magmatism but also report in situ Hf isotope and geochemical data to accurately identify the magmatic source for the Kamusite pluton. Therefore, the systematic study of this pluton provides key constraints on the postcollisional magmatism and mineralization, as well as the delamination model and the vertical growth mechanism in the eastern Junggar. Furthermore, this study also provides a good basis for the comparison of A-type granites from west to east in the Karamaili tectonic belt.
2. Regional geological background and petrography
2.a. Geological background of the Karamaili region
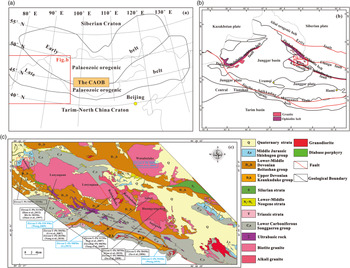
The eastern Junggar orogenic belt located on the northeast margin of the Junggar Basin is an important part of the southwest CAOB and a significant tectonic unit connecting the Altai and Tianshan orogenic belts (Fig. 1a).
(a) Schematic geological map of the Central Asian Orogenic Belt (CAOB) (revised from Zhang et al. Reference Zhang, Chai, Chen, Quan and Gong2019). (b) Simplified tectonic sketch map of the Altai–eastern Junggar Orogenic Belt of Xinjiang Province, NW China (revised from Xu et al. Reference Xu, Jiang, Li, Wu, Zhou and Dong2015). (c) Schematic geological map of the Karamaili tectonic belt.

This region can be subdivided into three structural units (from north to south): (1) the Ertix Fault Zone, which is bounded by the Altai orogenic belt in the north and the eastern Junggar in the south; (2) the Zhaheba–Aerman Ophiolite Belt, which is located on the south side of the Ulungu fault, and was formed in the late Cambrian to Early Ordovician period (Xiao et al. Reference Xiao, Windley, Yan, Qin, Chen, Yuan, Sun, Li and Sun2006; Huang et al. Reference Huang, Niu, Zhang, Wang, Xu, Guo and Yu2013); and (3) the Karamaili tectonic belt, which is the southernmost large tectonic belt in the eastern Junggar region, and is separated from the Junggar Basin in the south by the Karamaili fault (Fig. 1b). The postcollisional magmatism in the eastern Junggar occurred between 330 Ma and 265 Ma, and was mainly concentrated in two periods: 330–310 Ma and 305–280 Ma (Han et al. Reference Han, Ji, Song, Chen and Zhang2006). Currently, there is still a lack of evidence of subduction-related or syncollisional magmatism in this area. There are few reports of I-type and S-type granites, and only the Wutubulake pluton can be identified as a possible S-type granite in the syncollisional stage (Zhou et al. Reference Zhou, Wu, Dong, Zhang, Dong and Tong2009).
The Karamaili tectonic belt is mainly composed of a late Palaeozoic granite belt in the north and the Karamaili ophiolite belt in the south (Fig. 1c). The Karamaili ophiolite belt was formed in the Junggar ocean basin, which began to stretch between the Siberian plate and the Kazakhstan–Junggar plate in the late Silurian period, representing remnants of the ancient oceanic crust (Xiao et al. Reference Xiao, Windley, Yan, Qin, Chen, Yuan, Sun, Li and Sun2006; Zhao et al. Reference Zhao, Xu, Zhang and Yang2012; Xu et al. Reference Xu, Li and Chen2014; Cai et al. Reference Cai, Huang, Liao, Luo and Fan2018). Subsequently, the Junggar ocean basin closed in the Early Devonian period to finally form the Karamaili tectonic belt (Xiao et al. Reference Xiao, Windley, Yan, Qin, Chen, Yuan, Sun, Li and Sun2006; Zhao et al. Reference Zhao, Xu, Zhang and Yang2012, Reference Zhao, Zhu, Liu and Li2017; Xu et al. Reference Xu, Li and Chen2014; Cai et al. Reference Cai, Huang, Liao, Luo and Fan2018).
The Karamaili tectonic belt is dominated by two major sets of strata; one set of basaltic andesite, rhyolitic volcanic breccia and tuff sandstone rocks represents the continental marginal arc of the Lower–Middle Devonian Beitashan Group (Zhao et al. Reference Zhao, Liao, Luo, Tian, Zhang, Wang and Liu2018), and the other set consists of intermediate–mafic volcanic rocks with intermediate–felsic volcanic tuff named the lower Carboniferous Songgaersu Group, which is thought to be an intraplate volcanic rock series (Cai et al. Reference Cai, Huang, Liao, Luo and Fan2018). In addition, the area exposes a small amount of coarse-grained clastic rock series named the Upper Devonian Keankuduke Group molasse formations (Cai et al. Reference Cai, Huang, Liao, Luo and Fan2018).
During the late Carboniferous to early Permian periods, extensive magmatic events occurred, and a large number of granites were emplaced to form a NW-trending granite zone extending W–E for ~130 km (Fig. 1c; Wang et al. Reference Wang, Wang and Wang2011). This large granite belt consists of a series of granitic plutons with a total area of ~1100 km2 (Liu et al. Reference Liu, Yuan and Wu1996). From west to east are the Kamusite pluton with ϵNd(t) values of +3.5 to +6.0 (Wu et al. Reference Wu, Liao, Chen, Hu, Tian, Wang and Fan2015), the 311–302 Ma Laoyaquan pluton (Zhao & Hu, Reference Zhao and Hu1997; Han et al. Reference Han, Tang and Gan2012), the 306–283 Ma Beilekuduke pluton (Li et al. Reference Li, Yang, Zhao, Zhang, Yan, Dai and Xu2007; Yang et al. Reference Yang, Li, Si, Wu and Jin2010), the 313–306 Ma Sabei pluton with ϵNd(t) values of +4.9 to +5.3 and ϵHf(t) of +10.3 (Lin et al. Reference Lin, Yu, Yu, Di and Tian2007; Tang et al. Reference Tang, Qu, Su, Hou and Cong2007), the 305–300 Ma Huangyangshan pluton with ϵNd(t) values of +5.7 to +6.5 and ϵHf(t) of +10.3 to +13.7 (Tang et al. Reference Tang, Qu, Su, Hou and Cong2007; Su et al. Reference Su, Tang and Cong2008; Guo et al. Reference Guo, Jiang, Lu, Xia, Lin and Guo2010), the 304 Ma Sujiquan pluton with ϵNd(t) values of +5.9 to +6.3 and ϵHf(t) of +11.4 (Su et al. Reference Su, Tang, Liu, Hou and Liang2006; Tang et al. Reference Tang, Qu, Su, Hou and Cong2007), etc. In addition, the 360 Ma Wutubulake pluton with ϵNd(t) values of +4.7 to +6.9 is exposed on the north side of the Karamaili belt, and is considered to be an S-type granite of the syncollisional stage (Zhou et al. Reference Zhou, Wu, Dong, Zhang, Dong and Tong2009). Some 388–329.9 Ma basic–ultrabasic rocks (Wang et al. Reference Wang2009; Li, Reference Li2013; Wang, Reference Wang2015) are distributed intermittently in a WNW direction (Fig. 1c), and they form a distinct belt to the south of the granitic plutons in the zone, which is mainly composed of serpentinite, serpentinized peridotite and gabbro, and often remains of plagiogranite, pillow basalt, basalt and radiolarian-bearing tuff in the surrounding area (Tang et al. Reference Tang, Qu, Su, Hou and Cong2007; Zhao et al. Reference Zhao, Xu, Zhang and Yang2012, Reference Zhao, Zhu, Liu and Li2017). The outcrop areas of the ultrabasic plutons are mostly dozens of square kilometres, and most of them are considered to belong to the famous Karamaili ophiolite belt, which records the closure of a remnant ocean basin during the late Silurian to Early Devonian periods (Dong et al. Reference Dong, Zhu and Qu2010; Xiao et al. Reference Xiao, Zhang and Shi2011; Xu et al. Reference Xu, Li and Chen2014; Cai et al. Reference Cai, Huang, Liao, Luo and Fan2018).
2.b. Geological characteristics of the Kamusite pluton
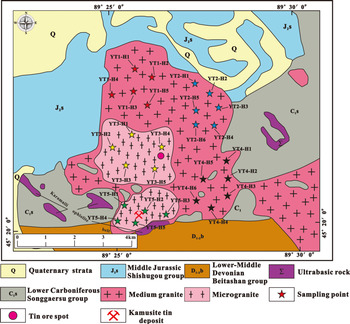
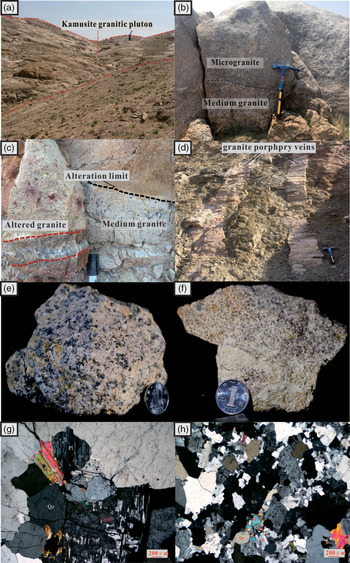
The Kamusite pluton in Fuyun County, Xinjiang Province, NW China, is located in the most western segment of the Karamaili belt and is famous for quartz vein or greisen-type tin deposits. The Kamusite pluton underwent relatively intense denudation and developed five major large outcrops. The granites reported in this paper were collected from the more prominent parts of the five outcrops and cover almost the entire area of the Kamusite pluton (Fig. 2). This pluton is exposed over an area of ~30 km2; the southern region of the pluton mainly intrudes the lower Carboniferous Songgaersu Group, and a few parts of the pluton intrude the Lower–Middle Devonian Beitashan Group. Moreover, there is a sedimentary contact relationship in the northern region with the Middle Jurassic Shishugou Group (Fig. 2). The Kamusite pluton has two main lithologies of medium granite and microgranite, and the two component units show an intrusive contact relationship, as shown in Figure 3b. The microgranites are found in the YT3 and YT5 outcrops, ~7.5–8 km2, in the southwestern part of the pluton, and the medium granites are concentrated in the northeastern larger YT1, YT2 and YT4 outcrops (Fig. 2). Moreover, owing to the strong crustal uplift, the pluton experienced extensive spherical weathering and formed a large area of kaolinization (Fig. 3a, b). These granites are closely related to the tin mineralization (Fig. 3c). The greisenization, potassic alteration and obvious yellow kaolinization are regularly developed in faulted and shattered zones, and most of the quartz veins in the fractured zone host star-shaped cassiterite. The famous Kamusite tin deposit is located in the southern part of this pluton (Fig. 2). There are 62 main ore-bearing greisen veins filling the cracks in the granite, which generally range in length from 50 to 70 m and in width from 1 to 3 m.
Simplified geological map of the Kamusite pluton in the Karamaili tectonic belt.

Field and thin-section photographs of the Kamusite granites. (a) The granite spherical weathering of the Kamusite pluton. (b) Intrusive contact relationship of the two types of granites. Hammer for scale is 80 cm long. (c) Cassiterite quartz vein with altered granite. Pen cap for scale is 5 cm long. (d) Late granite porphyry veins. (e) Medium granite, hand specimen. (f) Microgranite, hand specimen. Diameter of coin used for scale is 18 mm. (g) Medium granite, crossed polars. (h) Microgranite, crossed polars. Qz – quartz; Pl – plagioclase; Kfs – feldspar; Bt – biotite; Ms – muscovite.

In addition, late granite porphyry dykes are frequently present at the edge of the Kamusite pluton (Fig. 3d); meanwhile, there are intrusive contact relationships between a number of ultrabasic rocks and the Kamusite granites in the southern region (Fig. 2; Zhang et al. Reference Zhang, Zhan and Duanmu2018).
The lithologies of the outcrops are mainly medium granite and microgranite in the Kamusite pluton (Fig. 3b). The medium granites mostly have a granitic texture and massive structure, with a porphyritic structure in the marginal facies; they are composed mainly of alkali feldspar (35 %), quartz (30 %), plagioclase (25 %), biotite (8 %) and minor muscovite (≤2 %; Fig. 3e, g), and the grain size ranges from 0.8 × 0.2 mm to 2.4 × 1.4 mm. The microgranites have fine-grained textures and massive structures and are mainly composed of alkali feldspar (40 %; Fig. 3f, h), quartz (32 %), plagioclase (25 %) and minor biotite (≤3 %; Fig. 3f, h), and the grain size ranges from 0.2 × 0.1 mm to 0.8 × 0.3 mm.
3. Analytical approach
The 27 samples used in this paper were collected from the five major rock outcrops of the Kamusite granites, and the sampling locations roughly define the outcrop range. Among them, 17 are medium granites, which are named after outcrops YT1, YT2 and YT4; 10 are microgranites, which are named after outcrops YT3 and YT5. The YT3 and YT5 samples are closely related to the tin mineralization.
3.a. Zircon U–Pb dating
Five samples were carefully chosen from the above two types of granites, and zircon grains were separated at the Regional Geology and Mineral Resources Survey Institute, Langfang, Hebei Province, China. Cathodoluminescence (CL) images and isotopic analyses of the zircons were carried out in the Beijing Yanduzhongshi Geological Analysis Laboratories, Ltd. A New Wave UP213 laser ablation (LA) system and a Brook M90 inductively coupled plasma mass spectrometer (ICP-MS) were used to determine zircon U–Pb ages. The diameter of the laser beam was 30 µm, the instrument was operated at a frequency of 10 Hz and its sensitivity was adjusted using He as the carrier and Ar as the compensation gas. The international standard zircon 91500 was used as an external standard for zircon U–Pb dating. For the steps of the detailed analysis and data processing method, please refer to Kosler et al. (Reference Kosler, Fonneland, Sylvester, Tubrett and Pedersen2002). Isotope values and element content calculations followed the ICP-MS-DATECAL4.3 procedures (Liu et al. Reference Liu, Hu, Gao, Gunther, Xu, Gao and Chen2008, Reference Liu, Gao, Hu, Gao, Zong and Wang2010). The U–Pb concordia plots were processed with Isoplot 3.0 (Ludwig, Reference Ludwig2003).
3.b. Major and trace elements
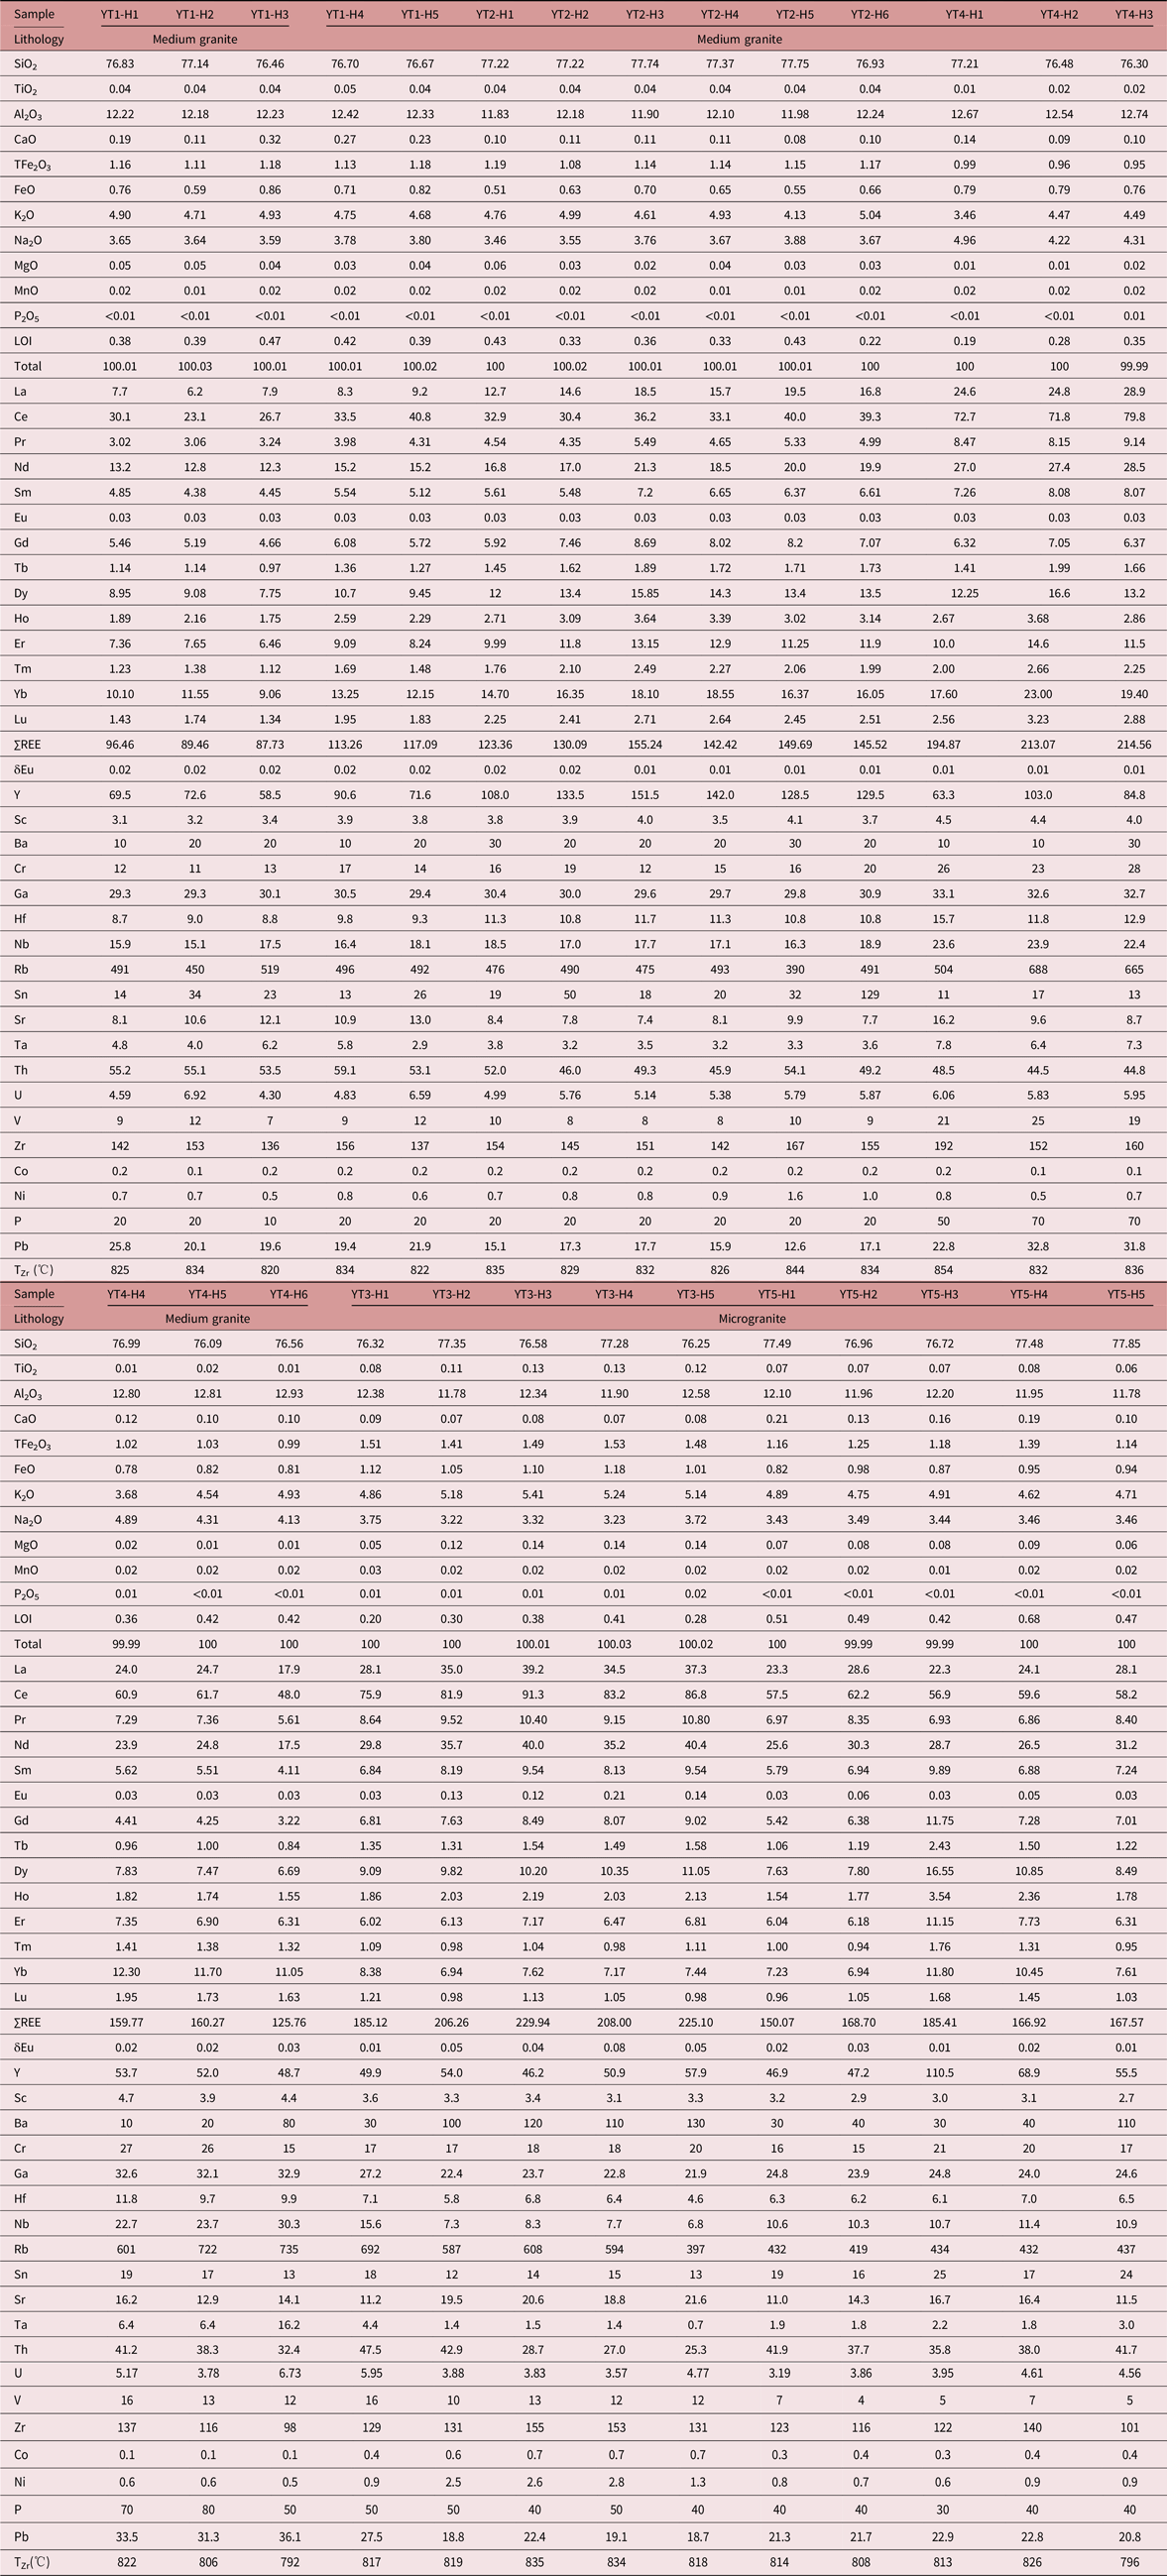
To exactly characterize the chemical compositions of the fresh granites through field and microscope observation, the 27 samples were sent for analysis by the ACTS (Analytical Chemistry and Testing Services) Laboratory Group, Guangzhou city. These samples were selected carefully to thoroughly avoid the late influence of weathering and hydrothermal change. Major elements were analysed using X-ray fluorescence spectrometry (ME-XRF26d), while for trace elements, including rare earth elements (REEs), double-focusing high-resolution (ME-MS61) and plasma spectrometry (ME-MS81) were used. The measured data were required to follow the general rule of an analytical error of less than 5 % compared to standard sample GSR-2. The analytical data for all samples are presented in Table 2.
LA-ICP-MS U–Pb dating data of zircons separated from the Kamusite granitoids

Major (wt %) and trace (×10−6) element data from Kamusite granitoids

3.c. Zircon Lu–Hf analyses
In situ Lu–Hf isotope analysis was performed on zircons using a New Wave UP213 laser ablation system attached to a Neptune-plus multicollector inductively coupled plasma mass spectrometer (MC-ICP-MS) after U–Pb analysis at the Yanduzhongshi Geological Analysis Laboratory, Beijing, China. A nearly 30 μm spot size was used, the laser settings were 8 Hz and 16 J/cm2, and the laser ablation time was 31 seconds. Wu et al. (Reference Wu, Li, Zheng and Gao2007) described the detailed methods and data acquisition protocols. To deduce the interferences of 176Lu and 176Yb on 176Hf, 176Yb/173Yb = 0.78696 and 176Lu/175Lu = 0.02656 were applied to obtain accurate 176Hf signal values. Similarly, to adjust the mass discrimination coefficients of Lu and Hf, the 179Hf/177Hf and 173Yb/171Yb ratios were calculated with the values of 0.7325 and 1.35274, respectively. The international standard Plesovice sample was used for monitoring during zircon Lu–Hf analysis. The details of these analytical results are presented in Table 3.
Zircon Hf isotopic composition of the Kamusite granitoids

4. Analytical results
4.a. Zircon U–Pb chronology
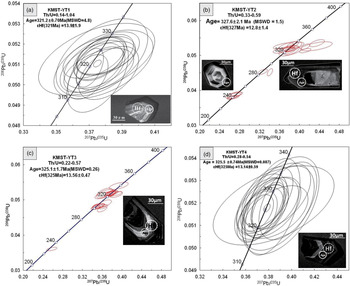
Four samples of the above granites were analysed for LA-ICP-MS U–Pb geochronology: KMST-YT1, KMST-YT2, KMST-YT3 and KMST-YT4. The zircons were studied with CL. The CL images show that the zircons are typically simple and clear and have long columnar shapes with good crystallinity and oscillatory zoning (Fig. 4a–d), and these are all characteristics of magmatic zircons (Koschek, Reference Koschek1993).
Zircon LA-ICP-MS U–Pb concordia plots of the Kamusite granites.

4.a.1. Medium granite
Sixty-eight spots were analysed on 68 zircon grains from samples KMST-YT1, KMST-YT2 and KMST-YT4 of the medium granites (Fig. 4a, b, d). In KMST-YT1, Th values are 49.97–1653 ppm, and U values are 115–11436 ppm, with Th/U = 0.14–1.04 (Table 1). Seventeen analyses were conducted and yield a weighted mean age of 321.2 ± 0.70 Ma (MSWD = 4.8) (Fig. 4a), which represents the crystallization age of the medium granite. In KMST-YT2, the contents of Th and U of 17 spots are 33.16–331.6 ppm and 100.05–853.1 ppm, respectively, while the Th/U ratios are 0.33–0.59 (Table 1). The 206Pb–238U ages range from 336.04 Ma to 321.86 Ma, with a mean age of 327.6 ± 2.1 Ma (MSWD = 1.5) (Fig. 4b). In addition, eight spots on this sample all on the dark rim of the zircon have 206Pb–238U ages ranging from 285.38 Ma to 240.31 Ma, which is more likely to indicate late disturbance. In KMST-YT4, the contents of Th and U are 32.69–267.76 ppm and 72.84–746.88 ppm, respectively, and the Th/U ratios are 0.28–0.54 (Table 1), indicating that the origin of the zircons is obviously magmatic (Hoskin & Black, Reference Hoskin and Black2000). The ages of 26 spots range from 328.67 Ma to 319.62 Ma (Fig. 4d) with a weighted mean age of 325.5 ± 0.74 Ma (MSWD = 0.087). These ages show that the medium granites intruded the country rock in the late Carboniferous period.
4.a.2. Microgranite
Twenty-four spots were analysed on 24 zircon grains from sample KMST-YT3 of the microgranite (Fig. 4c). The Th contents are 67.85–430.7 ppm and U contents are 185.4–885.5 ppm, while the Th/U ratios are 0.22–0.57 (Table 1), also obviously indicating a magmatic origin for the zircons (Hoskin & Black, Reference Hoskin and Black2000). The 206Pb–238U ages of 24 spots range from 326.77 Ma to 282.32 Ma (Table 1), and these analyses are clustered on the concordia with a recorded weighted mean age of 325.1 ± 1.7 Ma (MSWD = 0.26) (Fig. 4c). Therefore, similar to the medium granites, the microgranites have ages that indicate they were also emplaced into the same wallrock in the late Carboniferous period.
4.b. Lu–Hf isotope characteristics
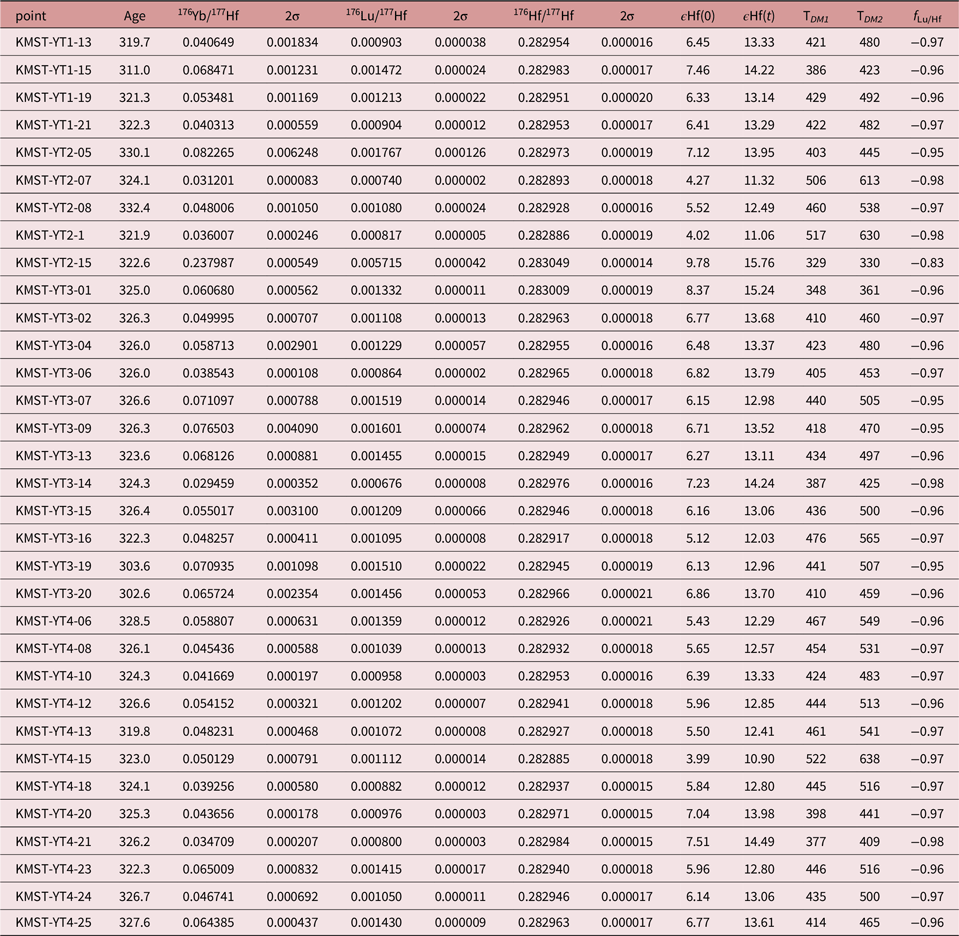
Ninety-one zircons with U–Pb geochronology were chosen for in situ Lu–Hf isotope analyses, and the useful Hf isotope data of 33 spots are listed in Table 3.
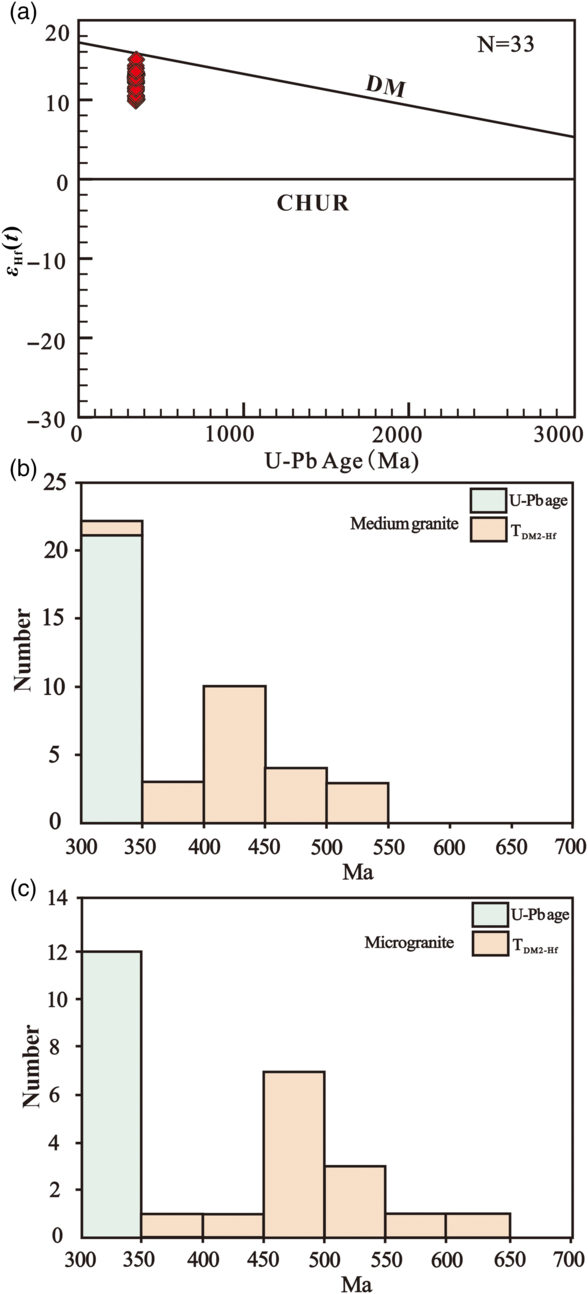
Twenty-one Hf isotope analyses were carried out on 21 zircon grains from samples KMST-YT1, KMST-YT2 and KMST-YT4 of the medium granites. The 176Lu/177Hf ratios range from 0.000740 to 0.005715; the average ratio is 0.001329, which is less than 0.002; the 176Yb/177Hf ratios range from 0.031201 to 0.237987; and the average ratio is 0.049629 (Table 3). These analytical results indicate that the rare decay of 176Lu into 176Hf occurred after zircon formation; accordingly, 176Hf/177Hf ratios are used to represent the Hf isotope composition in zircon crystallization (Wu et al. Reference Wu, Li, Zheng and Gao2007). The 176Hf/177Hf ratios range from 0.282885 to 0.283049 (the average is 0.282946) with ϵHf(t) from +10.9 to +15.76 in the U–Pb dated zircon grains (Table 3; Fig. 5a), while the U–Pb ages of the zircons analysed for Hf isotopes lie between 311.0 Ma and 332.4 Ma. The Hf (TDM1) model ages range from 329 Ma to 522 Ma (average: 436.2 Ma), and correspondingly, the Hf (TDM2) model ages range between 330 Ma and 638 Ma (average: 501.7 Ma), with f Lu/Hf ranging from −0.83 to −0.98 (Table 3; Fig. 5b).
Zircon Hf isotopic composition diagrams for the Kamusite granites. (a) ϵHf(t) versus U–Pb age (Ma). (b, c) Histograms of U–Pb ages and Hf (TDM2) model ages.

Twelve points with U–Pb ages were measured for Lu–Hf isotopes in KMST-YT3 zircon grains from the microgranites. The 176Lu/177Hf ratios vary from 0.000676 to 0.001601 (average: 0.0012545); the 176Yb/177Hf ratios range from 0.029459 to 0.076503 (average: 0.057754) (Table 3). These values indicate that scarcely any radiogenic Hf accumulated after zircon crystallization (Griffin et al. Reference Griffin, Pearson, Belousova, Van Achterbergh, O’Reilly and Shee2000; Wu et al. Reference Wu, Li, Zheng and Gao2007; Yu et al. Reference Yu, Liu, Li, Chen and Dai2013). The zircon grains show Hf (TDM1) and Hf (TDM2) model ages ranging from 348 Ma to 476 Ma (average: 419 Ma) and 361 Ma to 565 Ma (average: 473.5 Ma), respectively. The 176Hf/177Hf ratios range from 0.282917 to 0.283009 (the average is 0.282958), with ϵHf(t) and f Lu/Hf ranging from +12.03 to +15.24 and −0.95 to −0.98, respectively, and measured U–Pb ages of between 302.6 Ma and 326.6 Ma (Table 3; Fig. 5c).
4.c. Major elements
The samples of medium granite show SiO2 enrichment (76.09–77.75 wt %) and K2O and Na2O values of 3.46–5.04 wt % and 3.46–4.96 wt %, respectively, while Al2O3 values vary from 11.83 to 12.93 wt %, total Fe2O3 values range from 0.95 to 1.19 wt %, and CaO values range from 0.08 to 0.32 wt %. In addition, MgO and TiO2 values are extremely low. Moreover, the microgranite has SiO2 = 76.25–77.85 wt %, K2O = 4.62–5.41 wt %, Na2O = 3.22–3.75 wt %, Al2O3 = 11.78–12.58 wt %, total Fe2O3 = 1.14–1.53 wt % and CaO = 0.07–0.21 wt %; similarly, MgO, TiO2 and P2O5 values are very low (Table 2).
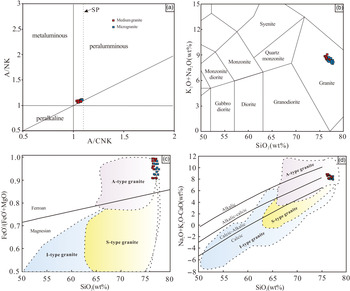
The Kamusite granites all plot within the granite field on the total alkali versus silica (TAS) diagram (Fig. 6b). Moreover, all samples plot mainly near the boundary of the alkalic–calcic field in the modified alkali–lime index (MALI) versus SiO2 diagram (Fig. 6d), and the MALI values are 7.89–8.96. The A/CNK values change from 1.034 to 1.089 and plot in the weak peraluminous field on the A/NK versus A/CNK diagram (Fig. 6a). Moreover, the high FeOt/(FeOt + MgO) ratios (0.91–0.99) indicate that these granites can remarkably be described as belonging to the ferroan series (Fig. 6c).
Major-element geochemical plots for the Kamusite granites (Middlemost, Reference Middlemost1994; Maniar & Piccoli, Reference Maniar and Piccoli1989; Frost et al. Reference Frost, Arculus, Barnes, Collins, Ellis and Frost2001). (a) A/NK versus A/CNK. (b) K2O + Na2O versus SiO2 (wt %) (c) FeOt/(FeOt + MgO) versus SiO2 (wt %). (d) K2O + Na2O − CaO versus SiO2 (wt %).

In addition, although the relationships between SiO2 and the other elements in the Harker illustrations do not intuitively show the evolutionary relationship between the medium granites (KMST-YT1, YT2, YT4) and the microgranites (KMST-YT3, YT5), they show that fractional crystallization had certain effects on the geochemical changes, which are summarized as follows (Fig. 7a–f). The obviously negative correlations between SiO2 and ALK and Al2O3 and the slightly negative correlation between SiO2 and Rb jointly indicate the fractional crystallization of alkali feldspar (Fig. 7a, e). On the other hand, SiO2 is not associated with TFe2O3 and MgO (Fig. 7c) because the water-bearing mineral contents reached the lower limit that is represented by only the typical star-like or interstitial biotite in petrography (Fig. 3e–h). SiO2 also has no obvious correlation with Zr.
Harker variation diagrams for the Kamusite granites.

Overall, the two types of granites both belong to the high-silica, alkali-rich and weakly peraluminous series, on the basis of almost identical zircon U–Pb ages (328–321 Ma) and field emplacement relationships (Fig. 3a, b).
4.d. Trace elements
The samples of the above granites indicate strong depletions in Ba, Sr, Ti, P and Eu and enrichments in Hf, Y and Ce (Fig. 8b; Table 2). These samples show low Zr values in the range of 98–192 ppm, Sc values in the range of 2.7–4.7 ppm, V values in the range of 4.0–25 ppm and extremely low Co in the range of 0.1 to 0.7 ppm. Additionally, the samples of medium granite show total REEs that are between 87.73 and 214.56, no obvious fractionation of light and heavy rare earth elements (LREE/HREE = 1.23–3.43, LaN/YbN = 0.51–1.99), and highly negative Eu anomalies (δEu = 0.01–0.03) on a chondrite-normalized REE diagram (Fig. 8a; Table 2). In addition, the samples of microgranite have nearly similar total REEs (150.07–229.94 ppm), LREE/HREE (2.06–4.84), LaN/YbN (1.78–4.85) and Eu anomalies (δEu = 0.01–0.08) (Fig. 8a; Table 2).
(a) Chondrite-normalized REE patterns (normalized values from Sun & McDonough, Reference Sun, McDonough, Saunders and Norry1989). (b) Primary mantle normalized incompatible trace-element patterns (normalized data from Wood et al. Reference Wood, Joron, Treuil, Norry and Tarney1979).

5. Discussion
5.a. Time scales of magmatism in the Karamaili belt
The LA-ICP-MS zircon U–Pb ages of the Kamusite microgranite and medium granite are 327.6 ± 2.1, 325.5 ± 0.74, 321.2 ± 0.70 and 325.1 ± 1.7 Ma, respectively. These ages are older than the time scales of 313–283 Ma of the other six plutons (Su et al. Reference Su, Tang, Liu, Hou and Liang2006, Reference Su, Tang and Cong2008; Li et al. Reference Li, Yang, Zhao, Zhang, Yan, Dai and Xu2007; Tang et al. Reference Tang, Qu, Su, Hou and Cong2007; Yang et al. Reference Yang, Li, Si, Wu and Jin2010; Han et al. Reference Han, Tang and Gan2012) in the Karamaili belt, and the time scale of postcollisional magmatism is advanced to about 325 Ma. Moreover, these ages reported in this paper support only the previous understanding that 325–310 Ma (Han et al. Reference Han, Ji, Song, Chen and Zhang2006) magmatism existed in the Karamaili belt. The U–Pb age of 285.38–240.31 Ma cannot be used as evidence supporting 305–280 Ma magmatism, as the younger spots on the rim of the zircon are due to late hydrothermal alteration.
5.b. Petrogenesis of the Kamusite granites
5.b.1. Geochemical signatures
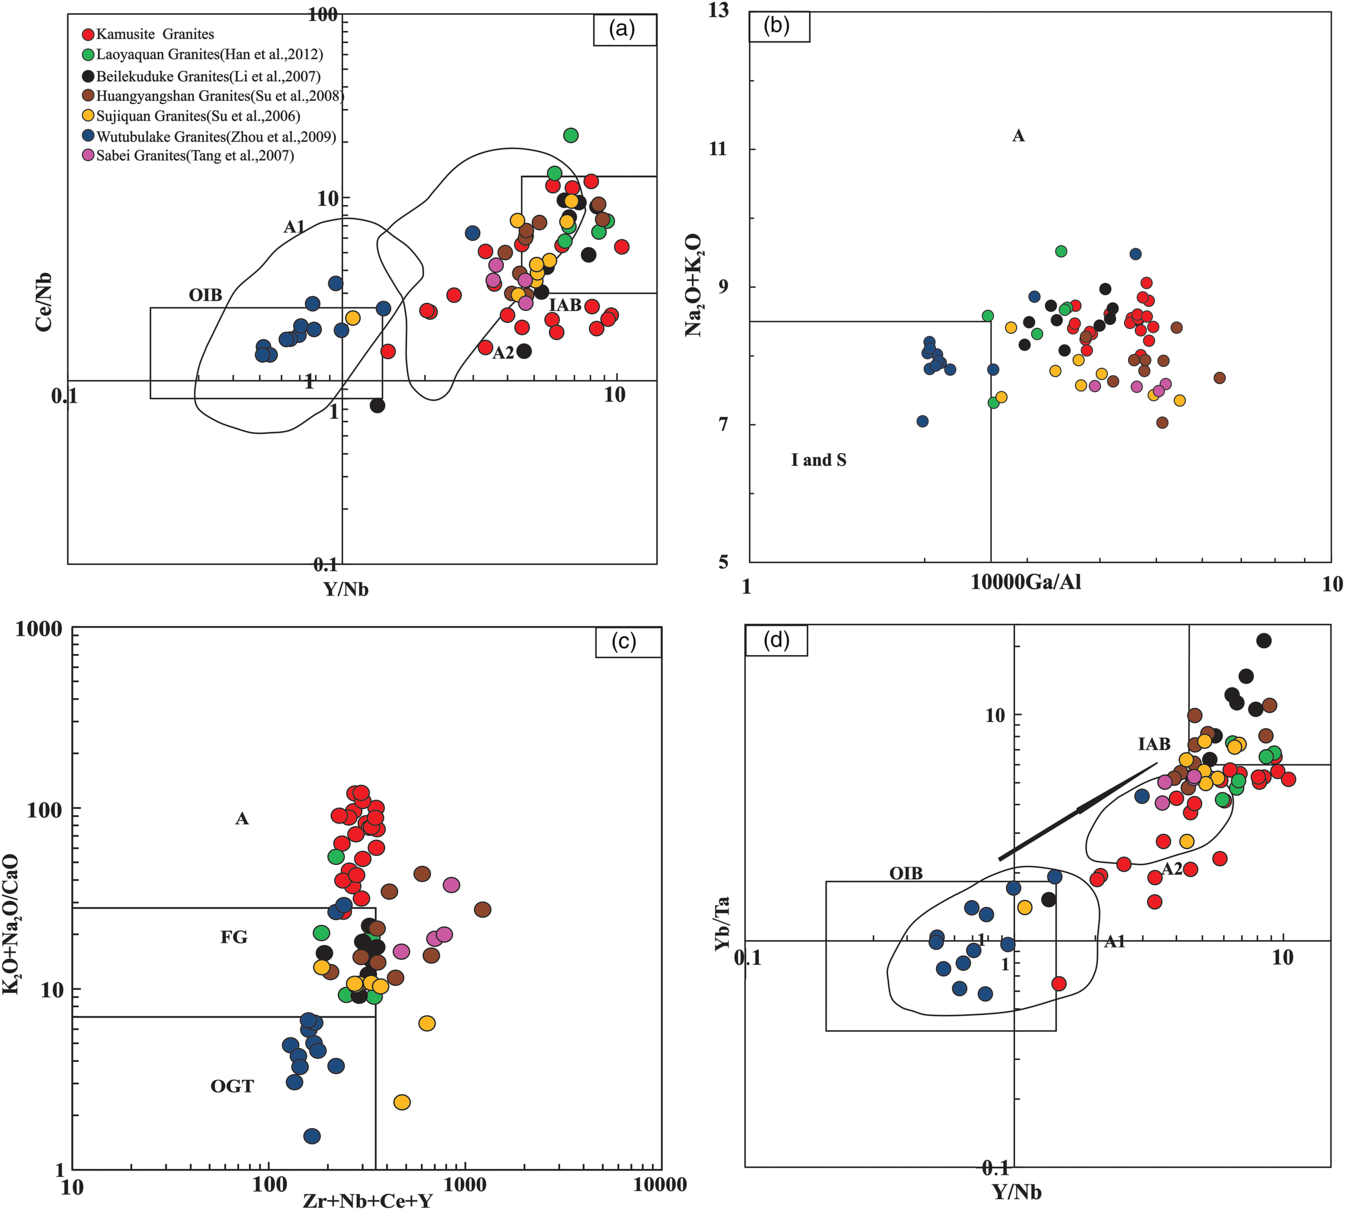
Firstly, features such as high SiO2 (76.09–77.85 wt %), K2O + Na2O (8.01–9.06 wt %), Fe index (0.91–0.99), 10 000 * Ga/Al ratios (3.4–5.3), Zr (98–192 ppm), Hf (4.6–15.7 ppm), Nb (6.8–30.3 ppm) and Sr (7.4–21.6 ppm) contents suggest that the Kamusite granites fall within the category of A-type granites (Collins et al. Reference Collins, Beams, White and Chappell1982; Whalen et al. Reference Whalen, Currie and Chappell1987; Frost et al. Reference Frost, Frost, Chamberlain and Edwards1999; Schmitt et al. Reference Schmitt, Emmermann, Trumbull, Bühn and Henjes-Kunst2000). Additionally, the plot of Na2O + K2O versus 10 000 * Ga/Al (Whalen, Reference Whalen1986; Eby, Reference Eby1990), with the data for the Kamusite granites plotting in the field of A-type granites, is consistent with the Laoyaquan pluton, Beilekuduke pluton, Sabei pluton, Huangyangshan pluton and Sujiquan pluton (Su et al. Reference Su, Tang, Liu, Hou and Liang2006, Reference Su, Tang and Cong2008; Tang et al. Reference Tang, Qu, Su, Hou and Cong2007; Yang et al. Reference Yang, Li, Si, Wu and Jin2010; Han et al. Reference Han, Tang and Gan2012). The Kamusite granite differs notably from the 360 Ma Wutubulake pluton (Zhou et al. Reference Zhou, Wu, Dong, Zhang, Dong and Tong2009) on the north side of the Karamaili belt (Fig. 9b).
Discrimination diagrams for A-type granite (Reference Whalen, Currie and ChappellWhalen et al. 1987; Eby, Reference Eby1990). (a) Ce/Nb versus Y/Nb plot. (b) K2O + Na2O versus 10 000 Ga/Al plot. (c) (K2O + Na2O)/CaO versus Zr + Nb + Ce + Y plot. (d) Yb/Ta versus Y/Nb plot. OIB – oceanic-island basalts; IAB – island-arc basalts; FG – fractionated felsic granites; OGT – unfractionated M-, I-, S-type granites.

The zircon ϵHf(t) values of the Kamusite granites vary from +10.9 to +15.76 (average of +12.99). As can be seen from the ϵHf(t) versus age diagram, all data plot below, but near to, the depleted mantle reference line (Fig. 5a), indicating that the sources of the Kamusite granite were mainly contributed by mantle-derived materials. Moreover, the two-stage Hf model ages (TDM2) of the medium granite and microgranite are 638–330 Ma and 565–361 Ma (Fig. 5b, c), which are close to the corresponding U–Pb ages (327–321 Ma), also indicating that the Kamusite granite was mainly formed by the melting of juvenile crust.
Although the Kamusite granites show characteristics similar to those of high-silica S-type granites because of their weakly peraluminous character (1.0 < A/CNK < 1.1) and associated tin mineralization (Chappell, Reference Chappell1999), they lack dark and aluminium-rich minerals, making them different from the typical I- and S-types. Likewise, only a few I-type or S-type plutons are found in the eastern Junggar, such as the 360 Ma Wutubulake pluton, and field evidence of a lack of I-type or S-type granites suggests that the Kamusite granites did not form by crystal fractionation near the roof of an I- or S-type pluton (Whalen, Reference Whalen1983).
Additional points further prove that the Kamusite rocks can be identified as A-type granites, as listed below.
-
(1) Based on petrographic observations, we can see that the two types of granites are composed of sodic plagioclases and rarely contain any alkaline dark minerals and water-bearing minerals (Fig. 3e–h), which probably suggests an anhydrous environment in accordance with A-type granites.
-
(2) The Kamusite granites are completely ferroan and contain high silica (Fig. 6c), and have higher FeOt (0.86–1.39 wt %, average 1.08 wt %, >1.00 wt %) than I-type granites or highly fractionated I-type granites (FeOt < 1.00 wt %) (Eby, Reference Eby1990; Frost et al. Reference Frost, Arculus, Barnes, Collins, Ellis and Frost2001). As shown in Figure 9c, almost all data for the Kamusite granites are scattered in the field of A-type granites, which can be easily distinguished from highly fractionated felsic I-type granites (White et al. Reference White, Clemens, Holloway, Silver, Chappell and Wall1986).
-
(3) The Kamusite granites contain very low Sr contents (7.4–21.6 ppm, average 12.7 ppm), which is obviously less than the contents in classic I-type granites (Xin et al. Reference Xin, Sun, Li, Yan, Zhang, Wang, Shen and Yang2018), and distinctly discriminated from highly fractionated I-type granites (Patiño Douce, Reference Patiño Douce1997).
-
(4) The strongly negative Eu anomalies (δEu = 0.01–0.08) in chondrite-normalized REE patterns are considered the most significant geochemical indications of A-type granites (Hermes et al. Reference Hermes, Gromet, Zartman, Boothroyd and Hermes1981; Collins et al. Reference Collins, Beams, White and Chappell1982; Jackson et al. Reference Jackson, Walsh and Pegram1984; Whalen et al. Reference Whalen, Currie and Chappell1987; Zhang, Reference Zhang2013).
-
(5) The TZr values of the Kamusite granites are 792–854 °C (average 824 °C), which is higher than the average temperature (764 °C) for highly fractionated I-type granites (King et al. Reference King, White, Chappell and Allen1997), and are formed by partial melting at elevated temperatures (>830 °C) of an essentially anhydrous source (Collins et al. Reference Collins, Beams, White and Chappell1982; Clemens et al. Reference Clemens, Holloway and White1986).
A-type granites can be further chemically divided into two groups: the A1 group and the A2 group (Eby, Reference Eby1990, Reference Eby1992). And, in fact, the A2-type, or postcollisional granites, are often difficult to define in the I-, A- or S-type classification. According to the Ce/Nb versus Y/Nb and Yb/Ta versus Y/Nb plots, the samples of the Kamusite pluton plot along a trend extending towards the island-arc basalt (IAB) and A2 areas (Fig. 9a, d), suggesting that the granites are A2-type granites rather than A1-type granites. This result indicates that the sources were originally formed by subduction or continent–continent collision. Furthermore, the results show that the Kamusite granites have Y/Nb ratios of 1.61–10.33 (average 5.70), which is in good agreement with A2-type granites (mean Y/Nb ratios >1.2; Eby, Reference Eby1990, Reference Eby1992).
5.b.2. T–P–H2O–ƒO2 conditions of the initial melt and tin mineralization
It is generally accepted that A2-type granites form in a low-pressure environment in the shallow crust (Anderson & Bender, Reference Anderson and Bender1989; Patiño Douce et al. Reference Patiño Douce, Humphreys and Dana Johnston1990; Breiter, Reference Breiter2011). In addition, these magmas are emplaced as high-temperature partial melts (Eby, Reference Eby1990, Reference Eby1992; Frost, Reference Frost and Lindsley1991; Turner et al. Reference Turner, Sandiford and Foden1992; King et al. Reference King, White, Chappell and Allen1997; Houseman & Molnar, Reference Houseman, Molnar, Miller, Holdsworth, Buick and Hand2001; Bonin, Reference Bonin2007; Wu et al. Reference Wu, Li, Zheng and Gao2007).
Low-temperature granites generally contain more residual zircons, likely to be saturated in Zr, compared to high-temperature granites (Miller et al. Reference Miller, McDowell and Mapes2003; Wu et al. Reference Wu, Li, Zheng and Gao2007). Zircon saturation temperatures (TZr) of the Kamusite granites range from 792 °C to 854 °C (average 824 °C) (Table 2), and these TZr values represent the lower limit of the primitive magma (Miller et al. Reference Miller, McDowell and Mapes2003), so the initial melt temperature would definitely have been >824 °C.
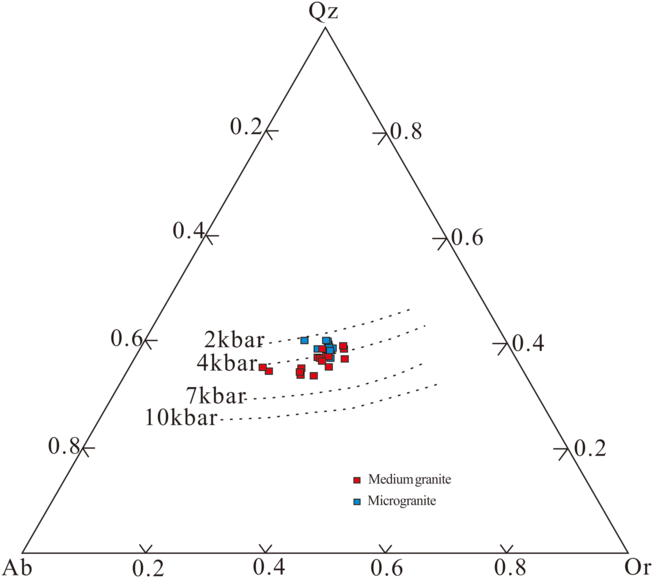
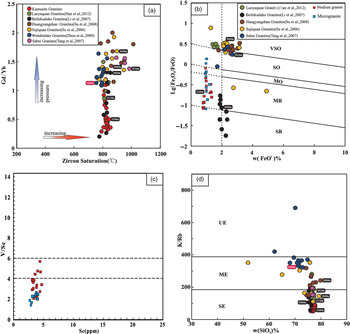
For felsic melts, given the absence of muscovite and hornblende in the Kamusite granites, the pressures in the magma chamber can be accurately inferred by normative Qz–Ab–Or compositions (Anderson & Cullers, Reference Anderson and Cullers1978; Anderson & Bender, Reference Anderson and Bender1989). All of the Kamusite granites plot near the 2–7 kbar isobars, mostly clustering at 2–4 kbar (Fig. 10), indicating relatively low pressure (<5 kbar) and a shallow source depth of ≤23 km (Xin et al. Reference Xin, Sun, Li, Yan, Zhang, Wang, Shen and Yang2018). In addition, the contents of Sr and Yb in granites are closely related to the pressure in the magma chamber (Zhang et al. Reference Zhang, Wang, Li, Jin and Jia2006); the low Sr contents (7.4–21.6 ppm, <100 ppm) and high Yb contents (6.94–23 ppm, >2 ppm) of the Kamusite granites seem to imply low-pressure conditions (Defant & Drummond, Reference Defant and Drummond1990). As shown in Figure 13a, the Kamusite granites with low Gd/Yb ratios (0.29–1.21, <2) should have been formed by dehydration melting at a shallow crustal level with high magma temperature and low melting pressure (Zhu et al. Reference Zhu, Zheng, Xu, Simon and Chen2016).
Normative Qz–Ab–Or composition of the Kamusite granites relative to experimental melt compositions (Anderson & Bender, Reference Anderson and Bender1989).

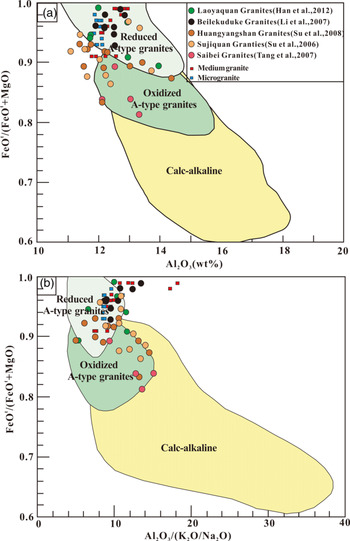
It is not feasible to infer the magmatic fO2 values owing to high SiO2 (76.30–77.85 wt %, >72 wt %) and low FeO* (0.9 × Fe2O3 + FeO = 0.86–1.39 wt %, <2 wt %) contents (Blevin, Reference Blevin2004). Dall’Agnol & Oliveira (Reference Dall’Agnol and Oliveira2007) suggested that oxidized and reduced A-type granites can be more accurately distinguished by the FeOt/(FeOt + MgO) and Al2O3/(K2O/Na2O) ratios instead of using the boundary between ilmenite and magnetite-series granites to define reduced or oxidized A-type granites. Whole-rock FeOt/(FeOt + MgO) ratios of the Kamusite granites range from 0.91 to 0.99, >0.88, clearly showing the characteristics of reduced granites (N. P. Teixeira, unpub. Ph.D., Univ. São Paulo, 1999; Dall’Agnol et al. Reference Dall’Agnol, Teixeira, Rämö, Moura, Macambira and Oliveira2005). Moreover, the low V/Sc ratios (1.38–5.68) of the samples prove a reduced magmatic source (Lee et al. Reference Lee, Leeman, Canil and Li2005). In addition, according to the discrimination diagram (Fig. 11a, b), most data for the Kamusite samples plot in the reduced A-type granite region, which is obviously different from the Huangyangshan pluton, Sujiquan pluton and Sabei pluton in the oxidized A-type granite region.
The composition of representative oxidized and reduced A-type granites (Dall’Agnol & Oliveira, Reference Dall’Agnol and Oliveira2007). (a) FeOt/(FeOt + MgO) versus Al2O3 plot. (b) FeOt/(FeOt + MgO) versus Al2O3/(K2O/Na2O) plot.

Combining these data with the characteristics of low loss on ignition (LOI) (average 0.38 wt %) and the absence of water-bearing minerals, the initial magmatic environment of the Kamusite granites can be considered to have featured anhydrous, high-temperature, low-pressure and reduced conditions.
The affinity between tin mineralization and A-type granite has been recognized in recent years, and some famous tin deposits have been discovered, e.g. tin-polymetallic deposits on the Jos Plateau in Nigeria (Sawkins, Reference Sawkins1984), the Pitinga tin deposit in Brazil (Lenharo et al. Reference Lenharo, Pollard and Born2003) and the Furong super-large tin ore field in Hunan province in China (Jiang et al. Reference Jiang, Zhao, Jiang, Ling and Ni2006). However, some scholars consider that A-type granite is seldomly associated with W–Sn mineralization in the CAOB, except for the eastern Junggar A-type granite (Zhang et al. Reference Zhang, Ran and Li2012). In addition, the most significant tin mineralization in the eastern Junggar is mainly concentrated in the Kamusite pluton and the Beilekuduke pluton (Yang et al. Reference Yang, Mao and Yan2008) in the western Karamaili granite belt. Although the Kamusite rocks form a small pluton in the Karamaili alkali-rich granite belt, the distinctive tin mineralization is a particularly remarkable feature (Fig. 3c).
Previous studies have confirmed the importance of magma redox conditions in determining ore element ratios in magmatic-hydrothermal mineral deposits (Blevin & Chappell, Reference Blevin and Chappell1992; Candela, Reference Candela1992). As shown in Figure 13b, the samples of Kamusite tin mineralized granites are classified in the moderately reduced range (MR), which is characterized by low Fe2O3/FeO ratios (average Fe2O3/FeO = 0.25). This result also reveals the significant differences in the metallogenic specificity between the western plutons and the eastern plutons in the Karamaili belt, such as tin mineralization related to the reduced Beilekuduke and Kamusite granites and gold mineralization related to the oxidized Huangyangshan and Sujiquan granites (Yan et al. Reference Yan, Li and Liu2014).
5.b.3. Strongly evolved Kamusite granites
The above understanding indicates that the Kamusite rocks are consistent with A2-type or postcollisional granites that are highly differentiated more than fractionated felsic granites (FG). The differentiation index (DI) of the Kamusite granites ranges from 95.83 to 97.32 (DI = Qz + Or + Ab + Ne + Lc + Kp), and the solidification index (SI) varies from 0.1 to 1.4 (SI = MgO × 100/(MgO + FeO + Fe2O3 + Na2O + K2O) (wt %), which clearly shows a strong compositional evolution at first.
The inflections of Rb, Ba, K, Ta, P, Ti and others indicate the gain or loss of crystallizing phases (Fig. 8b). The Rb/Sr and K/Rb ratios are useful parameters for detecting fractional crystallization (Blevin, Reference Blevin2004). The K/Rb ratios of the Kamusite granites plot in the strongly evolved (SE) field, with values ranging from 50.9 to 93.8, which are less than 140 (Fig. 13d), likely indicating a highly evolved trend with strong alkali feldspar fractionation.
In conclusion, the significant geochemical features and mineral compositions of the Kamusite granites indicate that these rocks have undergone strong evolution and do not show their magma source directly. The abovementioned facts are as follows: (1) strong depletions in Eu, P, Ba and Sr, along with low Zr contents (<200 ppm) and low K/Rb ratios; and (2) mostly felsic and few alkaline dark minerals, which is obviously different from the Sabei and Huangyangshan granites with many dark inclusions in the east. In this sense, it is rather difficult to trace the magma source simply based on the geochemical characteristics of trace elements or REEs.
5.b.4. Magma source
A-type granites should have more diverse magma sources than I-, S- and M-type granites. Three major petrogenetic hypotheses are summarized as follows: (1) partial melting of meta-igneous or metasedimentary rocks in the deep crust (Whalen et al. Reference Whalen, Currie and Chappell1987; Frost & Frost, Reference Frost and Frost2011); (2) strong crystal differentiation in underplated basaltic magma (Schmitt et al. Reference Schmitt, Emmermann, Trumbull, Bühn and Henjes-Kunst2000; Frost & Frost, Reference Frost and Frost2011); and (3) crustal assimilation of hot mafic magmas and quartzofeldspathic wallrocks (Frost & Frost, Reference Frost and Frost2011).
Although the strong fractional crystallization of mantle-derived magmas may produce limited alkaline-peralkaline metaluminous and ferroan granites with low Sr and Eu values (Frost & Frost, Reference Frost and Frost1997; Patiño Douce, Reference Patiño Douce1997; Wu et al. Reference Wu, Li, Zheng and Gao2007), it is almost impossible to form peraluminous and alkali-calcic granites directly (Wu et al. Reference Wu, Li, Zheng and Gao2007). If the above extreme situation occurs, in general, a larger proportion of contemporaneous mafic magmatic rocks forms in the same area (Litvinovsky et al. Reference Litvinovsky, Jahn, Zanvilevich, Saunders, Poulain and Kuzmin2002; Wu et al. Reference Wu, Li, Zheng and Gao2007). However, for the moment, the exposed scale of the mafic rocks in the eastern Junggar is relatively small (Fig. 1b); thus, the Kamusite granites likely did not directly form by crystal differentiation of mantle materials.
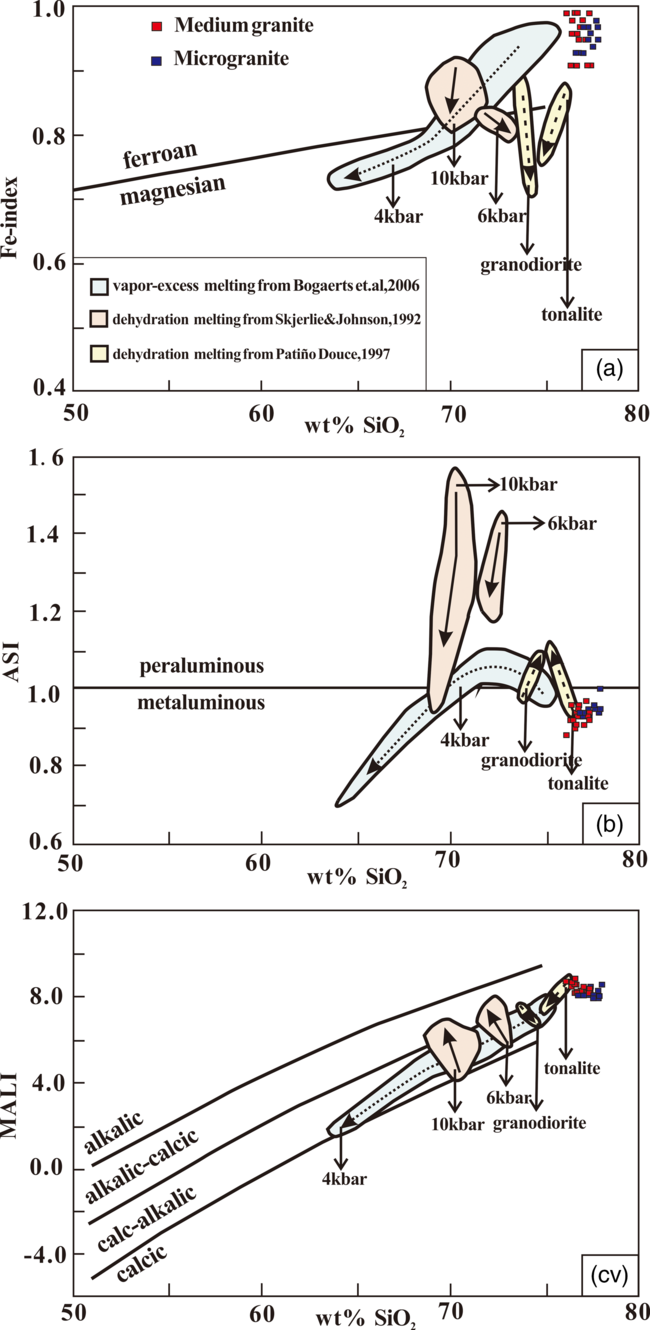
According to results from experimental petrology (Skjerlie & Johnston, Reference Skjerlie and Johnston1992; Patiño Douce, Reference Patiño Douce1997; Bogaerts et al. Reference Bogaerts, Scaillet and Vander Auwera2006), biotite- and amphibole-bearing tonalite or granodiorite and ferroan granodiorite can first form siliceous, iron- and alkali-rich and slightly peraluminous melts having the petrogeochemical characteristics of A-type granites under low-pressure (4 kbar), high-temperature (950 °C) and fluid-absent conditions. As seen from the test results in this paper, the geochemical characteristics of high FeOt/MgO ratios, extremely low CaO values, high high-field-strength element contents and weakly peraluminous and ferroan patterns in the Kamusite rocks are similar to those in the above experimental melts. However, in the diagrams of partial melting experiments on quartzofeldspathic rocks, the Kamusite granites are obviously not close to the first melts produced from tonalite or ferroan granodiorite at ~4 kbar at a depth of ~17.5 km (Fig. 12a–c). Therefore, this difference indicates that the Kamusite granites did not originate directly from quartzofeldspathic wallrocks or meta-igneous rocks.
Compositional trends of melts from partial melting experiments on quartzofeldspathic rocks (Skjerlie & Johnston, Reference Skjerlie and Johnston1992; Patiño Douce, Reference Patiño Douce1997; Bogaerts et al. Reference Bogaerts, Scaillet and Vander Auwera2006). (a) Fe index versus SiO2. (b) ASI (Al/(Ca − 1.67P + Na + K)) versus SiO2. (c) MALI versus SiO2.

(a) Gd/Yb versus zircon saturation temperature plot (Zhu et al. Reference Zhu, Zheng, Xu, Simon and Chen2016). (b) Lg(Fe2O3/FeO) versus FeO* plot (Blevin, Reference Blevin2004). (c) V/Sc versus Sc plot (Lee et al. Reference Lee, Leeman, Canil and Li2005). (d) K/Rb versus SiO2 classification plot (Blevin, Reference Blevin2004). VSO – very strongly oxidized; SO – strongly oxidized; MO – moderately oxidized; MR – moderately reduced; SR – strongly reduced; FeO* = 0.9 × Fe2O3 + FeO; UE – unevolved; ME – moderately evolved; SE – strongly evolved.

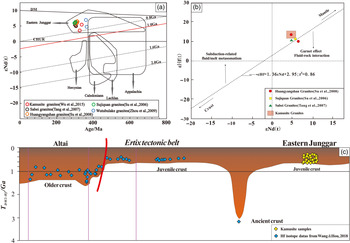
The Nd–Hf isotope compositions are the main constraints on the source of the Kamusite pluton. The samples plot on the terrestrial array in the ϵHf(t) versus ϵNd(t) diagram (Fig. 14b). The factor of subduction-related fluid/melt metasomatism can be excluded. Additionally, relatively low Sr and Sr/Y ratios and high Yb and Y likely indicate the absence of subduction (Yin et al. Reference Yin, Chen, Xiao and Yuan2016). In fact, when the granitoids are produced by the partial melting of a juvenile crust, the Hf isotopes are homogeneous, and the whole-rock ϵNd(t) values are mostly positive (generally >1) (Zhou et al. Reference Zhou, Ma, Wang and Chen2018). The Kamusite granites have positive ϵHf(t) (10.9 to 15.76) and ϵNd(t) (+3.5 to +6.0) (Wu et al. Reference Wu, Liao, Chen, Hu, Tian, Wang and Fan2015). Their significantly positive ϵNd(t) and ϵHf(t) isotope compositions with young Nd and Hf model ages show that the source definitely formed from juvenile crust, distinct from the old basement in the Altai–Junggar orogen (Wang et al. Reference Wang, Tong and Wang2018). According to the ϵHf(t) versus U–Pb age plots, the magmatic source formed from the lower crust and had been relatively recently extracted from the depleted mantle (Fig. 5a). Mantle-derived melts upwelled and underplated to form juvenile crust. Later, the source-depleted Kamusite granites were produced through the partial melting of the juvenile crust and subsequent fractional crystallization.
Hf–Nd isotope system of the A-type granites in the eastern Junggar. (a) ϵNd(t) versus age (Ma) diagram (modified from Wang et al. Reference Wang, Tong and Wang2018). (b) ϵHf(t) versus ϵNd(t) diagram. (c) zircon Hf model age section of the Altai–Junggar granites (modified from Wang et al. Reference Wang, Tong and Wang2018).

5.c. Reworking of the juvenile crust and implied vertical growth
Crustal growth can be divided into horizontal growth and vertical growth (Jahn et al. Reference Jahn, Wu and Hong2000). In general, syncollisional granites with positive ϵNd(t) values reveal horizontal crustal accretion, and postcollisional granites with positive ϵNd(t) values imply vertical crustal accretion (Wang et al. Reference Wang, Tong and Wang2018).
The Karamaili A2-type granites show strong magmatism dominated by young mantle-derived material and are obviously different from the mixed crustal origin of the Altai orogenic belt (Fig. 14c), which is further different from the other types of famous orogenic belts around the world (Fig. 14a). In addition, the ϵNd(t) values of the Karamaili granites are slightly higher than those of the Wutubulake S-type granite (ϵNd(t): 4.7–6.9) of the syncollisional stage (Zhou et al. Reference Zhou, Wu, Dong, Zhang, Dong and Tong2009) in this region, which may indicate that vertical crustal growth occurred in the eastern Junggar (Wang et al. Reference Wang, Tong and Wang2018).
The ϵNd(t)/ϵHf(t) is often used to represent the degree of mixing between a new mantle source and old crustal material (Mole et al. Reference Mole, Fiorentini and Thebaud2014). Figure 14b clearly shows that granites plot above the crustal array and approximate the mantle, which cannot occur during subduction-related fluid/melt metasomatism. It can be inferred from this plot that there should be no remelting products of horizontal accretion (such as residual oceanic crust or young accretionary wedge material) but that the rocks are only related to new underplating from mantle source magma (Wu et al. Reference Wu, Jahn and Lin1997); in other words, vertical accretion of the juvenile crust occurred in the eastern Junggar.
5.d. Staged delamination and postcollisional tectonic setting
The Kamusite granites are not isolated plutons formed from 328 Ma to 321 Ma in the late Carboniferous period. According to previous studies in recent years, a series of high-silica, alkali-rich A-type granites has also been identified in the Karamaili tectonic belt. From west to east, there are the 324.9 Ma Kamusite granite, 310 Ma Laoyaquan granite (Han et al. Reference Han, Tang and Gan2012), 306 Ma Beilekuduke granite (Yang et al. Reference Yang, Li, Si, Wu and Jin2010), 290 Ma Sabei granite (Tang et al. Reference Tang, Qu, Su, Hou and Cong2007), 305 Ma Huangyangshan granite (Su et al. Reference Su, Tang and Cong2008) and 304 Ma Sujiquan granite (Su et al. Reference Su, Tang, Liu, Hou and Liang2006). In general, much A-type granitic magmatism (Fig. 9a–d) occurred mainly from the late Carboniferous to early Permian periods in the eastern Junggar, and the emplacement ages seem to become younger from northwest to southeast. Compared to the others, the Kamusite pluton represents the earliest magmatic event in the Karamaili granite belt.
In addition to the above pattern of ages, through the study of the geochemical characteristics of the granites, it is concluded that the plutons in the Karamaili granite belt have the following spatial distribution patterns.
-
(1) The Kamusite, Laoyaquan and Beilekuduke plutons in the western part of the Karamaili belt were formed at low pressure in the shallow crust, while the Sabei, Huangyangshan and Sujiquan plutons in the eastern part of the belt were formed at relatively high pressure in relatively deep crust, as shown in Figure 13a.
-
(2) The degree of magmatic differentiation in the Karamaili belt tends to decrease from west to east, illustrated by the strongly differentiated Kamusite and Beilekuduke plutons in the west and the moderately differentiated Sabei, Huangyangshan and Sujiquan plutons in the east, as shown in Figure 13c.
-
(3) In the western Karamaili belt, the Kamusite and Beilekuduke plutons are moderately to strongly reduced with tin mineralization, while in the east, the Sabei, Huangyangshan and Sujiquan plutons are very strongly oxidized with gold mineralization, as shown in Figures 11, 13b.
High-temperature melting is caused by thermal relaxation in orogenically thickened crust (Patiño Douce et al. Reference Patiño Douce, Humphreys and Dana Johnston1990), and thinner continental crust is the reason for the low melting pressure (Wu et al. Reference Wu, Li, Zheng and Gao2007; Zhang et al. Reference Zhang, Ran and Li2012; Zhu et al. Reference Zhu, Zheng, Xu, Simon and Chen2016). Pressure reduction and temperature rise are clearly consistent with an extensional tectonic setting, i.e. a rift or postcollisional setting. This process causes magmatic activity, crustal uplift and subsequent crustal extension. Scholars agree that delamination is a very important mechanism for forming the above geological phenomena (Bird et al. Reference Bird1979; Kay & Kay, Reference Kay and Kay1993; Gao et al. Reference Gao, Ducea, Jin and Saleeby1998).
Previous studies have suggested that delamination of the lithosphere is impossible as a whole but may occur in stages (Zhang et al. Reference Zhang, Wang, Li, Jin and Jia2006; Levander et al. Reference Levander, Schmandt, Miller, Liu, Karlstrom, Crow, Lee and Humphreys2011). According to the aforementioned differential characteristics of A2-type granites and diagenetic ages in the Karamaili belt, this result indicates that with the partial melting of juvenile crust, a staged delamination leading to lithospheric thinning probably occurred gradually from west to east over an area of 1100 km2 from the late Carboniferous to early Permian periods. Similarly, the late Palaeozoic postcollisional magmatism in the western Junggar region was mainly concentrated at 340–275 Ma (Han et al. Reference Han, Ji, Song, Chen and Zhang2006). According to previous studies, the late Carboniferous A-type granite located in the Dalabute fault of the western Junggar also showed a trend of gradually younging from southwest to northeast (Fig. 1a; Han et al. Reference Han, Ji, Song, Chen and Zhang2006), which may indicate that the whole Junggar plate has undergone staged delamination.
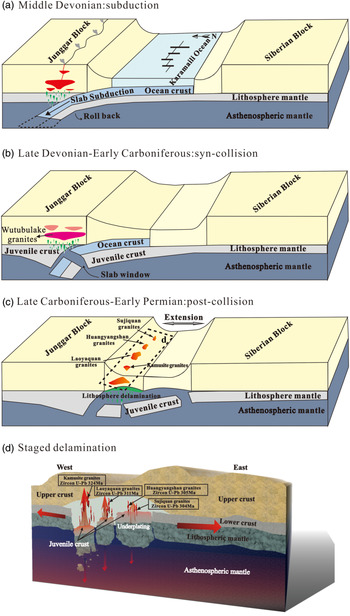
The continuous regional extension of the Karamaili tectonic belt led to the long-term delamination of the thickened juvenile crust after the collision. The delamination did not take place as a whole but occurred in stages. First, delamination began in the weaker lower crust in the west, further inducing partial melting of the juvenile crust to produce high-temperature anhydrous melting in the shallow crust and forming the early Kamusite A2-type granites with high differentiation. Then, with the gradual eastward advance of delamination, the rate of delamination gradually decreased and the magma was emplaced in the deeper crust, forming the late Huangyangshan and Sujiquan A2-type granites with many dark inclusions (Fig. 15d).
Proposed tectonic model for the Kamusite granites and geodynamic evolution in the Karamaili belt.

On the basis of the present geological evidence (Huang et al. Reference Huang, Niu and Wang2012; Zhao et al. Reference Zhao, Xu, Zhang and Yang2012; Wang et al. Reference Wang, Liao, Fan, Cheng, Tian, Chen, Wu and Hu2014), the collisional orogeny in the eastern Junggar began in the Middle Devonian period. Combining this information with the strong A-type granitic magmatism starting from the late Carboniferous period, we firmly believe that the multistage lithospheric delamination of thickened juvenile crust should have occurred in a postcollisional setting. The delamination eventually led to high-temperature magmatism by thermal relaxation and basaltic underplating. In addition, the older 354–329.9 Ma ultrabasic rocks in the Karamaili tectonic belt objectively indicate the occurrence of underplating of basaltic magma.
Moreover, most of the samples in the Karamaili granite belt have geochemical characteristics of A2-type granite (Fig. 9a, d), implying that all of these rocks formed in a postcollisional setting (Eby, Reference Eby1992).
The Karamaili collision belt is an important structural unit in the CAOB. Based on recent results, the Karamaili palaeo-ocean basin was beginning to close from the late Silurian to the Early Devonian periods (Cai et al. Reference Cai, Huang, Liao, Luo and Fan2018), and the Karamaili area was transformed into an active continental margin with oceanic subduction from the late Early Devonian to the early Middle Devonian periods (Zhao et al. Reference Zhao, Liao, Luo, Tian, Zhang, Wang and Liu2018) (Fig. 15a). Then, the occurrence of continental collision during the Late Devonian period is confirmed by the Upper Devonian molasse formations in this region (Cai et al. Reference Cai, Huang, Liao, Luo and Fan2018) (Fig. 15b). At the beginning of the early Carboniferous period, the volcanic strata of bimodal volcanic rocks (Fan et al. Reference Fan, Zhou, Liu, Li, Zheng, Hu and Liang2011) and the overlying fan delta depression sedimentary layers (Cai et al. Reference Cai, Huang, Liao, Luo and Fan2018) indicate a geological progression from a syncollisional to a postcollisional extensional environment. Moreover, the extensional event did not stop; instead, the intensity continued to increase until the late Carboniferous period and even into the Permian period. According to previous studies, postcollisional hypogene magmatic activity occurred mainly in the periods of 330–310 Ma and 305–280 Ma (Han et al. Reference Han, Ji, Song, Chen and Zhang2006). Conclusively, these results indicate that a massive magmatic event occurred in a postcollisional setting by staged delamination between the late Carboniferous and early Permian periods (Fig. 15d).
6. Conclusions
-
(1) The Kamusite pluton intruded into the wallrock during 328–321 Ma after the syncollisional stage from the Middle Devonian to early Carboniferous periods.
-
(2) Although the Kamusite granites experienced strong differentiation, they still display the very typical geochemical characteristics of A-type granites and can be subdivided into A2-type granites.
-
(3) The Kamusite pluton formed in the shallow crust at low pressure and high temperature; these granites are mainly the products of partial melting of juvenile crust, which formed by the underplating of mantle-derived basaltic magmas.
-
(4) The Nd–Hf isotope compositions show that vertical accretion of the juvenile crust occurred in the eastern Junggar.
-
(5) The lithospheric thinning triggered by the staged delamination in the Karamaili tectonic belt proceeded from west to east, and this delamination mode resulted in the diversity of granites from the late Carboniferous to early Permian periods.
Acknowledgements
This work was financially supported by the University Scientific Research Project of Xinjiang Uygur Autonomous Region (Grant: XJEDU2017S010) and the National Key Research and Development Project (Grant: 2018YFC0604003). We thank Prof. Fengmei Chai and Dr Dongmei Qi from Xinjiang University for their fruitful discussions and constructive comments on the improvement of this paper. Special thanks are given to the anonymous reviewers and Editor Dr Kathryn Goodenough for carefully reviewing the manuscript and for their constructive comments and editing suggestions.