

Subjective norms refer to an individual’s perception of social pressure to engage in or avoid a particular behaviour (Ajzen, Reference Ajzen2005). Within the framework of the theory of planned behaviour (TPB), subjective norms, alongside attitudes and perceived behavioural control, are theorised to significantly influence individuals’ intentions to act (Ajzen, Reference Ajzen1991). In education, subjective norms are commonly understood as the perceived expectations of key stakeholders, such as school leaders, colleagues, parents, and students, which may shape teachers’ willingness to adopt particular pedagogical approaches, including inclusive practices (Bielik et al., Reference Bielik, Ďulíková, Rotko and Voronska2022; Zdoupas & Laubenstein, Reference Zdoupas and Laubenstein2023).
However, motivating teachers to actively engage in inclusive practices remains a persistent challenge. Although some research indeed suggests that subjective norms should predict intention (e.g., Chen et al., Reference Chen, Wang, Shan, Zhan and Chen2024; Liu et al., Reference Liu, Huang, Liu and Zhang2025), other empirical studies have shown limited predictive power (e.g., Opoku et al., Reference Opoku, Cuskelly, Pedersen and Rayner2021; Wang, Reference Wang2023), raising questions about how these norms are conceptualised and measured. One key limitation lies in the traditional treatment of subjective norms as a unitary construct, focused primarily on normative beliefs (NB) — teachers’ perceptions of what important others approve of or expect. Previous studies have indicated that although NB represents the social burden to conform to group expectations (Akhtar et al., Reference Akhtar, Hameed, Islam, Pant, Sharma, Rather and Kuzior2024), these beliefs are effective only when the pressure comes from those whom individuals are motivated to comply with (Wu et al., Reference Wu, Yang, Hu, Li, Liu, Wang and Huang2022). Other studies have overlooked the influence of descriptive norms, or the actual behaviours observed in referent groups (Manning, Reference Manning2009). Social influence theory suggests that people may be more motivated to act when they witness those around them modelling desired behaviours, rather than merely endorsing them verbally (Cialdini et al., Reference Cialdini, Reno and Kallgren1990). Thus, separating subjective norms into two dimensions — NB and motivation to comply (MC; Ham et al., Reference Ham, Jeger and Ivković2015) — may offer a more accurate and culturally responsive understanding of how social influence shapes teacher behaviour. To be specific, NB, or perceived social pressure, reflects how individuals perceive the opinions of important groups or people in their lives regarding their actions — whether they approve or disapprove (Ajzen & Fishbein, Reference Ajzen and Fishbein1972). MC, in contrast, encompasses the sense of obligation or expectation individuals feel to align their behaviour with the observed or inferred actions of others within their reference groups (Ajzen & Fishbein, Reference Ajzen and Fishbein1972; Manning, Reference Manning2009). These behavioural cues may carry even greater weight in collectivist cultural contexts, such as China, due to the importance of group harmony and compliance (Sing et al., Reference Sing, Teo, Huang, Chiu and Wang2022).
Inclusive Education in China
China’s distinctive approach to inclusive education, known as ‘Learning in Regular Classrooms’ (LRC), has been implemented since the 1980s (Deng, Reference Deng2008). Unlike the broader international concept of inclusion, LRC applies exclusively to students with specific types of special educational needs — those with intellectual disability, autism, visual or hearing impairments, and physical disability (Ouhai District Special Education Guidance Center, Wenzhou [OSEGC], 2024). According to the Notice on the Identification of Non-Certified Students Receiving Inclusive Education in Ouhai District, Wenzhou in 2024 issued by the OSEGC, eligibility for placement in regular classrooms is primarily evaluated based on students’ learning abilities. This selective emphasis within LRC may not be arbitrary but rather aligned with prevailing normative social and educational beliefs about the relative compatibility of different disability categories with mainstream classrooms, echoing some Chinese teachers’ utilitarian views of inclusion and their belief that ‘categories of disabilities should be clearly distinguished and only the “suitable” ones should attend mainstream schools’ (Qu, Reference Qu2022, p. 30).
In recent years, inclusive education has become a national priority in China, supported by a series of policies and teacher development initiatives aimed at enhancing both equity and quality in education (Xi, Reference Xi2022). One prominent example is the 14th Five-Year Action Plan for the Improvement of Special Education Development (Ministry of Education of the People’s Republic of China et al., 2021), which frames LRC as a comprehensive reform rather than a mere placement policy, mandating not only equitable access through inclusive enrolment and targeted funding but also improvements in instructional quality via curriculum reform, teacher training, cross-sector collaboration, and technology integration. These policy requirements make clear that LRC in China entails pedagogical support, differentiated instruction, and equity in learning opportunities, rather than the physical integration of students alone. This policy intent is consistent with international research indicating that placement in mainstream classrooms, while necessary, is insufficient to ensure meaningful inclusion (Ainscow et al., Reference Ainscow, Booth and Dyson2006) and that positive learning outcomes for all students emerge when placement is accompanied by inclusive pedagogy (Lin et al., Reference Lin, Mullick and Campbell2026). It should be noted, however, that despite these policy expectations, teachers’ subjective norm perceptions may still be shaped by prevailing implementation practices, which tend to prioritise placement-related compliance over instructional adaptation. Consequently, a persistent policy–practice gap remains, resulting in fragmented and largely superficial implementation of inclusive education in China, with insufficient teacher preparation and an overemphasis on procedural compliance and behavioural regulation at the expense of substantive pedagogical competence (Mullick et al., Reference Mullick, Tang and Lin2026).
To address this gap, in the present study we examine subjective norms for inclusive education (SNIE) among elementary school teachers in a second-tier city on China’s southeast coast. Specifically, we investigate how teachers perceive social expectations and observable behaviours from key referents, including family, friends, leaders, colleagues, students, parents, and educational specialists, and how these perceptions shape their intention to implement inclusive practices in regular classrooms. By introducing and validating a two-dimensional SNIE scale, this study aims to provide both theoretical clarity and practical insights for designing professional development and policy strategies that more effectively support inclusive education. Specifically, this study is guided by the following research questions:
-
1. What are teachers’ perceptions of subjective norm beliefs and behavioural intentions regarding inclusive practices?
-
2. To what extent do NB and MC explain the variance in teachers’ behavioural intentions to implement inclusive practices?
SNIE: Teachers’ Perceptions of Social Expectations for Inclusive Education
According to Ajzen (Reference Ajzen1991), teachers’ perceived SNIE — that is, their perceptions of whether significant individuals endorse the adoption of inclusive practices in mainstream schools — are expected to significantly predict their behavioural intentions for inclusive practices (BIIP), namely, their intention to employ inclusive teaching pedagogy in classroom instruction (Sharma et al., Reference Sharma, Sokal, Wang and Loreman2021).
Interestingly, studies have produced mixed findings on the predictive power of SNIE for BIIP, with some reporting no significant effects. For example, Opoku et al. (Reference Opoku, Cuskelly, Pedersen and Rayner2021) found no significant association between SNIE and BIIP, whereas Opoku’s (Reference Opoku2022) subsequent study reported the opposite pattern one year later. Such inconsistency may stem from inadequately standardised evaluation frameworks for subjective norms (Wang, Reference Wang2023) and the limited applicability of existing tools (Opoku, Reference Opoku2022; Opoku et al., Reference Opoku, Cuskelly, Pedersen and Rayner2021). In addition, contextual variation appears to play a critical role, as Wang (Reference Wang2023) demonstrated that the impact of SNIE on BIIP is substantially stronger in Hong Kong than in Xinjiang. Moreover, many prior investigations operationalised subjective norms solely through attitudinal perceptions and expectations (Mentel et al., Reference Mentel, Förster, Forthmann and Souvignier2024), neglecting their behavioural enactment and thus underestimating the full scope of social influence. Furthermore, given divergent findings on the relative influence of different social referents (Urton et al., Reference Urton, Wilbert, Krull and Hennemann2023), it remains unclear which individuals’ subjective norms most strongly shape teachers’ BIIP. To address these shortcomings, this study introduces a dual-channel measurement model — the SNIE scale, which differentiates NB and MC — that captures both discursive norms and embodied practices and examines the distinct impacts of significant referents on BIIP among elementary school teachers in a second-tier city on China’s southeast coast.
Methodology
Participants and Procedures
This study focused on elementary school teachers because LRC was first implemented within compulsory education, where inclusive practices exert early and enduring effects and teachers’ roles are central to implementation (Ying, Reference Ying2025). A stratified multi-stage cluster sampling method was employed to enhance the representativeness of the sample of elementary school teachers from a second-tier city on China’s southeast coast. Specifically, the city’s 12 administrative divisions were treated as geographic strata and further grouped into urban, suburban, and rural categories based on their geographic and educational characteristics, and elementary schools within each division constituted the primary sampling clusters. In collaboration with local education bureaus and school leaders, elementary schools within each stratum were randomly selected, and structured online questionnaires were distributed across the selected elementary schools in all 12 divisions of the city. Teachers voluntarily accessed the survey via a QR code after reviewing an explanatory statement that outlined the study’s rationale and objectives, informed them of their right to withdraw, and clarified that the study did not assess teaching performance. Digital informed consent was obtained via an ‘I Agree’ button on the survey cover page, and no incentives were provided. Strict confidentiality measures were implemented to protect personal information, and all findings were reported anonymously. Ethics approval was granted by the Wenzhou-Kean University Ethics Committee.
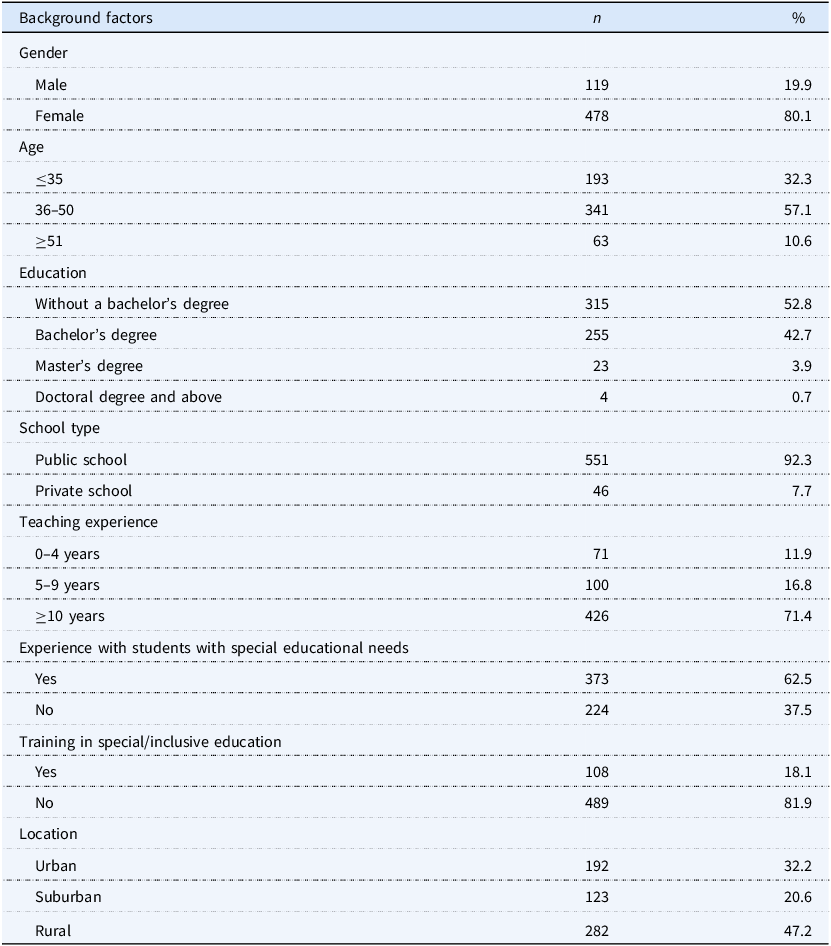
The final dataset comprised 597 valid responses. The sample was predominantly female (80.1%) and highly experienced, with more than two thirds of participants reporting at least 10 years of teaching experience. A substantial proportion of participants reported practical experience working with students with special educational needs (62.5%) despite limited formal training in special or inclusive education (18.1%). Detailed demographic characteristics are presented in Table 1.
Demographic Characteristics of the Participants (N = 597)

Table 1. Long description
The table presents demographic characteristics of 597 participants. It has 10 rows and 3 columns. The columns are labeled Background factors, n, and %. The rows are grouped under various categories: Gender, Age, Education, School type, Teaching experience, Experience with students with special educational needs, Training in special/inclusive education, and Location. Row 1: Gender, Male, 119, 19.9. Row 2: Gender, Female, 478, 80.1. Row 3: Age, <=35, 193, 32.3. Row 4: Age, 36-50, 341, 57.1. Row 5: Age, >=51, 63, 10.6. Row 6: Education, Without a bachelor's degree, 315, 52.8. Row 7: Education, Bachelor's degree, 255, 42.7. Row 8: Education, Master's degree, 23, 3.9. Row 9: Education, Doctoral degree and above, 4, 0.7. Row 10: School type, Public school, 551, 92.3. Row 11: School type, Private school, 46, 7.7. Row 12: Teaching experience, 0-4 years, 71, 11.9. Row 13: Teaching experience, 5-9 years, 100, 16.8. Row 14: Teaching experience, >=10 years, 426, 71.4. Row 15: Experience with students with special educational needs, Yes, 373, 62.5. Row 16: Experience with students with special educational needs, No, 224, 37.5. Row 17: Training in special/inclusive education, Yes, 108, 18.1. Row 18: Training in special/inclusive education, No, 489, 81.9. Row 19: Location, Urban, 192, 32.2. Row 20: Location, Suburban, 123, 20.6. Row 21: Location, Rural, 282, 47.2.
Instruments
Two scales were adopted to collect self-reported data from the participants: the SNIE scale, designed for this study to measure the social pressure perceived by the teachers, and the Inclusive Practices Scale (IPS), developed by Sharma et al. in Reference Sharma, Sokal, Wang and Loreman2021, which assesses teachers’ intentions to use inclusive practices.
The SNIE scale
The SNIE scale was developed based on Ajzen’s (Reference Ajzen2005) TPB and follows DeVellis’s (Reference DeVellis2012) guidelines for scale construction. It captures two core components of subjective norms: NB and MC (Ham et al., Reference Ham, Jeger and Ivković2015). Item development was informed by a review of peer-reviewed literature on subjective norms within the TPB framework and inclusive education, conducted using the Web of Science and China National Knowledge Infrastructure databases. Existing instruments were examined to identify commonly assessed referent groups and item formats (e.g., Bielik et al., Reference Bielik, Ďulíková, Rotko and Voronska2022; Lee et al., Reference Lee, Chen, Tsui and Chiang2023; Rad et al., Reference Rad, Redeș, Roman, Egerău, Lile, Demeter, Dughi, Ignat, Balaș, Maier, Kiss, Mărineanu, Bocoș, Bâtcă-Dumitru, Cuc, Vancu, Rad and Chiș2023); however, items were not directly adopted, as prior measures did not comprehensively address the range of referents or overlooked the influence of the actual behaviours observed in referent groups. Accordingly, all items were newly developed to reflect the inclusive education context and the target population.
Consistent with Ajzen’s conceptualisation, the items assess teachers’ beliefs regarding whether significant referents approve of their inclusive education practices and whether these referents themselves engage in inclusion-related activities (Ajzen, Reference Ajzen2005). Drawing on prior empirical studies, significant referents included family members, colleagues (e.g., school leaders and peers), and specialists in inclusive or special education (Jeet, Reference Jeet2023; Lee et al., Reference Lee, Chen, Tsui and Chiang2023); given the study context, students and their parents were also considered salient referents (Wu et al., Reference Wu, Yang, Hu, Li, Liu, Wang and Huang2022). The initial item pool was further refined through expert panel review. The final SNIE scale consists of 16 items, with eight items each for NB and MC. All items were rated on a 5-point Likert scale (1 = strongly disagree, 2 = moderately disagree, 3 = neutral, 4 = moderately agree, and 5 = strongly agree). Total scores range from 16 to 80, with higher scores indicating stronger supportive subjective norms for inclusive practices and greater motivation to comply with significant referents.
The IPS
The IPS enables educators to self-assess their likelihood of employing specific teaching practices. Comprising 26 items across three dimensions — personalised instructional strategies (PIS), communicative scaffolding strategies (CSS), and collaboration and assessment strategies (CAS) — respondents provide ratings on a 5-point scale where 4 = expert, 3 = proficient, 2 = developing, 1 = novice, and 0 = not applicable. Each statement begins with the stem phrase ‘In my classroom, I will (do) …’, followed by a statement detailing a specific instructional practice, such as ‘use strategies to motivate learners’. The scale yields a total score ranging from 0 to 104. Elevated scores on this scale signify a greater intent to employ inclusive teaching practices.
Validity and reliability
To ensure the scales’ suitability for participants in mainland China, the SNIE scale was initially developed in Simplified Chinese, while the IPS underwent culturally adaptive translation (Shehadeh, Reference Shehadeh, Coombe, Anderson and Stephenson2020) through back-translation procedures (Brislin, Reference Brislin1970). Both scales were reviewed by an expert panel for face and content validation. Pilot study results indicated that both scales demonstrated high reliability (Cronbach’s alpha = .92 and .96, respectively), supporting their suitability for subsequent research.
Data Analysis
Descriptive statistics were employed to summarise the characteristics of the data, addressing Research Question 1 and providing insights into the central tendencies and variations within the dataset. This includes calculating means, standard deviations, and frequency distributions for key variables. Additionally, an exploratory factor analysis was performed to identify the factor structure of the SNIE scale. Subsequently, to address Research Question 2, multiple regression analysis was conducted to examine the influence of SNIE — comprising NB and MC — on teachers’ BIIP. This method allows for the assessment of the predictive power of SNIE components on teachers’ intentions to implement inclusive practices. The regression model was evaluated for statistical significance, and the coefficients provided insights into the strength and direction of the relationships between the variables.
Results
The results of the normality test indicate that the data were close to a normal distribution (skewness ranging from −.867 to .016; kurtosis ranging from .294 to 1.457), proving that the data can be analysed using parametric tests. The Kaiser–Meyer–Olkin (KMO) value of the model, including SNIE and IPS, indicated excellent sampling adequacy. Bartlett’s test of sphericity was significant, suggesting that the correlations among the variables were sufficiently strong for further analysis. Moreover, an exploratory factor analysis was conducted for the development of the SNIE scale, resulting in the decision to retain two components. The KMO and Bartlett’s tests for both the whole model and SNIE separately are displayed in Table 2.
Kaiser–Meyer–Olkin (KMO) and Bartlett’s Tests

Table 2. Long description
A table comparing KMO and Bartlett's test results for SNIE and IPS, and SNIE separately. The table has 3 rows and 4 columns. The columns are labeled SNIE and IPS, SNIE, and empty. The row labels are KMO measure of sampling adequacy, Bartlett's test of sphericity Approx. chi-square, df, and Sig. Row 1: SNIE and IPS, 965; SNIE, 924. Row 2: SNIE and IPS, 22780.714; SNIE, 6198.744. Row 3: SNIE and IPS, 861; SNIE, 120. Row 4: SNIE and IPS, <.001; SNIE, <.001.
Note. SNIE = Subjective Norms for Inclusive Education scale; IPS = Inclusive Practices Scale.
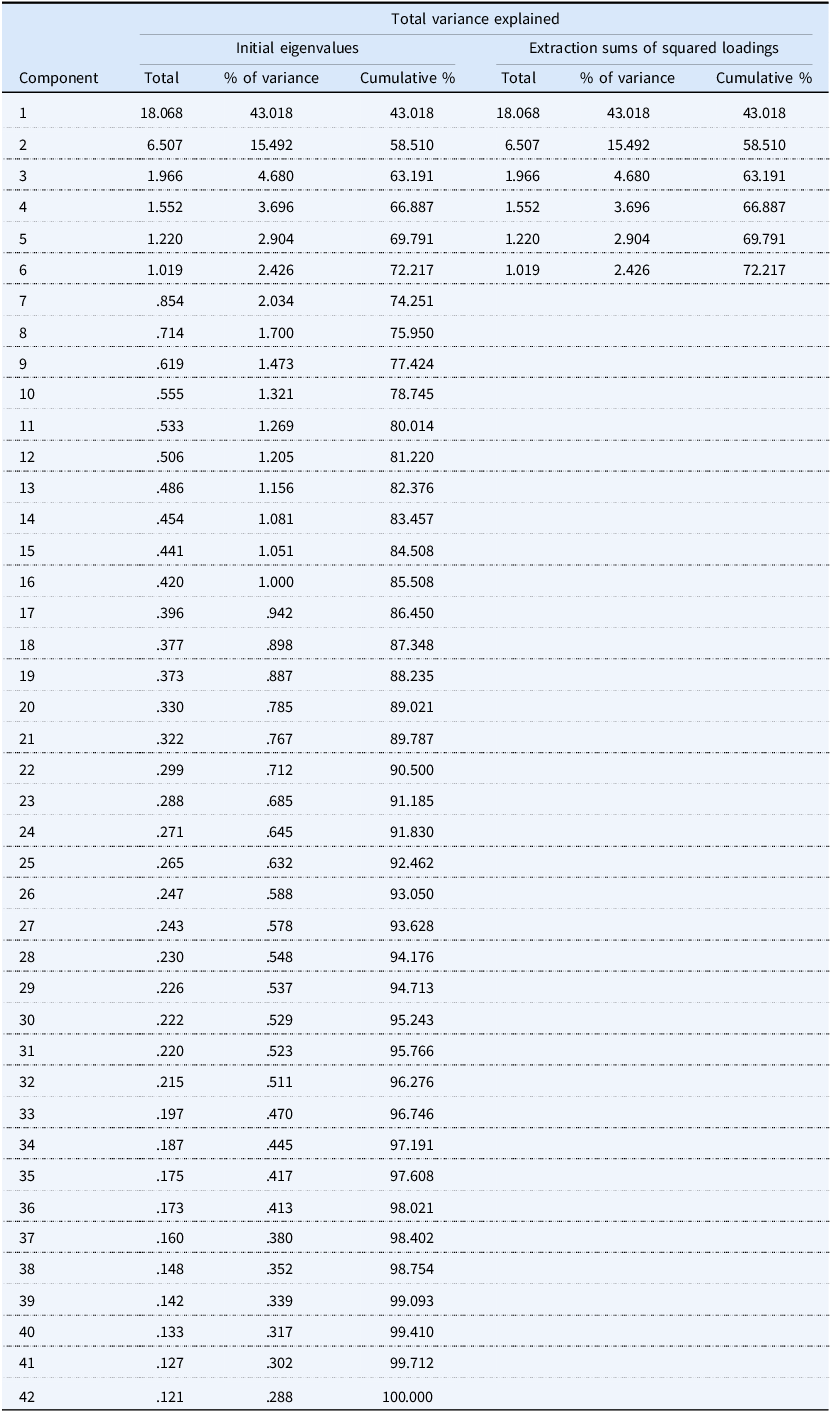
Harman’s single-factor test was used to perform a principal components factor analysis on all variable items from both the SNIE scale and IPS without rotation, setting the eigenvalue greater than 1 (Zhou & Long, Reference Zhou and Long2004). As shown in Table 3, there is a potential influence of common method bias on the results.
Principal Components Analysis for Harman’s Single-Factor Test (SNIE and IPS)

Table 3. Long description
A table titled 'Total variance explained' presents the results of a principal components analysis. The table has 42 rows and 6 columns. The columns are labeled 'Component', 'Total', '% of variance', 'Cumulative %', 'Extraction sums of squared loadings', '% of variance', and 'Cumulative %'. The 'Component' column lists numbers from 1 to 42. The 'Total' column lists eigenvalues for each component. The '% of variance' column shows the percentage of variance explained by each component. The 'Cumulative %' column shows the cumulative percentage of variance explained by the components. The 'Extraction sums of squared loadings' column lists the eigenvalues after extraction. The '% of variance' column under this heading shows the percentage of variance explained by each component after extraction. The 'Cumulative %' column under this heading shows the cumulative percentage of variance explained by the components after extraction. The table provides detailed data on the variance explained by each component in the analysis.
Note. SNIE = Subjective Norms for Inclusive Education scale; IPS = Inclusive Practices Scale.
EFA for the SNIE Scale
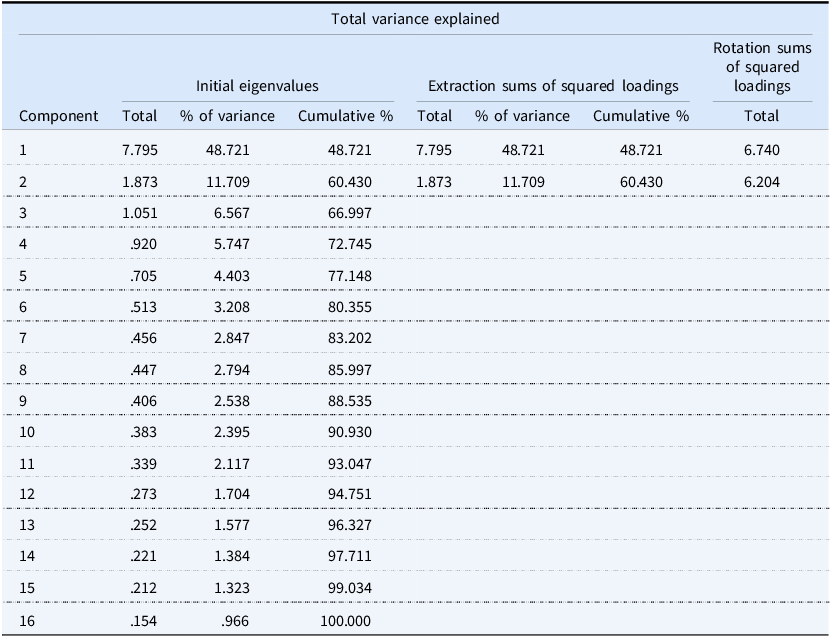
Although principal components analysis revealed three factors with eigenvalues greater than 1, both the scree plot and Monte Carlo PCA for parallel analysis supported a two-component solution, also with a high degree of total explained variance. The contributions of the two factors, MC and NB, are displayed in Table 4.
Principal Components Analysis for SNIE Scale Development

Table 4. Long description
A table titled Total variance explained. The table has 16 rows and 9 columns. The columns are labeled as Component, Initial eigenvalues Total, Initial eigenvalues % of variance, Initial eigenvalues Cumulative %, Extraction sums of squared loadings Total, Extraction sums of squared loadings % of variance, Extraction sums of squared loadings Cumulative %, and Rotation sums of squared loadings Total. The rows are labeled with Component numbers from 1 to 16. The values in the columns are as follows: Row 1: Component 1, Initial eigenvalues Total 7.795, Initial eigenvalues % of variance 48.721, Initial eigenvalues Cumulative % 48.721, Extraction sums of squared loadings Total 7.795, Extraction sums of squared loadings % of variance 48.721, Extraction sums of squared loadings Cumulative % 48.721, Rotation sums of squared loadings Total 6.740. Row 2: Component 2, Initial eigenvalues Total 1.873, Initial eigenvalues % of variance 11.709, Initial eigenvalues Cumulative % 60.430, Extraction sums of squared loadings Total 1.873, Extraction sums of squared loadings % of variance 11.709, Extraction sums of squared loadings Cumulative % 60.430, Rotation sums of squared loadings Total 6.204. Row 3: Component 3, Initial eigenvalues Total 1.051, Initial eigenvalues % of variance 6.567, Initial eigenvalues Cumulative % 66.997, Extraction sums of squared loadings Total 1.051, Extraction sums of squared loadings % of variance 6.567, Extraction sums of squared loadings Cumulative % 66.997. Row 4: Component 4, Initial eigenvalues Total 0.920, Initial eigenvalues % of variance 5.747, Initial eigenvalues Cumulative % 72.745, Extraction sums of squared loadings Total 0.920, Extraction sums of squared loadings % of variance 5.747, Extraction sums of squared loadings Cumulative % 72.745. Row 5: Component 5, Initial eigenvalues Total 0.705, Initial eigenvalues % of variance 4.403, Initial eigenvalues Cumulative % 77.148, Extraction sums of squared loadings Total 0.705, Extraction sums of squared loadings % of variance 4.403, Extraction sums of squared loadings Cumulative % 77.148. Row 6: Component 6, Initial eigenvalues Total 0.513, Initial eigenvalues % of variance 3.208, Initial eigenvalues Cumulative % 80.355, Extraction sums of squared loadings Total 0.513, Extraction sums of squared loadings % of variance 3.208, Extraction sums of squared loadings Cumulative % 80.355. Row 7: Component 7, Initial eigenvalues Total 0.456, Initial eigenvalues % of variance 2.847, Initial eigenvalues Cumulative % 83.202, Extraction sums of squared loadings Total 0.456, Extraction sums of squared loadings % of variance 2.847, Extraction sums of squared loadings Cumulative % 83.202. Row 8: Component 8, Initial eigenvalues Total 0.447, Initial eigenvalues % of variance 2.794, Initial eigenvalues Cumulative % 85.997, Extraction sums of squared loadings Total 0.447, Extraction sums of squared loadings % of variance 2.794, Extraction sums of squared loadings Cumulative % 85.997. Row 9: Component 9, Initial eigenvalues Total 0.406, Initial eigenvalues % of variance 2.538, Initial eigenvalues Cumulative % 88.535, Extraction sums of squared loadings Total 0.406, Extraction sums of squared loadings % of variance 2.538, Extraction sums of squared loadings Cumulative % 88.535. Row 10: Component 10, Initial eigenvalues Total 0.383, Initial eigenvalues % of variance 2.395, Initial eigenvalues Cumulative % 90.930, Extraction sums of squared loadings Total 0.383, Extraction sums of squared loadings % of variance 2.395, Extraction sums of squared loadings Cumulative % 90.930. Row 11: Component 11, Initial eigenvalues Total 0.339, Initial eigenvalues % of variance 2.117, Initial eigenvalues Cumulative % 93.047, Extraction sums of squared loadings Total 0.339, Extraction sums of squared loadings % of variance 2.117, Extraction sums of squared loadings Cumulative % 93.047. Row 12: Component 12, Initial eigenvalues Total 0.273, Initial eigenvalues % of variance 1.704, Initial eigenvalues Cumulative % 94.751, Extraction sums of squared loadings Total 0.273, Extraction sums of squared loadings % of variance 1.704, Extraction sums of squared loadings Cumulative % 94.751. Row 13: Component 13, Initial eigenvalues Total 0.252, Initial eigenvalues % of variance 1.577, Initial eigenvalues Cumulative % 96.327, Extraction sums of squared loadings Total 0.252, Extraction sums of squared loadings % of variance 1.577, Extraction sums of squared loadings Cumulative % 96.327. Row 14: Component 14, Initial eigenvalues Total 0.221, Initial eigenvalues % of variance 1.384, Initial eigenvalues Cumulative % 97.711, Extraction sums of squared loadings Total 0.221, Extraction sums of squared loadings % of variance 1.384, Extraction sums of squared loadings Cumulative % 97.711. Row 15: Component 15, Initial eigenvalues Total 0.212, Initial eigenvalues % of variance 1.323, Initial eigenvalues Cumulative % 99.034, Extraction sums of squared loadings Total 0.212, Extraction sums of squared loadings % of variance 1.323, Extraction sums of squared loadings Cumulative % 99.034. Row 16: Component 16, Initial eigenvalues Total 0.154, Initial eigenvalues % of variance 0.966, Initial eigenvalues Cumulative % 100.000, Extraction sums of squared loadings Total 0.154, Extraction sums of squared loadings % of variance 0.966, Extraction sums of squared loadings Cumulative % 100.000.
Note. SNIE = Subjective Norms for Inclusive Education scale.
Teachers’ BIIP
The results indicated that the three dimensions of the IPS scale exhibited strong internal consistency (α IPS = .98, α PIS = .94, α CSS = .97, α CAS = .94). The normality test results showed that the data were approximately normally distributed (skewness ranging from −.87 to .12; kurtosis ranging from −.45 to 1.46), validating the use of parametric tests for analysis. Additionally, Cohen et al. (Reference Cohen, Manion and Morrison2018) define correlation coefficients as small (r = .10 to .29), medium (r = .30 to .49), and large (r = .50 to 1.00). Pearson’s correlation coefficient results indicated that PIS, CSS, and CAS were significantly and strongly correlated (r ranging from .78 to .87, n = 597, p < .001).
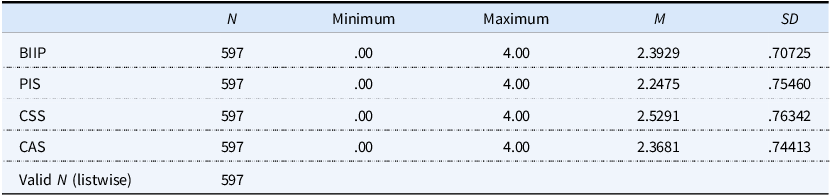
The results displayed in Table 5 provide a comprehensive overview of the IPS scores for all 597 valid participants, specifically the average scores for PIS, CSS, and CAS. All means are slightly above the scale midpoint, indicating that teachers’ intentions to adopt inclusive teaching practices are at a moderate to slightly high level (above ‘developing’ but below ‘proficient’). Among them, proficiency in CSS is relatively high, followed by that in CAS, while proficiency in implementing PIS is the lowest.
Descriptive Statistics for BIIP and IPS Subscales

Table 5. Long description
A table with descriptive statistics for BIIP and IPS subscales. The table has 6 rows and 6 columns. The columns are labeled N, Minimum, Maximum, M, and SD. The rows are labeled BIIP, PIS, CSS, CAS, and Valid N (listwise). Each row provides statistical data for different subscales. Row 1: BIIP, 597, 0.00, 4.00, 2.3929, 0.70725. Row 2: PIS, 597, 0.00, 4.00, 2.2475, 0.75460. Row 3: CSS, 597, 0.00, 4.00, 2.5291, 0.76342. Row 4: CAS, 597, 0.00, 4.00, 2.3681, 0.74413. Row 5: Valid N (listwise), 597.
Note. BIIP = behavioural intentions for inclusive practices; PIS = personalised instructional strategies; CSS = communicative scaffolding strategies; CAS = collaboration and assessment strategies.
Teachers’ Perceptions of Subjective Norms
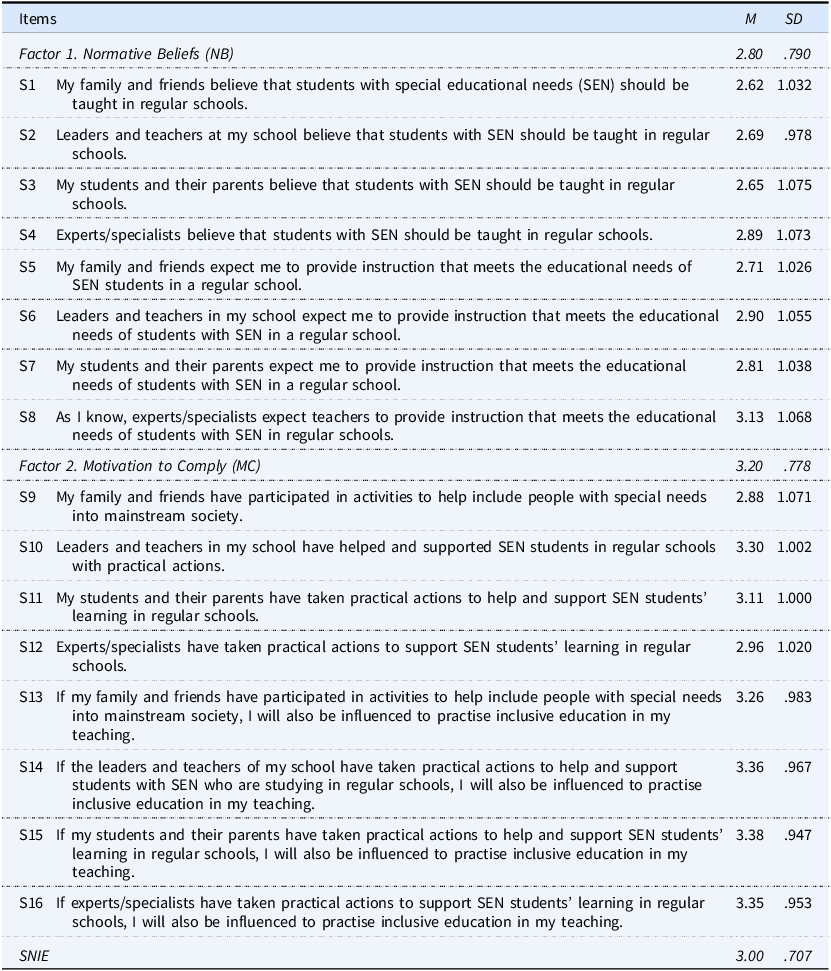
In Table 6, descriptive statistics reveal that mean item scores on the SNIE scale ranged from 1.00 to 5.00. The means for the two dimensions, NB and MC, indicate that elementary teachers in regular schools of this second-tier city on China’s southeast coast perceived a slightly above moderate level of SNIE. Item-wise analysis further reveals that family and friends exerted the least influence on teachers’ intentions to implement inclusive education, whereas the actions of leaders, peer teachers, students, and their parents carried the greatest weight. The results demonstrated good internal consistency (α = .93), an approximately normal distribution of the data (skewness ranging from −.11 to .12; kurtosis ranging from .01 to .29), and a significant and large correlation between NB and MC (r = .63, n = 597, p < .001).
Item-Wise Teacher Perceptions on SNIE

Table 6. Long description
A table titled 'Item-Wise Teacher Perceptions on SNIE' presents descriptive statistics for teacher perceptions on the inclusion of students with special educational needs (SEN) in regular schools. The table has 16 rows and 3 columns, with column headers 'Items', 'M', and 'SD'. The 'Items' column lists statements related to normative beliefs (NB) and motivation to comply (MC). The 'M' column shows the mean scores, and the 'SD' column shows the standard deviation for each item. The table is divided into two factors: Normative Beliefs (NB) and Motivation to Comply (MC). Each row provides specific statements and their corresponding mean and standard deviation values. For example, the first row under NB states, 'My family and friends believe that students with SEN should be taught in regular schools,' with a mean of 2.62 and a standard deviation of 1.032. The table captures the perceptions of elementary teachers in regular schools of a second-tier city on China's southeast coast, indicating a slightly above moderate level of SNIE. The data demonstrates good internal consistency and a significant correlation between NB and MC.
Note. SNIE = Subjective Norms for Inclusive Education scale.
The Effect of SNIE (NB and MC) on BIIP
The Pearson correlation coefficient indicated a moderate positive relationship between SNIE and BIIP (r = .32, p < .001). This suggests that higher perceptions of subjective norms are associated with a greater intention to implement inclusive practices.
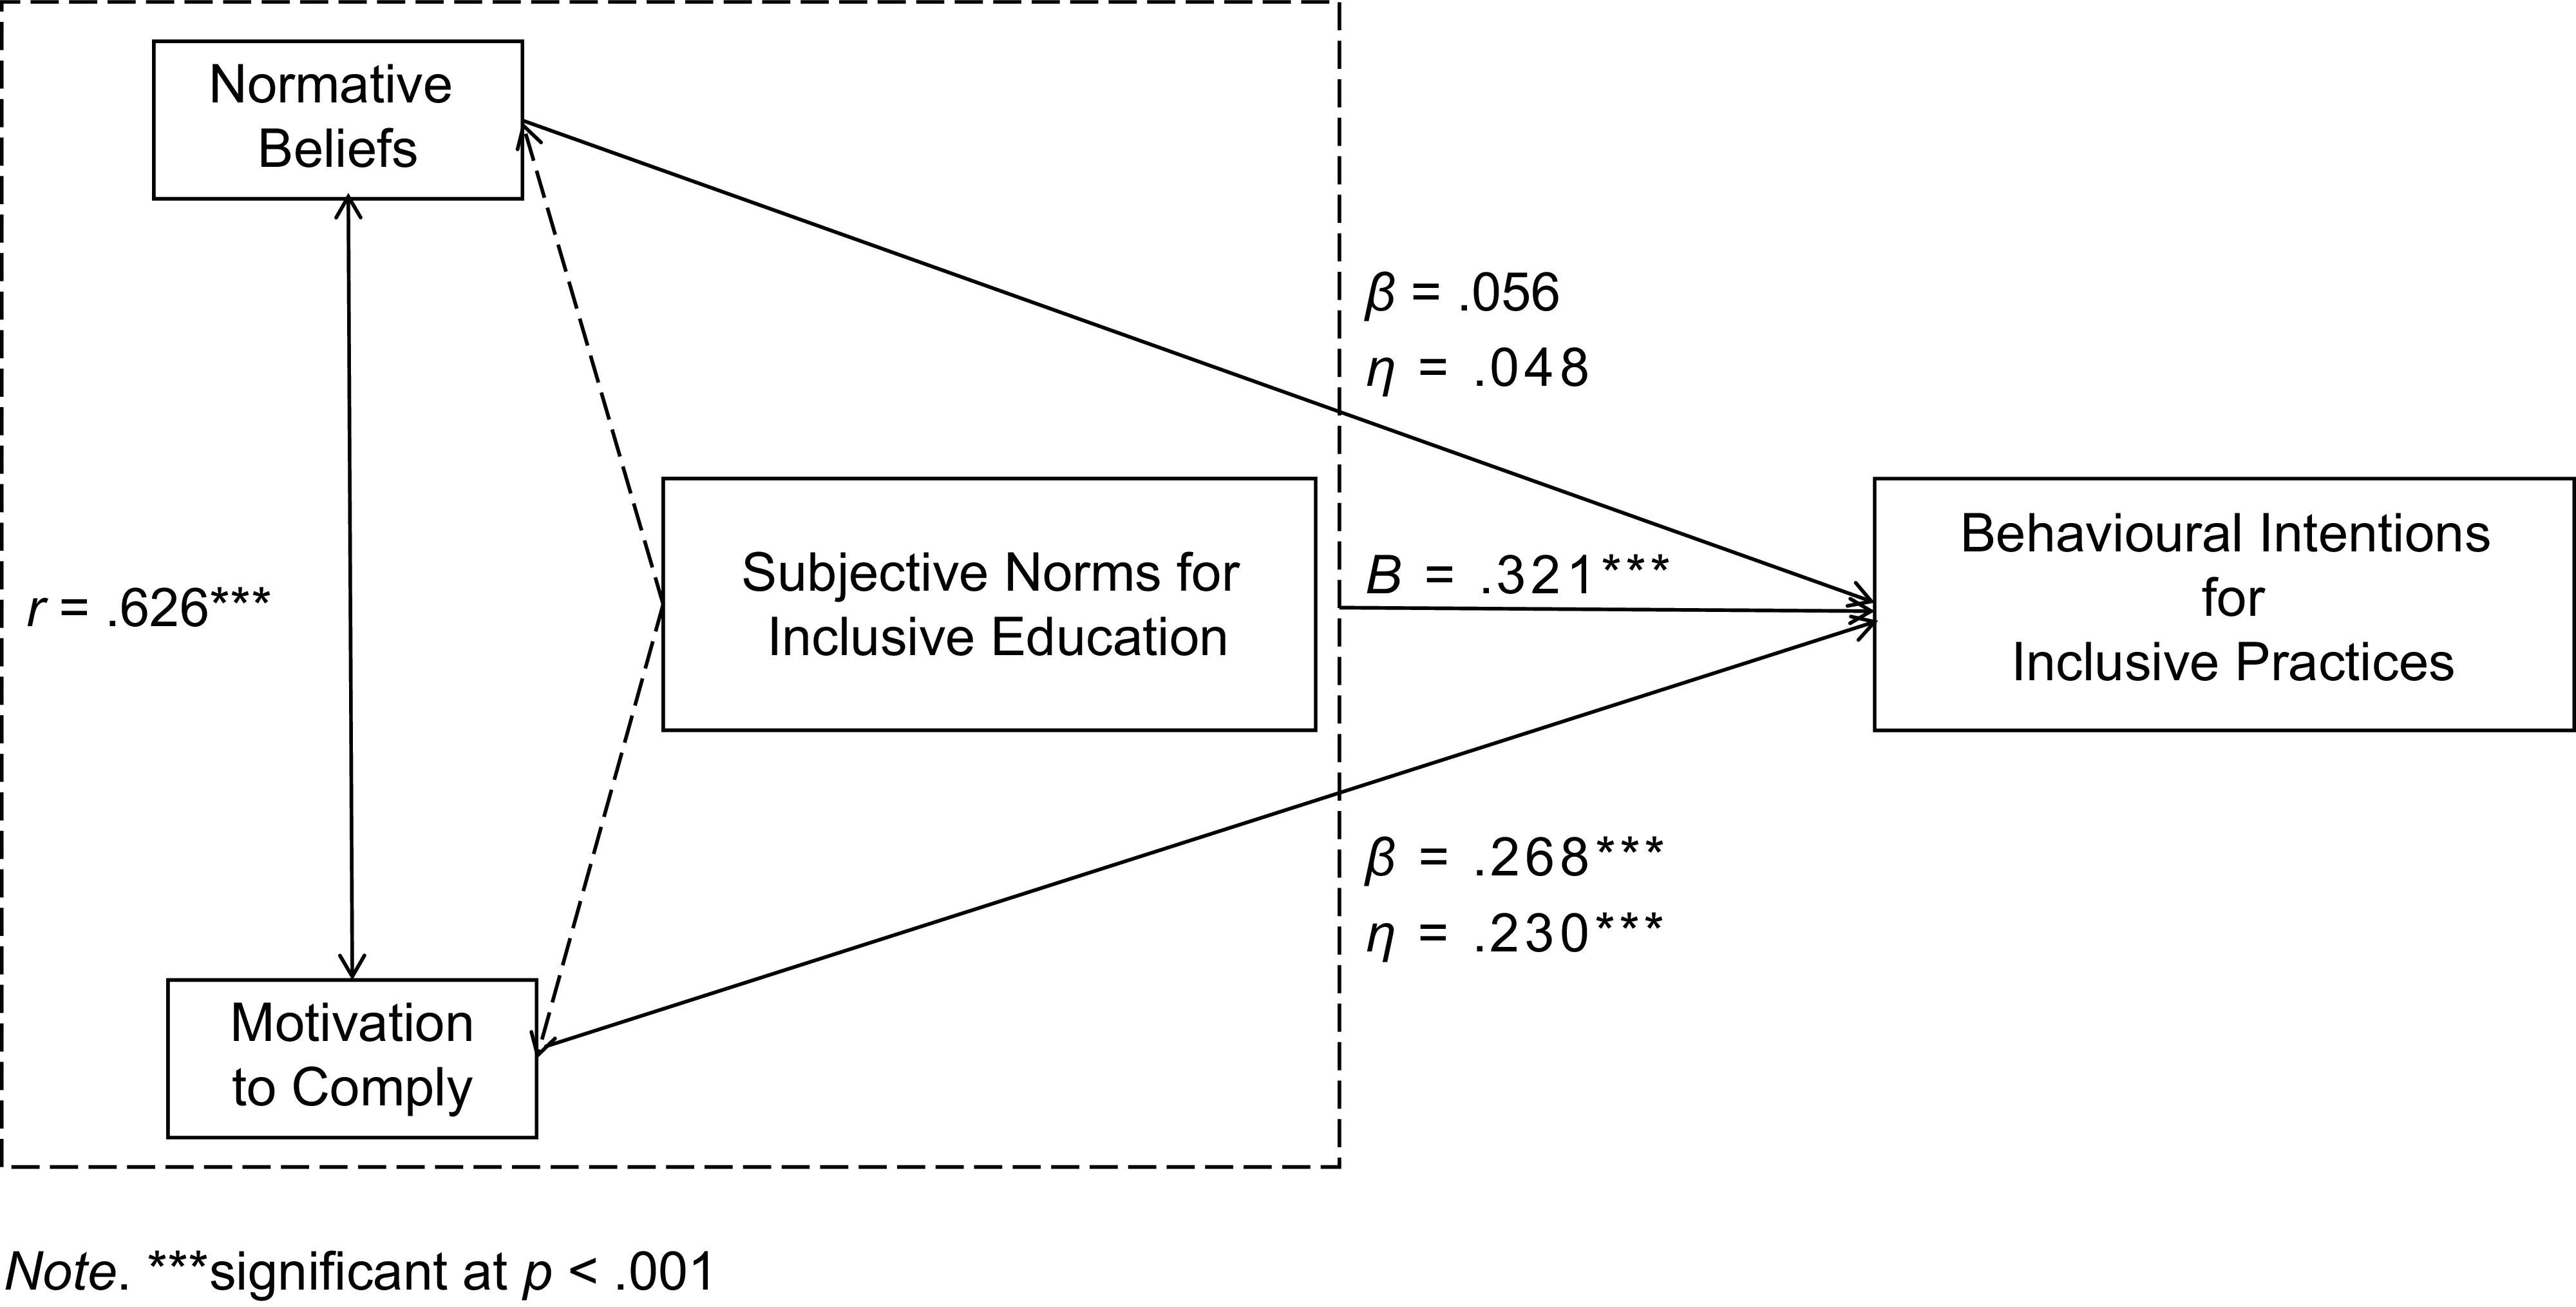
Regression analysis further demonstrated that SNIE significantly predicted BIIP, accounting for 10.3% of the variance, R 2 = .103, F(1, 595) = 68.48, p < .001. The unstandardised regression coefficient (B = .321, p < .001) implies that for every unit increase in SNIE, BIIP increases by .32 units. These results underscore the important role of subjective norms in shaping teachers’ intentions to engage in inclusive education practices.
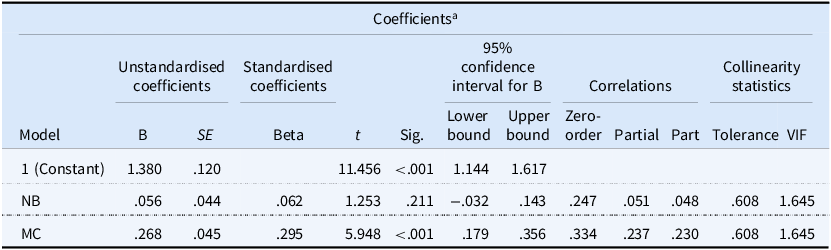
When considering NB and MC as separate predictors of BIIP, the model is also statistically significant, F(2, 594) = 38.059, p < .001, which explains approximately 11.4% of the variance in BIIP (R 2 = .114). The correlation analysis shows moderate positive associations between BIIP and both factors, with Pearson correlation coefficients of .247 for NB and .334 for MC, both significant at p < .001. Additionally, a strong positive correlation exists between NB and MC (r = .626, p < .001), although it is not powerful enough (r = .7 or above) to cause multicollinearity issues (Pallant, Reference Pallant2020).
In the regression model (Table 7), MC demonstrates a significant positive impact on BIIP, indicating that higher motivation levels are linked to increased behavioural intentions towards inclusive practices. In contrast, NB does not yield a statistically significant effect, implying that although NB may hold some relevance, it does not directly affect BIIP in this study’s context. Notably, the part correlation coefficients (semi-partial correlation value) indicate that only 0.23% of BIIP is uniquely explained by NB, while 5.29% is attributed to MC. Figure 1 shows the relationships among the variables. These findings highlight the critical role of MC in shaping teachers’ intentions to participate in inclusive practices.
Multiple Regression: NB and MC on BIIP

Table 7. Long description
A table titled 'Coefficients' presents the results of a regression model analyzing the impact of NB and MC on BIIP. The table has 7 columns and 3 rows, including a header row and a constant term row. The columns are labeled as follows: Model, Unstandardised coefficients (B and SE), Standardised coefficients (Beta), 95% confidence interval for B (Lower bound and Upper bound), Correlations (Zero-order, Partial, Part), and Collinearity statistics (Tolerance and VIF). The rows are labeled as (Constant), NB, and MC. The values in the table are as follows: Row 1 (Constant): B 1.380, SE .120, Beta, t 11.456, Sig .000, Lower bound 1.144, Upper bound 1.617, Zero-order, Partial, Part, Tolerance .608, VIF 1.645. Row 2 (NB): B .056, SE .044, Beta .062, t 1.253, Sig .211, Lower bound -.032, Upper bound .143, Zero-order .247, Partial .051, Part .048, Tolerance .608, VIF 1.645. Row 3 (MC): B .268, SE .045, Beta .295, t 5.948, Sig .000, Lower bound .179, Upper bound .356, Zero-order .334, Partial .237, Part .230, Tolerance .608, VIF 1.645. The table indicates that MC has a significant positive impact on BIIP, while NB does not show a statistically significant effect.
Note. BIIP = behavioural intentions for inclusive practices; VIF = variance inflation factor; NB = normative beliefs; MC = motivation to comply.
a Dependent variable: BIIP.
SNIE-BIIP Model.

Discussion
The findings indicate that elementary school teachers in a second-tier city on China’s southeast coast perceived both SNIE and BIIP at slightly above moderate levels. Specifically, teachers’ reports highlighted considerable resistance to implementing personalised instructional strategies and revealed lower proficiency in administering individualised test accommodations. This aligns with previous research showing that many Chinese teachers lack a comprehensive understanding of differentiation and individualised teaching (Zhang & Lin, Reference Zhang and Lin2022), often misconstrue these concepts as equivalent to ability grouping, and tend to rely on experiential judgement rather than data-driven decisions, ultimately resulting in less favourable student learning outcomes. These results underscore the need for teacher training programs to place greater emphasis on differentiation and individualised instructional practices.
Item-level analysis of the SNIE scale revealed that workplace influences play a pivotal role in shaping teachers’ intentions to implement inclusive education. Although the opinions of experts and specialists significantly inform teachers’ beliefs, these beliefs do not consistently translate into corresponding actions. Instead, it is the observable behaviours of school leaders, peer teachers, students, and parents that more effectively drive teachers’ compliance with inclusive practices. Although the study confirmed the significant influence of subjective norms on behavioural intentions, only MC emerged as a significant predictor of BIIP, whereas NB did not. This finding challenges Ajzen’s (Reference Ajzen1991) TPB, which posits that both NB and MC jointly predict behavioural intention. However, it is consistent with prior studies showing that referents’ beliefs and expectations are often weak or insignificant predictors of intentions to adopt inclusive practices (Mentel et al., Reference Mentel, Förster, Forthmann and Souvignier2024), which may reflect differences in the relative predictive contributions of NB and MC within the subjective norm construct.
This discrepancy may stem from the asymmetric influence of descriptive versus injunctive norms introduced in the focus theory of normative conduct (Cialdini et al., Reference Cialdini, Reno and Kallgren1990). Specifically, MC, which reflects individuals’ willingness to align with perceived behavioural practices of referent others, corresponds to descriptive norms (‘what others do’), whereas NB captures injunctive norms (‘what others approve’). Our findings suggest that participants prioritised observable behavioural cues over perceived attitudinal endorsements, resonating with the focus theory of normative conduct, which indicates that descriptive norms, grounded in others’ actual behaviour, are readily adopted, while injunctive norms require more cognitive processing such as enhancing the perceived persuasiveness of advertisements or messages (Cialdini, Reference Cialdini2003). In essence, concrete actions hold greater sway than mere beliefs in fostering the adoption of inclusive education.
Furthermore, Bandura’s (Reference Bandura1977) social learning theory emphasises the role of observational learning, whereby individuals adjust their own actions by watching others and the outcomes of those actions. In settings where referents’ behaviours and their consequences are highly observable, MC may reflect a tendency to imitate such actions to gain social approval or avoid punishment, rather than merely endorsing others’ viewpoints. This effect may be especially salient in collectivist cultures, where the authority of the government is more pronounced (Sing et al., Reference Sing, Teo, Huang, Chiu and Wang2022). However, in the context of China, although most policies stress teacher moral education, the importance of inclusive education, and even provide guidance on implementing inclusive education (i.e., State Council of the People’s Republic of China, 2019), practical application in Chinese classrooms is limited and often lacks quality. Many observed practices are symbolic rather than substantive, sometimes even resulting in conflicts during implementation (Yang et al., Reference Yang, Zhao and Wang2020), and are thus unlikely to positively influence teachers witnessing these challenges. The contrast between theory and practice underscores that ‘actions speak louder than words’ and that theoretical ideals must be brought to life through practical application. Future research could examine whether this trend is consistent across other contexts.
Implications
Based on these findings, educational leaders might prioritise strategies that promote tangible actions by bringing exemplary teachers into a greater number of schools, enabling all teachers to have role models within their campuses. Furthermore, the current emphasis on diversity within school education has placed most of the responsibility for fostering inclusive classrooms on teachers (Curran & Petersen, Reference Curran and Petersen2017). However, inclusive education can only succeed when it is a collective effort among all societal stakeholders. The government and leaders should model inclusive behaviours, and policies that encourage inclusive actions must be robustly designed and enforced. This would help make inclusive education a natural outcome of a society-wide effort rather than a solitary challenge faced by teachers.
Limitations and Future Research
Despite its contributions, this study has several limitations. The generalisability of the SNIE scale is constrained by the specific context and sample employed in its development. Future research should investigate environmental factors influencing inclusive education and examine the cross-cultural reliability of the SNIE scale in diverse settings. Furthermore, the use of self-report data raises concerns about common method bias; this issue could be mitigated in future studies by reducing the number of items or incorporating mixed-method approaches. In addition, the cross-sectional design restricts the ability to observe changes over time, underscoring the need for longitudinal studies to track teachers’ behavioural changes as they implement inclusive education practices. This study also did not directly capture students’ subjective experiences of inclusion, such as their sense of belonging or peer relationships, focusing instead on teachers’ intentions and reported practices as antecedent conditions for inclusion. Finally, this study assessed behavioural intentions rather than actual behaviours, which do not always align (van de Wetering et al., Reference van de Wetering, Grapsas, Poorthuis and Thomaes2025). Habitual processes, for example, especially for repeated actions, can exert a stronger influence on long‑term behaviour than intention, thereby diminishing intention’s predictive power (Venkatesh et al., Reference Venkatesh, Davis and Zhu2023). Future research should integrate self‑report measures with observational or objective methods to improve both the accuracy and ecological validity, and, where appropriate, incorporate student-reported outcomes to examine how teachers’ intentions and classroom practices translate into students’ social participation and sense of inclusion.
Conclusion
This study addresses the initial questions concerning the levels of SNIE and BIIP among elementary school teachers in a second-tier city on China’s southeast coast. A new SNIE scale was developed to measure subjective norms for inclusive education — a key predictor of teachers’ intentions to adopt inclusive practices that has received limited attention in previous research. This scale broadens the conceptual scope of subjective norms and offers valuable insights into the Chinese context. Among the two SNIE dimensions, MC emerged as a more significant predictor than NB. This finding underscores the importance of observable behaviours in shaping subjective norms and influencing teachers’ behavioural intentions, suggesting that future research should emphasise the role of modelling concrete actions.
Data availability statement
The data that support the findings of this study are available from the corresponding author upon request.
Acknowledgements
We would like to express our gratitude to Wenzhou education bureaus, educational leaders, and school principals who assisted in data collection, and all the teachers who participated in this study. During the preparation of this work the authors used ChatGPT-3.5 in order to improve the readability and language of the manuscript. After using this tool, the authors reviewed and edited the content as needed and take full responsibility for the content of the published article.
Author contributions
All authors contributed to the conception and design of the study. Material preparation, data collection, and analysis were conducted by Tong Lin and Jahirul Mullick. Tong Lin drafted the initial manuscript, and all authors provided feedback on earlier versions. Jahirul Mullick edited, revised, and proofread the manuscript. Midya Yousefi contributed to the methodology design, data analysis, and interpretation of the findings. All authors read and approved the final version of the manuscript.
Competing interests
The second author of this paper is a member of the AJSIE Editorial Board.


 Open access

