Introduction
Apatite [Ca5(PO4)3(OH,F,Cl)] is a common accessory mineral in igneous, metamorphic and sedimentary rocks and an important REE bearer. Its atomic arrangement allows the incorporation of diverse elements in the structure such as S, Fe, Mn, Sr, Ba, Pb, Si, Na, Th, U and REE (the lanthanides plus Y). These elements occupy the Ca sites or replace P in the PO4 tetrahedron. Due to this wide range of replacement possibilities, apatite can play a key role in the content of minor and trace elements of a rock (Hughes and Rakovan, Reference Hughes and Rakovan2015). Therefore, study of apatite and its composition is extremely important to the comprehension of petrogenetic processes (Sha and Chappel, Reference Sha and Chappel1999; Piccoli and Candela, Reference Piccoli, Candela, Kohn, Rakovan and Hughes2002; Spear and Pyle, Reference Spear, Pyle, Kohn, Rakovan and Hughes2002; Harlov, Reference Harlov2015).
The interaction of apatite originally enriched in REE with metasomatic fluids can result in the formation of inclusions and rims of monazite [LREE(PO4)] and xenotime [(Y,HREE)(PO4)] (where LREE = light rare-earth elements and HREE = heavy rare-earth elements) through a dissolution–reprecipitation process (Harlov et al., Reference Harlov, Förster and Nijland2002a, Reference Harlov, Wirth and Förster2005; Harlov and Forster, Reference Harlov and Förster2003). The affected regions of the apatite are characterised by a pervasive, inter-connected micro- and nano-porosity which allows fluids to infiltrate. The fluid speeds up mass transfer, allowing for rapid growth of monazite and xenotime inclusions by recycling the available P, Y and REE in the apatite, whereas the micro- and nano-pores provide nucleation sites (Putnis, Reference Putnis2002, Reference Putnis, Oelkers and Schott2009; Harlov and Förster, Reference Harlov and Förster2008).
The relationship between the apatite dissolution–reprecipitation process and the formation of monazite and xenotime inclusions and rims has been investigated previously in several different rock types: (1) magnetite–apatite ore (Harlov et al., Reference Harlov, Andersson, Förster, Nyström, Dulski and Broman2002b, Reference Harlov, Wirth and Förster2005); (2) granulite-facies metapelites (Harlov et al., Reference Harlov, Marschall and Hanel2007); (3) carbonatite-derived late-stage hydrothermal processes (Broom-Fendley et al., Reference Broom-Fendley, Styles, Appleton, Gunn and Wall2016); (4) nepheline clinopyroxenites (Krause et al., Reference Krause, Harlov, Pushkarev and Brügmann2013); and (5) granitic pegmatite (Harlov, Reference Harlov2011). The observed textural similarities in those different rock types point to an origin related to metasomatic processes common to different geological environments. Both inclusions and rims of monazite and xenotime might form over a wide range of pressure (100–1,000 MPa) and temperature (100–900°C) conditions (Harlov and Förster, Reference Harlov and Förster2008). Mineral nucleation depends on both the REE content in apatite and composition of the metasomatic fluid (Boudreau and McCallum, Reference Boudreau and McCallum1990; Harlov et al., Reference Harlov, Förster and Nijland2002a, Reference Harlov, Wirth and Förster2005; Harlov and Förster, Reference Harlov and Förster2003).
Fluorapatite constitutes a significant accessory mineral phase of the Volta Grande pegmatite swarm, located in the São João del Rei Pegmatite Province, south of Minas Gerais State, southeast Brazil. Fluorapatite from the pegmatites of the Volta Grande mine has a high REE content and hosts several microinclusions of calcite, monazite-(Ce), rhodochrosite and xenotime-(Y). In this investigation, the composition and textural aspects of this mineral assemblage are described and used as evidence to understand its origin. Most of the pegmatites occurring in the surroundings of the Volta Grande mine contain considerable amounts of monazite and xenotime as free mineral phases (Neumann et al., Reference Neumann, Ávila, Cidade, Nascimento, Alves, Garcia, Vasconcelos, Moutinho, Silva, Faulstich and Cunha2018), whereas in the Volta Grande mine these minerals occur predominantly as inclusions in fluorapatite. Similarly, there are several examples of REE-enriched pegmatites, which are well known for hosting minerals essentially composed by these elements (Ercit, Reference Ercit, Linnen and Sampson2005). This work is part of a larger project whose objective is to evaluate the pegmatites of the São João del Rei Pegmatite Province as a potential REE source. Understanding why the largest pegmatites – the ones already committed to mining operations – bear both mineralogical similarities (cassiterite and Nb–Ta minerals) and differences (Li and REE minerals) is also important to be able to relate the metallogenetic events to the geological evolution of the province.
Geological setting
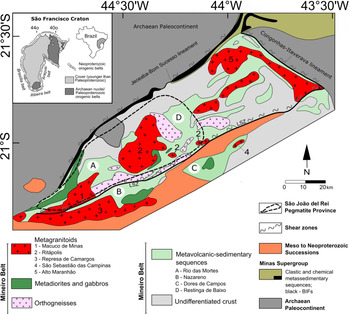
The Volta Grande mine is located in the São João del Rei Pegmatite Province, which lies in the central portion of the Mineiro Belt, south of the São Francisco Craton (Fig. 1). The remnants of three magmatic arcs are preserved within the Mineiro Belt: (1) the Resende Costa arc, which includes the Lagoa Dourada and Resende Costa suites with ages between 2356 ± 3 and 2317 ± 15 Ma (Seixas et al., Reference Seixas, David and Stevenson2012; Teixeira et al., Reference Teixeira, Ávila, Dussin, Corrêa Neto, Bongiolo, Santos and Barbosa2015), the Restinga de Baixo (2318 ± 25 Ma) and Congonhas-Itaverava (2349 ± 14 Ma) metavolcanic-sedimentary sequences; (2) the Serrinha arc which involves the Serrinha and Tiradentes suites with ages varying from 2227 ± 22 to 2204 ± 11 Ma (Ávila et al., Reference Ávila, Teixeira, Cordani, Moura and Pereira2010, Reference Ávila, Teixeira, Bongiolo, Dussin and Vieira2014), the Nazareno (2267 ± 14 to 2223 ± 4 Ma) and Dores dos Campos (2255 ± 51 Ma) metavolcanic-sedimentary sequences and the Estação de Tiradentes metasedimentary sequence (Ávila et al., Reference Ávila, Teixeira, Vasques, Dussin and Mendes2012); and (3) the Ritápolis arc which includes orthogneiss and several non-foliated plutonic bodies with ages between 2191 ± 9 and 2121 ± 7 Ma (Ávila et al., Reference Ávila, Teixeira, Cordani, Moura and Pereira2010; Teixeira et al., Reference Teixeira, Ávila and Nunes2008), as well as the Rio das Mortes metavolcanic-sedimentary sequence (2231 ± 5 to 2202 ± 11 Ma) (Ávila et al., Reference Ávila, Teixeira, Vasques, Dussin and Mendes2012).
Geological outline of the southern part of the São Francisco Craton, showing the main units of the Mineiro Belt (adapted from Barbosa et al., Reference Barbosa, Teixeira, Ávila, Montecinos and Bongiolo2015). LSZ: Lenheiros shear zone.

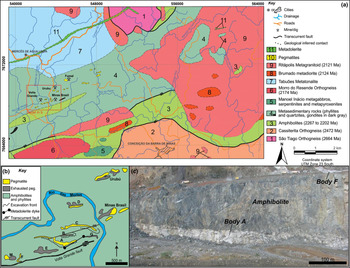
The pegmatite bodies cropping out in the São João del Rei Pegmatite Province were subdivided into mineralised and non-mineralised types. The mineralised pegmatites are generally emplaced in the amphibolites and phyllites of the Rio das Mortes metavolcanic-sedimentary sequence, Brumado metadiorite, Ritápolis metagranitoid and are genetically related to the Ritápolis Pluton (Faulstich et al., Reference Faulstich, Ávila, Neumann, Silveira and Callegario2016). These pegmatites host Sn (cassiterite) and Nb–Ta (columbite-subgroup and microlite-group minerals) and are usually small, tabular, and sub-vertical plunging. Pegmatites of the Volta Grande swarm are distinguished from others in the province mainly by their larger dimensions and distinct geochemical signature (Lagache and Quéméneur, Reference Lagache and Quéméneur1997; Assumpção, Reference Assumpção2015; Alves, Reference Alves2017). These bodies are also mineralised in Sn and Nb–Ta, but they are enriched in Li when compared to the other pegmatites of the province. They are emplaced as sub-horizontal sills that form large lenticular bodies elongated parallel to the foliation of the amphibolites of the Rio das Mortes metavolcanic-sedimentary sequence (Fig. 2a). The largest intrusion (body A) measured 1000 m × 150 m × 20 m before exploitation and its neighbour pegmatites (bodies B, C, D, E, F and M) had maximum dimensions of ~700 m × 120 m × 10 m (Fig. 2b) (Lagache and Quéméneur, Reference Lagache and Quéméneur1997).
(a) Geological map of the area adjacent to the Volta Grande mine, modified from Ávila et al., (Reference Ávila, Bongiolo, Vasques, Souza, Seoane, Ritins, Vilela, Pinheiro, Vasconcelos, Cardoso, Silveira, Silva, Simon, Faulstich, Pires, Stohler, Oliveira and Tedeschi2018); (b) Geological sketch of the Volta Grande mine displaying the distribution of the pegmatites. Peg. – pegmatite. Modified from Lagache and Quéméneur (Reference Lagache and Quéméneur1997) and Assumpção (Reference Assumpção2015); (c) Mining front of the pegmatite body A and F at the Volta Grande mine. The photo was taken looking SW with the body A in the foreground and the body F in the background.

Sample and methods
Samples of the pegmatite body A of the Volta Grande mine used in this study were provided by AMG Mineração S.A. and collected at the mill discharge of its processing plant. Paragenetic and petrographic relationships were established using optical petrography, back-scattered electron (BSE) and cathodoluminescence (CL) imaging.
BSE images were acquired with a FEI Quanta 400 scanning electron microscope operated at 20 kV, coupled to a Bruker Nano Quantax 800 energy-dispersive X-ray fluorescence spectroscope with Bruker XFlash 4030, 5010 or 6|60 SDD detectors. Cathodoluminescence analysis was carried out using a CITL MK 5-2 electron source, operated at 15 kV, 400 μA in vacuum (<0.050 mBar) on a Zeiss Axioimager M2m petrographic microscope. Luminescence spectra were obtained using a CITL OSA2 spectrometer and a LabRAM 800 HR Raman microprobe (Horiba Jobin Yvon) equipped with an electronically cooled CCD detector, with a filter for 632.8 nm (in the range of ~550.0 to 635.2 nm), diffraction grid of 1800 grooves mm–1 with a spectral resolution of ~0.5 cm–1, and coupled to an Olympus BX41 petrographic microscope with a 100× objective, as described by Neumann et al. (Reference Neumann, Vasques and Gomes2014). Excitation elements were attributed following Reisfeld et al. (Reference Reisfeld, Gaft, Boulon, Panczer and Jorgensen1996), Gorobets and Rogojine (Reference Gorobets and Rogojine2002) and Gaft et al. (Reference Gaft, Reisfeld and Panczer2005). The same Raman microprobe (using a 632.8 nm red laser) was used to investigate the apatite and its fluid-inclusions composition. Microthermometry studies were conducted on a Linkam THMS600 stage, using a LNP95 cooling pump, coupled to the previously described Raman microprobe system.
Quantitative apatite, monazite, and xenotime compositions were obtained using a JEOL JXA-8230 Electron probe microanalyser, employing a ZAF correction procedure. The operating conditions were: accelerating potential 15 kV, beam current 20 nA and beam diameter 5 µm. Complete details of analyser crystals, standards, time for peak and background acquisition, and correction factors for overlapped peaks can be found in Supplementary material Table S1. Interference intensities of overlapped peaks were measured by the JEOL internal software and correction factors were calculated by the procedure of Pyle et al. (Reference Pyle, Spear, Wark, Kohn, Rakovan and Hughes2002). The PKα intensity was corrected for YLβ1 interference in apatite, while in monazite and xenotime microinclusions, the PKα, GdLβ, TbLβ, DyLα, ErLα and YbLα measured intensities were corrected for YLβ1, HoLα1, ErLα1, EuLβ1, TbLβ1 and TbLβ2 interferences, respectively.
Trace-element analyses of apatite by laser ablation inductively coupled plasma mass spectrometry (LA-ICPMS) were carried out using a New Wave Research 213 laser attached to an Agilent Technologies 7700x ICPMS. In order to keep the signal constant at higher intensity levels and to confine the analysis to the apatite avoiding microinclusions, the laser system was adjusted to ablate a line at 10 Hz and energy densities between 3 and 4 J cm–2. The line (1175 µm x 25 µm) was ablated by moving the spot with a velocity of 50 µm s–1. The plasma power was set to 1550 W, helium was used as carrier gas (900 ml min–1) and argonium as make-up gas (600 ml min–1), and the measured isotopes were 89Y, 139La, 140Ce, 141Pr, 146Nd, 147Sm, 153Eu, 157Gd, 159Tb, 163Dy, 165Ho, 166Er, 169Tm, 172Yb, 175Lu, 208Pb, 232Th and 238U. The average Ca concentration of apatite, as analysed by electron probe microanalysis (EPMA), was used as an internal standard, while a NIST SRM 612 glass standard was used for external calibration. After analysing the samples, NIST SRM 612 was analysed three times and the measured concentrations were confirmed to match the published values, as presented in Table S2. Element concentrations were calculated according to the method described by Longerich et al. (Reference Longerich, Jackson and Günther1996) and element uncertainties were estimated following Kragten (Reference Kragten1994). Chondrite-normalised values of REE were obtained using the reference chondrite of McDonough and Sun (Reference McDonough and Sun1995). The LREE/HREE ratios were calculated using the sum of the elements concentrations from La to Sm as LREE and from Eu to Lu (plus Y) as HREE. The Eu anomaly was calculated from Eu/Eu*= (Eu)N/[(SmN + GdN)/2].
Results
Fluorapatite and its monazite and xenotime microinclusions
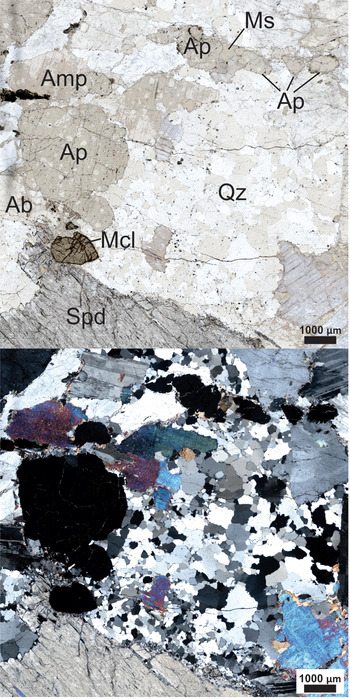
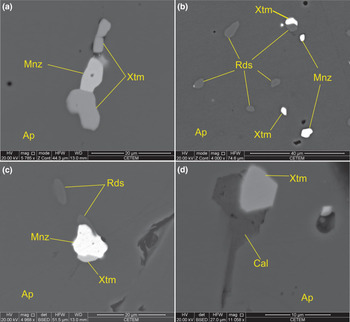
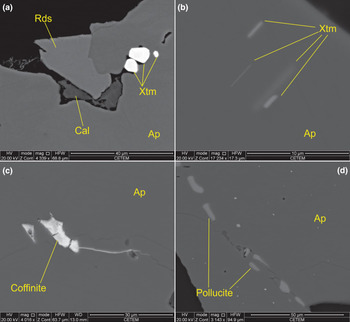
Apatite occurs as subhedral crystals ranging from 0.5 to 5.5 mm in size (Fig. 3) and, although occurring at low grades (< 2%), can be found in all described zones of the Volta Grande pegmatites (Assumpção, Reference Assumpção2015). The crystals usually occur in contact with quartz, albite, amphibole, muscovite or spodumene depending on the zone in which it is found. Fluorite, spodumene and muscovite are also found as small crystals at its rims or filling fractures along the apatite grains. Microinclusions are very common in apatite, the most abundant being monazite and xenotime (Fig. 4a–d), sometimes associated with rhodochrosite (Fig. 4b,c, 5a) or calcite (Fig. 4d, 5a). The size of the observable microinclusions can exceed 10 µm (Fig. 4a) but are usually smaller than 5 µm (Fig. 4b,c, 5a,b). Xenotime microinclusions occur locally in the form of oriented lamellae (Fig. 5b). Coffinite and pollucite inclusions were also observed (Fig. 5c,d).
Transmitted light photomicrograph showing the commonly observed relationships between apatite and the most common minerals (quartz, amphibole, plagioclase, muscovite and spodumene) found in the pegmatite body A of the Volta Grande mine. Upper and lower images are non-polarised and polarised light, respectively. Abbreviations according to Whitney and Evans (Reference Whitney and Evans2010), excepting microlite (Mcl).

BSE images of different microinclusions in apatite grains from the pegmatite body A of the Volta Grande mine: (a) monazite and xenotime >10 µm; (b) small monazite, xenotime and rhodochrosite; (c) large monazite and small xenotime associated with rhodochrosite; (d) xenotime associated with calcite. Abbreviations according to Whitney and Evans (Reference Whitney and Evans2010).

BSE images of different microinclusions in apatite grains from the pegmatite body A of the Volta Grande mine: (a) xenotime related spatially with rhodochrosite and calcite; (b) oriented lamellar xenotime; (c) coffinite; and (d) oriented pollucite. Abbreviations according to Whitney and Evans (Reference Whitney and Evans2010).

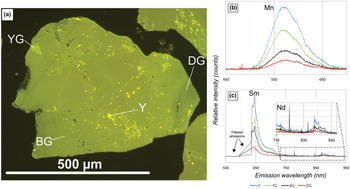
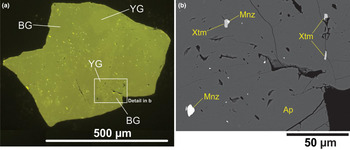
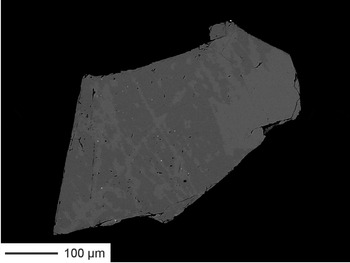
Under cathodoluminescence, apatite luminescence varies between different shades of yellow and green (Figs 6a and 7a). Four colours encompass the observed hues: dark green, brownish-green, yellowish-green and bright yellow. Recorded luminescence spectra for all four colours show emission bands for Mn (572 and 618 nm), Sm (638, 645, 654 and 656 nm) and Nd (868, 872, 876, 883, 891 and 904 nm) (Fig. 6b,c). The emitted colour is correlated directly with the intensity of the CL and the concentration of the activating elements Mn, Sm and Nd in different regions of the crystal. The area distribution for the hues of apatite colours comprises predominantly brownish-green and yellowish-green luminescence, and subordinately dark green; in these domains monazite and xenotime microinclusions could be identified (Fig. 7). Regions with bright yellow luminescence are rare, always in the interior of the grains, and no monazite and xenotime microinclusions could be identified in its domains. The zoning observed in CL images was also observed in high contrast BSE images (Fig. 8).
(a) Cathodoluminescence image of apatite grain from the pegmatite body A of the Volta Grande mine. BG – brownish-green, DG – dark green, Y – yellow and YG – yellowish green; (b) cathodoluminescence spectra obtained by using the CITL OSA2 spectrometer displaying the bands of Mn; (c) cathodoluminescence spectra obtained by using the LabRAM 800 HR Raman microprobe (Horiba Jobin Yvon) displaying the bands of Sm and Nd (inset).

CL and BSE images of apatite crystals from the pegmatite body A of the Volta Grande mine showing: (a) apatite with brownish-green (BG) and yellowish-green (YG) colours of cathodoluminescence; (b) abundant monazite and xenotime microinclusions detected in the BG and YG zones of apatite.

High contrast BSE image of apatite grain showing darker areas, which are depleted in REE when compared to lighter areas.

Composition of apatite
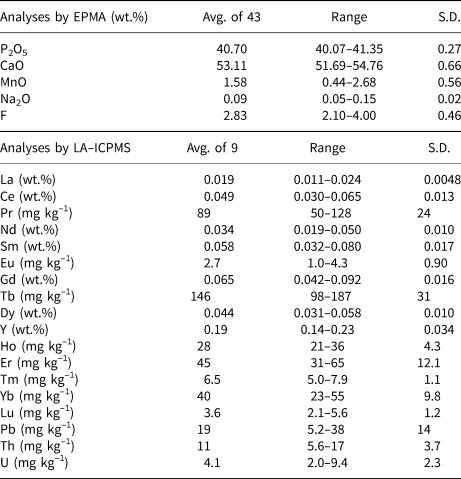
Zones in apatite with yellow luminescence are mostly smaller than the spot size used for EPMA and LA-ICPMS analyses, therefore most of the compositions presented here were obtained by analysing the zones of dark green and brownish-green to yellowish-green luminescence (Figs. 6a and 7a). Complete EPMA and LA-ICPMS apatite data, including compositions and detection limits, are presented in Tables S3 and S4, while Table 1 presents a summary of these results. The average content of F is 2.83 wt.%, while Cl was below the detection limit of the EPMA; OH was calculated for (F + Cl + OH) = 1 and varies between 0 and 0.444 atoms per formula unit indicating that the apatite in the Volta Grande mine is a fluorapatite.
Representative compositions of the fluorapatite from the pegmatite body A of the Volta Grande mine from EPMA (wt.%) and LA-ICPMS (wt.% or mg kg−1) data*.

* Avg.: average; S.D.: standard deviation. SiO2, Al2O3, FeO, MgO, BaO and SO3 concentrations were below the detection limit of the EPMA.
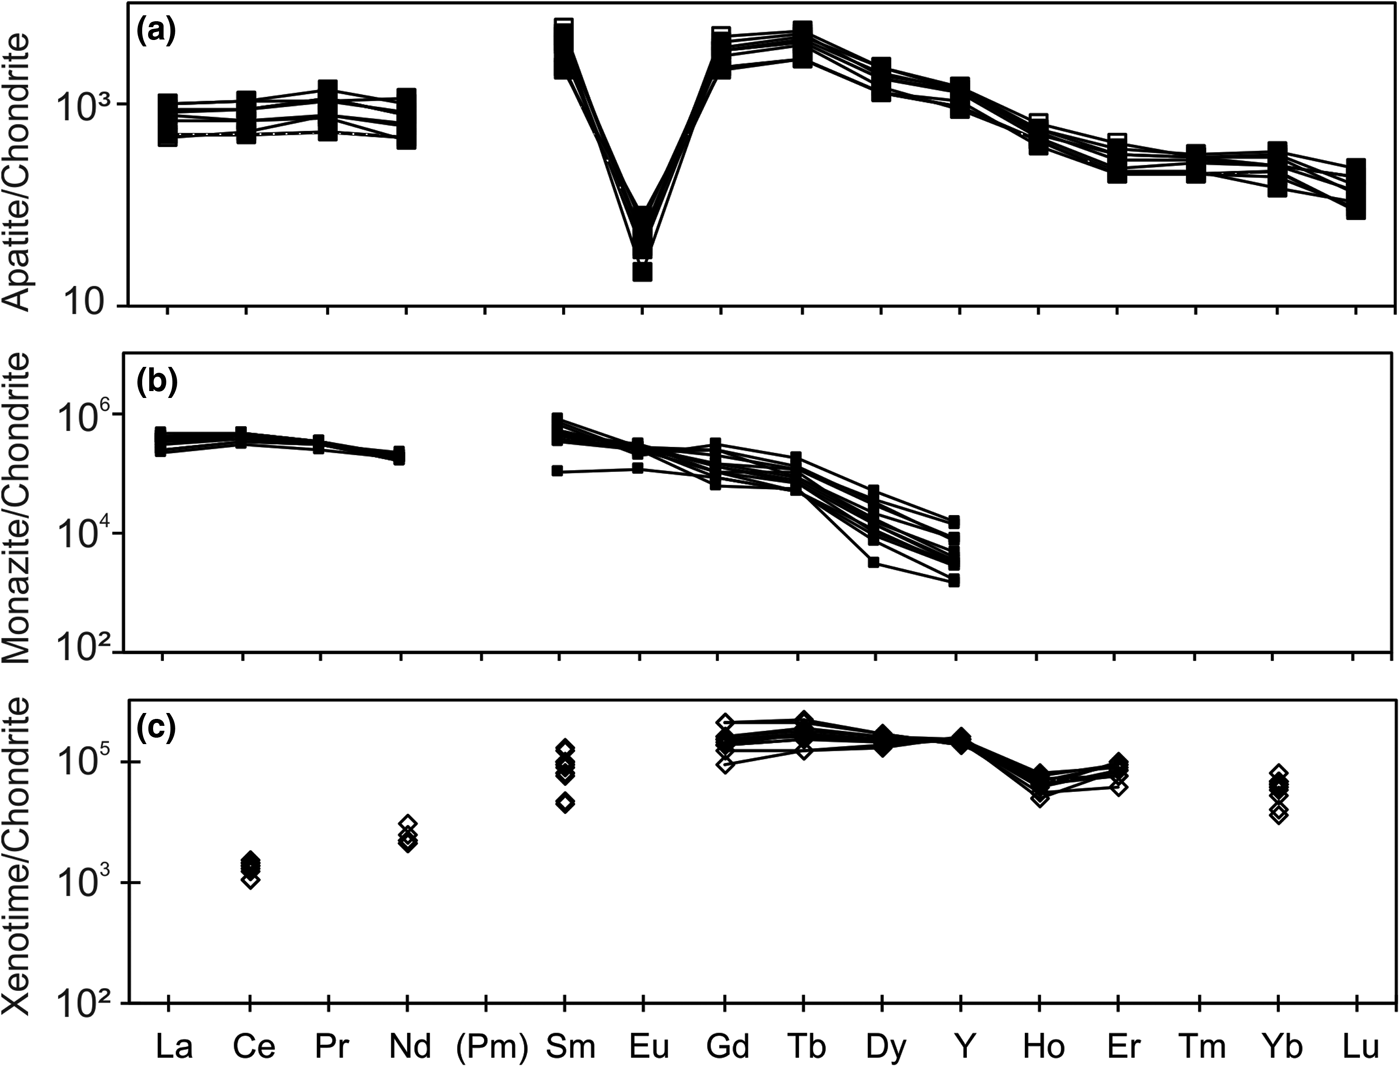
The REE contents in the fluorapatite vary between 3454 and 5783 mg kg−1. The LREE (La to Sm)/HREE (Eu to Lu and Y) abundance ratios are between 0.39 and 0.62, while Sm/Nd ratios vary between 1.20 and 2.77. The chondrite-normalised REE patterns are flattened for LREE and HREE, and reveal an upwards-convex distribution for Sm, Gd and Tb (Fig. 9a). The patterns are also LREE-depleted with negative Eu anomalies (Eu/Eu* varying in the range 0.001–0.009), large (Sm/Nd)N ratios (3.72–8.56, mean 5.46) but small (La/Lu)N (3.05–8.29, mean 5.65) and (La/Sm)N (0.09–0.36, mean 0.21) ratios.
REE chondrite-normalised patterns for fluorapatite, monazite and xenotime from pegmatite body A of the Volta Grande mine: (a) fluorapatite hosting monazite and xenotime microinclusions; (b) monazite microinclusions in fluorapatite; (c) xenotime microinclusions in fluorapatite. Chondrite data from McDonough and Sun (Reference McDonough and Sun1995).

Composition of monazite and xenotime microinclusions
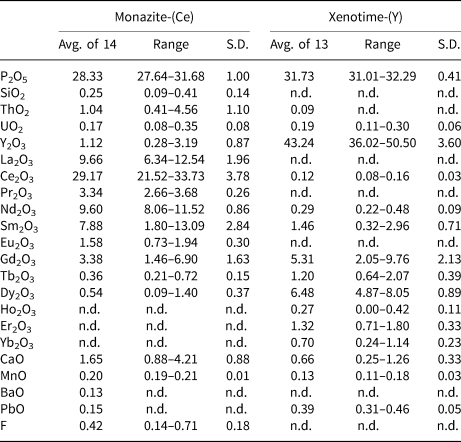
Monazite and xenotime microinclusions with a mean diameter >10 µm were analysed by EPMA (Table 2) and the complete geochemical data obtained for these microinclusions are presented in Table S5.
Representative compositions of the monazite-(Ce) and xenotime-(Y) microinclusions in fluorapatite of the pegmatite body A of the Volta Grande mine from EPMA data (wt.%)*.

* Avg.: average; n.d.: not detected; S.D.: standard deviation.
Monazite microinclusions
The concentrations of Ho2O3, Er2O3 and Yb2O3 were below the detection limits for the EPMA method used. Tm2O3 and Lu2O3 were not measured. The REE chondrite-normalised pattern is flat for LREE (La–Sm), and quite steep between Gd and Y (Fig. 9b). The concentrations of Na2O, SrO, Al2O3, MgO, SO3, BaO and PbO in the monazite-(Ce) microinclusions are mostly below the detection limit for EPMA (Table S5). The F content is low, and might be attributed to influence of fluorapatite, considering the monazite-(Ce) microinclusions are small (Fig. 4a–c). ThO2 contents were predominantly under 1.26 wt.%, while UO2 maximum is 0.35 wt.%.
Xenotime microinclusions
The concentrations of Er2O3, Tb2O3, Yb2O3, Nd2O3 and Ce2O3 are low. La2O3, Pr2O3 and Eu2O3 concentrations were below the EPMA detection limits. Tm2O3 and Lu2O3 were not measured. The REE chondrite-normalised concentrations reveal slightly upwards-convex patterns with a negative Ho anomaly (Fig. 9c). The concentrations of SiO2, Al2O3, FeO, MgO, BaO, SrO, Na2O and F in the xenotime-(Y) microinclusions are predominantly below the EPMA detection limit (Table S5). Xenotime-(Y), as monazite, has low contents of ThO2 and UO2; however, unlike monazite microinclusions, UO2 content in xenotime is higher than ThO2.
Fluid inclusions in fluorapatite
Fluid inclusions found in fluorapatite (Fig. 10) can be subdivided into two major groups. One is composed of very rare larger inclusions, which are mostly hexagonal (negative crystals) and vary between 8–15 µm in size. A second group is more abundant, and consists of small rounded fluid inclusions with dimensions not surpassing 5 µm in diameter. Both groups are biphasic, where liquid (L > 80%) predominates over the vapour phase (V < 20%) and the fluids are very clear with no rim over the vapour phase or daughter crystal in the liquid phase. The distribution of the two groups is the same and they do not cross crystal boundaries. We interpret these inclusions as being related to the event in which fluorapatite recrystallised.
Examples of the fluid inclusions found in fluorapatite from the pegmatite body A of the Volta Grande mine. Fluid inclusions of the first group can be seen in the centre of photomicrography (a, b) and the small inclusions of the second group are scattered along the crystal in (b).

The small fluid inclusion size meant that Raman microprobe and microthermometric analyses were challenging. Raman data was impaired by strong fluorescence of the host fluorapatite, particularly in the Raman shift range in which CO2 and H2O vapour vibrate. Microthermometry data obtained for the rare larger fluid inclusions are presented in Table 3. Salinity was calculated as wt.% eq. NaCl by using the empirical expression given by Bodnar (Reference Bodnar1993).
Microthermometric data for fluid inclusions in the fluorapatite from the pegmatite body A of the Volta Grande mine.

Discussion
Chemical anomalies in fluorapatite, monazite-(Ce) and xenotime-(Y) as evidence for dissolution–reprecipitation
Pegmatites from the Volta Grande mine are well known for being enriched in Li, Cs, Ta and Sn, in comparison to NYF-type (niobium–yttrium–fluorine) pegmatites, (Lagache and Quéméneur, Reference Lagache and Quéméneur1997). Therefore, they are classified as LCT-type (lithium–caesium–tantalum) pegmatites using the classification system proposed by Černý and Ercit (Reference Černý and Ercit2005), implying that they are related to a peraluminous S-, I- or mixed (S + I)-type magmatism. The high MnO and F, and low SO3 and Cl concentrations in fluorapatite point to low oxygen fugacity and high aluminosity conditions (Sha and Chappel, Reference Sha and Chappel1999; Chu et al., Reference Chu, Wang, Griffin, Chung, O'Reilly, Pearson and Iizuka2009). This resembles the characteristics of apatite in felsic I-type or S-type granites. However, low Na and Fe contents, and the REE distribution in the fluorapatite do not match the standard behaviour of these elements in apatite from felsic I-type or S-type granites. The comparison of the REE distribution in apatite from the Volta Grande mine with compositions of apatite from granites (Sha and Chappel, Reference Sha and Chappel1999; Szopa et al., Reference Szopa, Gaweda, Müller and Sikorska2013) and LCT-type pegmatites (Cao et al., Reference Cao, Zhou, Qin, Tang and Evans2013) also reveals differences (Table 4), the most distinguishing features being the high values for Sm/Nd and (Sm/Nd)N ratios when compared to the literature data.
Comparison between the chemical signature of the fluorapatite from the pegmatite body A of the Volta Grande mine and the apatite from felsic I-type and S-type granites (Sha and Chappel, Reference Sha and Chappel1999), LCT-type pegmatites (Cao et al., Reference Cao, Zhou, Qin, Tang and Evans2013) and shoshonitic to high-K calc-alkaline granitic rocks (Szopa et al., Reference Szopa, Gaweda, Müller and Sikorska2013). Grades in mg kg−1.

Avg.: average
The chemical signatures of the monazite-(Ce) and xenotime-(Y) microinclusions also differ to those in granites. The observed ThO2 and UO2 concentrations in the monazite-(Ce) and xenotime-(Y) microinclusions are much lower than expected for S-type granites, which are usually high (Table 5). The REE chondrite-normalised patterns of the microinclusions are very similar to those from S-type granites (Förster, Reference Förster1998a,Reference Försterb), but the (Sm/Nd)N ratios are slightly different (Table 5). High contents of Sm2O3 in monazite usually follow even higher levels of Nd2O3 (Förster, Reference Förster1998a), whereas those from Volta Grande present similar Nd2O3 and Sm2O3 concentrations. Xenotime microinclusions also display Sm2O3 concentrations higher than those observed in xenotime from granites, and a negative Ho anomaly that might indicate the involvement of a fluid phase during its precipitation (Bau, Reference Bau1996). These geochemical features suggest that monazite-(Ce) and xenotime-(Y) did not crystallise from a melt.
Comparison between some of the chemical features of the monazite-(Ce) and xenotime-(Y) hosted in the fluorapatite from the pegmatite body A of the Volta Grande mine and the chemical features of monazite and xenotime from S-type Li-mica granites as described by Förster (Reference Förster1998a,Reference Försterb).

Avg.: average
Dissolution and precipitation are the main driving mechanisms for re-equilibration reactions in the presence of a fluid phase (Putnis, Reference Putnis, Oelkers and Schott2009). Generally, the coupled dissolution–reprecipitation process is a chemical reaction driven by the decrease of the free energy of a system (Putnis, Reference Putnis2002, Reference Putnis, Oelkers and Schott2009; Ruiz-Agudo et al., Reference Ruiz-Agudo, Putnis and Putnis2014). The main condition for the occurrence of this reaction is the presence of one or more solid phases out of equilibrium with a fluid. This creates chemical potential for the crystallisation of a new solid phase or the recrystallisation of the same phase with a different composition to re-equilibrate the system (Putnis, Reference Putnis2002). The composition of these new or altered solid phases must then be interpreted as descendant of the composition of the original solid phase (Putnis, Reference Putnis2002, Reference Putnis, Oelkers and Schott2009). Monazite and xenotime inclusions that have been metasomatically induced to form in apatite characteristically reflect the trace-element chemistry of the apatite (Harlov et al., Reference Harlov, Förster and Nijland2002a; Harlov and Förster, Reference Harlov and Förster2003).
Monazite-(Ce) and xenotime-(Y) originated from a metasomatically induced dissolution–reprecipitation process implies the original fluorapatite must be more enriched in REE than the reprecipitated fluorapatite. The yellow luminescent zones in the Volta Grande fluorapatite, not measurable by LA-ICPMS due to their small size, present the highest Mn, Sm and Nd counts in the CL spectra, inferring higher Mn, Sm and Nd concentrations and possibly higher total REE concentrations among all CL domains. Only one EPMA for the yellow-luminescing apatite gave the highest Y, La and Ce contents among all measurements as well. This suggests that the yellow luminescent zones might represent the original fluorapatite, from which the monazite-(Ce), xenotime-(Y) and the reprecipitated fluorapatite could have inherited their chemical signature. Regardless of the small amount of REE chemical data from the original fluorapatite, apatite from felsic-I or S-type granites is generally depleted in Th and U, and usually displays high (Sm/Nd)N ratios (Sha and Chappel, Reference Sha and Chappel1999), which also matches our data.
Fluid composition
Microthermometry data indicate that the fluid responsible for hydrothermal alteration of fluorapatite corresponds to an aqueous solution with some degree of salinity. It was very difficult to observe the first-melting temperature, which may be lower than –56.6°C, which is consistent with the absence of CO2. Low first-melting temperatures are usually related to the presence of LiCl in the fluids, however the true eutectic melting temperatures in these cases appear to be not observable because the fluid is metastable (Dubois et al., Reference Dubois, Monnin, Castelain, Coquinot, Gouy, Gauthier and Goffé2010). The eutectic temperature presented here must then be interpreted as an indicator of the true eutectic temperature. Furthermore, the presence of LiCl in a fluid related to the evolution of the pegmatites from the Volta Grande mine supports Lagache and Quéméneur (Reference Lagache and Quéméneur1997), who demonstrated that during the magmatic crystallisation of the Volta Grande pegmatites, a Li-rich fluid coexisted with the melt and promoted the re-equilibration of minerals of the pegmatite. If this fluid is the same as the one responsible for hydrothermal alteration of the fluorapatite, it can be assumed that this alteration occurred during a late-stage of crystallisation of the pegmatites from the Volta Grande mine. Harlov (Reference Harlov2011) documented a similar process in a granitic pegmatite from Froland, southern Norway. In this case, monazite and xenotime inclusions in fluorapatite were a consequence of at least two events of fluid-induced alteration of fluorapatite during the later stages of subsolidus cooling of the pegmatite. The homogenisation temperature measured for the fluid related to hydrothermal alteration of fluorapatite of pegmatite body A from the Volta Grande mine indicates that the process occurred at temperature of at least 204.5°C. This is another common feature with the situation described by Harlov (Reference Harlov2011), in which the two events occurred at a temperature below 300°C.
Origin of carbonate associated minerals
Calcite and rhodochrosite occur spatially close to and locally intergrown with the REE-phosphates implying that they grew together. Calcium and Mn incorporated in these carbonate solid phases are here interpreted as originating from the original fluorapatite structure. The absence of siderite, dolomite or magnesite would support this hypothesis, because fluorapatite is depleted in FeO and MgO but is enriched in MnO and CaO that could have been remobilised to form, respectively, rhodochrosite and calcite. The origin of the reprecipitated fluorapatite is related to a dissolution–reprecipitation process, mediated by a fluid preserved in its primary fluid inclusions. An absence of CO2 in reprecipitated fluorapatite fluid inclusions indicates that no carbonic fluids were involved in its crystallisation, or they were fully consumed by some reaction during the formation of calcite and rhodochrosite. Harlov (Reference Harlov2011) suggests, however, that the role of the fluid in the dissolution–reprecipitation process is to act only as a medium of mass transfer and not to be consumed by the reaction. Therefore, CO32− precipitated in carbonate solid phases might also originate from original fluorapatite. Unfortunately, this could not be determined directly by Raman spectroscopy for the yellow luminescent zones, inferred to be the precursor apatite, due to their small grain size, high detection limit and strong fluorescence masking the carbonate vibration.
Conclusions
Fluorapatite from the Volta Grande mine has a geochemical signature that resembles that of S- or I-type magmatic systems, as expected from its LCT character. Rare-earth element abundances in LCT-type pegmatites are generally negligible, because of their high-silica and peraluminous liquid compositions in which REE are highly insoluble (London, Reference London2018), which matches the very rare occurrence of monazite or xenotime as free mineral phases in the pegmatites of the Volta Grande mine. The presence of considerable amounts of these minerals in pegmatites occurring in the surroundings of the Volta Grande mine should implicate they belong to a different generation of pegmatites or that these pegmatites constitute a mixed field similar to that described by Ercit et al. (Reference Ercit, Groat and Gault2003). In this second case, REE-enriched and less fractionated pegmatites occur in the surroundings of the Volta Grande area, in which relatively REE-depleted and more fractionated pegmatites occur. Although it was not the main goal of this work, the results presented here indicate that the REE content in the fluorapatite and the size and abundance of the monazite-(Ce) and xenotime-(Y) microinclusions in Volta Grande pegmatites are not significant in terms of a REE ore. Nevertheless, Volta Grande ore should not be discarded as a potential but minor phosphate and REE by-product of the Sn, Nb-Ta and Li production.
The differences between the composition of fluorapatite and its monazite-(Ce) and xenotime-(Y) microinclusions from the Volta Grande mine and those crystallised from granitic melts (Förster Reference Förster1998a,Reference Försterb; Sha and Chappel, Reference Sha and Chappel1999; Cao et al., Reference Cao, Zhou, Qin, Tang and Evans2013; Szopa et al., Reference Szopa, Gaweda, Müller and Sikorska2013) provide evidence that a metasomatic event was responsible for the replacement of an originally REE-enriched fluorapatite by a relatively REE-depleted reprecipitated fluorapatite, and nucleation of monazite-(Ce) and xenotime-(Y) as inclusions. As a consequence of the restricted chemical condition in which monazite-(Ce) and xenotime-(Y) microinclusions originated, the low concentrations of ThO2 and UO2 of the parent apatite are preserved. Rhodochrosite and calcite microinclusions are probably products of the same process, which suggests that the original fluorapatite also contained CO32– in its structure. The process responsible for forming this mineral assemblage is proposed to follow reaction 1:
 $$\eqalign{& \lsqb {{\rm C}{\rm a}_{(5\ndash 2a\ndash b\ndash 1/2x)},{\rm N}{\rm a}_{\rm a},{\lpar {{\rm Y} + REE} \rpar }_a,{\rm M}{\rm n}_b} \rsqb \lsqb {{\lpar {{\rm P}{\rm O}_4} \rpar }_{3\ndash x}{\lpar {{\rm C}{\rm O}_3} \rpar }_x\lpar {\rm F} \rpar } \rsqb \cr & + {\rm Fluid}\lsqb {a\lpar {2{\rm C}{\rm a}^{2 +} + {\rm} {\rm P}^{5 +}} \rpar {\rm} + {\rm} \lpar {x\ndash b} \rpar \lpar {{\rm C}{\rm a}^{2 +}} \rpar {\rm} + {\rm} {\rm H}_2{\rm O}} \rpar ] \cr & \to \lsqb {{\rm C}{\rm a}_5{\lpar {{\rm P}{\rm O}_4} \rpar }_3\lpar {{\rm F},{\rm OH}} \rpar } \rsqb {\rm} + a \lsqb {\lpar {{\rm Y} + REE} \rpar {\rm P}{\rm O}_4} \rsqb \cr & + b \lsqb {{\rm Mn}\lpar {{\rm C}{\rm O}_3} \rpar } \rsqb {\rm} + {\rm} \lpar {x\ndash b} \rpar \lsqb {{\rm Ca}\lpar {{\rm C}{\rm O}_3} \rpar } \rsqb {\rm} + {\rm Fluid}\,a\lsqb {{\rm N}{\rm a}^ +} \rsqb}$$
The dissolution–reprecipitation process, in the fluorapatite from the Volta Grande mine, worked on a microscale as a mineralising episode concentrating REE, once dispersed in original fluorapatite structure, into the newly formed monazite-(Ce) and xenotime-(Y) microinclusions. The LiCl-rich brines assumed to have promoted dissolution–reprecipitation of fluorapatite are probably the ones attributed by Lagache and Quéméneur (Reference Lagache and Quéméneur1997) to the late-stage crystallisation of the pegmatites in this region. Thus, the REE-mineralisation of microinclusions in fluorapatite occurred at a late stage during pegmatite petrogenesis at the Volta Grande mine.
Acknowledgements
The Brazilian National Research Council (CNPq) is acknowledged for the support under the project “Mineralogical characterisation of the ore and tailings of the pegmatites at the Volta Grande mine, São João del Rei, Minas Gerais, aiming at recovery of the REE minerals as secondary products”, for a MSc grant (F.E.A. Alves) and for research grants (C.A. Ávila and R. Neumann). We thank A.F. Silva, C.S. Assumpção and P.E.M. Ferreira from AMG Mineração for samples, assistance and discussions at the mine site. We thank I.M.C.P. Araújo and J.A. Brod for EPMA analyses at the Regional Centre for Development, Technology and Innovation (CRTI), M.C. Carneiro, A.L.P. Blanco and L. Silva for the LA-ICPMS analyses at CETEM, and ROS Borges and E.L.F. Vianna for support with microthermometry analyses. The careful review of the manuscript by S. Broom-Fendley and M. Grégoire has significantly improved it.
Supplementary material
To view supplementary material for this article, please visit https://doi.org/10.1180/mgm.2019.43.