


Introduction
After the first report about Antarctic ozone depletion (Farman et al. Reference Farman, Gardiner and Shanklin1985), many other studies have appeared concerning this interesting phenomenon (Brasseur & Solomon Reference Brasseur and Solomon2005). Nowadays, it is well known that such a thinning of the ozone layer covers a large area of the Antarctic continent and takes place during the spring months (WMO 2003, Newman et al. Reference Newman, Kawa and Nash2004, Stolarski et al. Reference Stolarski, McPeters and Newman2005). Since solar radiation in Antarctica increases rapidly in such period, due to the rapid increase of solar elevation, the low ozone column amounts could lead to a significant enhancement of the fraction of ultraviolet B (UV-B, from c. 290–315 nm) that reaches the Earth surface (Stamnes et al. Reference Stamnes, Jin and Slusser1992, Prause et al. Reference Prause, Scourfield, Bodeker and Diab1999, Láska et al. Reference Láska, Prošek, Budík, Budíková and Milinevsky2009). Such an increase can damage the Antarctic fauna (Hernandez et al. Reference Hernandez, Gustavo and Walter2002, Newman et al. Reference Newman, Ritz and Nicol2003, Rozema et al. Reference Rozema, Boelen and Blokker2005) and affects the photochemical reactions impacting the atmospheric composition of the South Hemisphere polar regions (Qian et al. Reference Qian, David and Kieber2001, Wolff et al. Reference Wolff, Jones, Martin and Grenfell2002, Cotter et al. Reference Cotter, Jones, Wolff and Bauguitte2003). However, the variability in the surface solar UV irradiance is affected not only by total ozone, in spite of its considerable effect on UV, but also by variety of environmental factors such as cloud cover conditions, surface albedo and aerosol loadings (Lubin & Frederick Reference Lubin and Frederick1991, Bernhard et al. Reference Bernhard, Booth and Ehramjian2004). Clouds are able to impact appreciably surface UV irradiance leading to either its reduction, in case of completely overcast sky, or enhancement, for some favourable cloud configurations (Calbó et al. Reference Calbó, Pagès and González2005). Thus, the monitoring of surface UV irradiance at Antarctica expands our knowledge about interactions between solar radiation and specific Antarctic environment and contributes to investigations of polar biosphere processes. Numerous stations performing continuous measurements of solar UV irradiance are located in the coastal zone of the continent. Only a few sites on the Antarctic Plateau carry out such activity.
This study presents the variations of surface UV irradiance observed at the Italian-French station, Concordia (75°06′S, 123°21′E, 3233 m a.s.l.), which has been working since 2005 as a permanently operating station, providing a unique opportunity to study the atmospheric processes in the vast East Antarctic Plateau region. Regarding ozone depletion, the effects of this yearly phenomenon on the low tropospheric components have been investigated since its establishment. The next sections discuss the impact of the total ozone column, measured at Concordia by several different techniques, on solar irradiance at some wavelengths chosen to represent the UV-B band, during the springs of 2008 and 2009. In addition, the corresponding time patterns of a spectral component within the ultraviolet A (UV-A) band (315–400 nm) are compared with the atmospheric transmittance characteristics determined from broadband solar irradiance measurements carried out routinely at the station.
Instrumentation
Concordia (Fig. 1) is equipped with several instruments measuring, on the one hand, almost the whole solar irradiance spectrum at the ground and, on the other, only its UV part, all operating as a part of the Baseline Surface Radiation Network (BSRN) (Ohmura et al. Reference Ohmura, Dutton, Forgan, Frohlich, Gilgen, Hegner, Heimo, Konig-Langlo, McArthur, Muller, Philipona, Pinker, Whitlock, Dehne and Wild1998). A short description of the devices providing the data for this study is given below.
Position of Concordia station on the Antarctic continent.

Both direct and diffuse components of the global solar irradiance in the 0.3–3 μm spectral range are monitored by means of upper class Kipp & Zonen radiometers CM22 and CH-1, mounted on a 2AP-GD tracker, adapted to the severe environmental conditions of Concordia. The quality of the instrumentation together with the solutions adopted for levelling and heating the tracker assured a good continuity and reliability of the measurements. Instrumental setup and data processing strictly follow the protocols defined in the frame of the BSRN network. In particular, raw data (1 Hz) are stored to allow, if necessary, a re-analysing of the data by means of improved algorithms without loss of accuracy. Quality checked data, up to mid 2009, are stored in the BSRN archive (www.bsrn.awi.de).
The narrowband filter radiometer UV-RAD, based at Concordia in November 2007, measures solar irradiance at seven channels peaking at 300, 306, 310, 314, 325, 338 and 364 nm, with full width at half maximum varying between 0.6 and 1.0 nm (Petkov et al. Reference Petkov, Vitale, Tomasi, Bonafé, Scaglione, Flori, Santaguida, Gausa, Hansen and Colombo2006). The instrument sensor is a photomultiplier R269 produced by Hamamatsu, thermostabilized at 5 ± 0.5°C. Cosine error of the entrance optics is estimated to vary from 4–6% for solar zenith angles (SZAs) ranging between 60° and 85° and a correction procedure removing such an error from the measured UV data is applied. The irradiance threshold limit is evaluated to be equal to 3 x 10⁻⁵ W m-2 nm-1. The total ozone column Q can be retrieved from the UV-RAD data by the method developed by Stamnes et al. (Reference Stamnes, Slusser and Bowen1991) and a reconstruction of the surface UV irradiance spectrum allows an assessment of the biologically weighted doses. UV-RAD was calibrated through a comparison with the identical instrument routinely operating at the Institute of Atmospheric Sciences and Climate (ISAC) of the Italian National Research Council (CNR), Bologna, Italy, in 2007 and performs one scan of all the channels every five minutes.
The SAOZ (Système d'Analyse par Observations Zénithales) instrument is a zenith-sky UV-visible (300–650 nm) spectrometer developed at the Service d'Aéronomie in the late 1980s for monitoring the total ozone and NO2 amounts in the atmosphere (Pommereau & Goutail Reference Pommereau and Goutail1988). It is a diode array flat field spectrometer of 1 nm resolution looking at sunlight scattered at zenith during twilight. Such measurements, analysed by differential optical absorption spectrometry, allow the retrieval of ozone and NO2 columns at sunrise and sunset.
Dataset
As pointed out above, the largest variations in ozone column over Antarctica take place during the spring, making this period especially attractive for studying the impact of such variations on surface solar UV irradiance. Since such impact is masked by the diurnal irradiance changes, variability due to ozone variations alone is usually determined considering the measurements of UV irradiance made at fixed SZA zo (Booth & Madronich Reference Booth and Madronich1994, Blumthaler et al. Reference Blumthaler, Salzgeber and Ambach1995).
The day-to-day solar elevation at Concordia increases sharply at the beginning of spring, presenting values of no more than 1–2° in the middle of August, whereas at the end of November the minimal daily elevation is already 5–6°. Thus, in order to have a surface UV irradiance dataset that covers the ozone depletion period to the maximum extent, it seems appropriate to choose zo = 85°. Although solar irradiance at this elevation usually exceeds the UV-RAD threshold, the measurements performed in such conditions are affected by instrumental errors due to low signal level and increased uncertainty in cosine error estimation. Hence, the UV-RAD ability to represent realistically the UV variations at this zenith angle needs to be ascertained. Therefore, it was decided to compare the variations in surface UV registered at zo = 85° with the corresponding ones observed at lower SZAs zo where measurement accuracy is higher. To perform such a comparison, each dataset composed from the irradiance  measured at SZA zo and wavelength λ on ith day (i = 1, 2, 3,…,N) was normalized by the value of irradiance
 , registered at the same zo on a fixed day m. In this case, the sequence of ratios defined as

gives the variations of UV irradiance pertaining to dataset  with respect to the reference day m and in this case the irradiance changes represented by different datasets will be comparable with each other if the day m is the same for all of them. For Eq. (1), m = 304 for 2008, and m = 303 for 2009 were chosen (that is 30 October in both cases), presenting total ozone equal to 212 DU and 170 DU, respectively, as given by SAOZ. Since the solar elevation corresponding to a fixed SZA usually takes place two times per day, the higher of both irradiance values was taken, assuming that it is less affected by clouds.
Figure 2 shows the evolutional trend of irradiance  determined at λ = 306 nm, for which the UV-RAD output is lower than at the longer wavelengths, assessed for three datasets corresponding to zo = 65°, 75° and 85°. Values of irradiance
 varied from 2.2 x 10⁻² W m-2 nm-1 to 3.2 x 10⁻⁴ W m-2 nm-1 when zo changed from 65 to 85 in 2008 and from 3.1 x 10⁻² W m-2 nm-1 to 4.8 x 10⁻⁴ W m-2 nm-1 in 2009. The figure shows good agreement between the time patterns for 306 nm UV irradiance variation given by these datasets. Some discrepancies seen between the curves can be explained by considering that measurements corresponding to different zo, correspond to different times of day as well, sometimes characterized by different cloud conditions. It can be expected that specific daily cloud configurations would lead to different behaviour of
 for some days. The cloud conditions will be discussed later, but it is worth noticing here that the presence of cloud bands in September and November 2008 and 2009 (see Fig. 3), can be a plausible reason for comparatively higher discrepancies between
 for different zo within these periods. Hence, UV irradiance variations observed at zo = 85° are in good agreement with those found at lower SZAs. Moreover, this dataset covers the major part of the early spring, from 26 August–16 November, characterized by the most significant total ozone column changes. Therefore, it is chosen below to represent (see Fig. 3) the relationship between UV-B irradiance and ozone column. This dataset contains 165 measurements of surface solar irradiance for each wavelength, 84 in 2008 and 81 in 2009.
Time patterns of parameter  representing irradiance variations determined by UV-RAD at 306 nm during 2008 and 2009 at three different SZAs zo. Irradiance values of each dataset were normalized by irradiance
 , measured on 30 October of each year.

Comparison between variations in total ozone, surface UV irradiance and atmosphere transparency observed at Concordia during the 2008 and 2009 springs. a. Time patterns of the total ozone column determined by different instruments. b. Evolutional pattern of solar irradiance at 306 nm given by UV-RAD measurements performed at zo = 85° (solid circles) and corresponding values, corrected for variations caused by clouds (open triangles). c. Time patterns of 364 nm irradiance measured at zo = 85°, shown together with the five day running average given by the thick curve. d. Variations of the cloud transmittance Tcloud (grey dots) obtained following the Long & Ackerman (Reference Long and Ackerman2000) methodology. The thick black curves represent the five days running averaged time patterns of Tcloud. In the same panel, the mean daily values of down-welling LWI irradiation are also given (white triangles) together with five day running averaged time patterns (grey curves).

Results and discussion
A comparison is presented below between the datasets introduced in the previous section, giving on the one hand variations in surface UV irradiance observed at Concordia, and on the other total ozone column and cloud cover characteristics. The ozone column data are provided by SAOZ and the Ozone Monitoring Instrument (OMI; http://macuv.gsfc.nasa.gov/, accessed January 2009), based on the Aura spacecraft. Cloud features were extracted from observations performed by broadband photometers operating at Concordia. Figure 3a shows the variations of total ozone column during the springs of 2008 and 2009 from SAOZ and OMI, with daily averaged ozone column retrieved from UV-RAD given for comparison. The SAOZ total ozone is the mean value of the sunrise and sunset measurements. Such a quantity provides a satisfactory approximation of the corresponding average daily amounts. Figure 3a shows good agreement between the datasets provided by three instruments, and the appreciable variation in ozone column in the course of the two springs.
Figure 3b & c present the time patterns of global solar irradiance I(306) and I(364) corresponding to the wavelengths 306 and 364 nm, respectively, as determined by UV-RAD at zo = 85°. The first wavelength is thought to represent the behaviour of UV-B irradiance whereas the second reflects the features of UV-A spectral band. Considering the variations of I(364) to be caused by clouds, as will be discussed later, they were used to correct the corresponding trend of irradiance I(306), assuming a similar cloud effect on UV-B. As can be seen from Fig. 3b the impact of ozone column on UV-B at Concordia within the studied period appreciably dominates over the cloud influence. Similar conclusion was made by Bernhard et al. (Reference Bernhard, Booth and Ehramjian2004) analysing the measurements of UV irradiance performed at Amundsen–Scott South Pole observatory (SPO) located at 90°S, 2835 m a.s.l.
Variations of atmospheric transparency above Concordia, defined using the broadband short-wave (SWI) and long-wave (LWI) irradiance measurements, are presented in Fig. 3d. Such a variability is expressed, on the one hand, by 15 minutes averaged cloud transmittance, Tcloud, evaluated as ratio between measured atmospheric transmittance for SWI and corresponding clear sky values determined following the Long & Ackerman (Reference Long and Ackerman2000) approach, and, on the other hand, by the time patterns of the down-welling LWI. It is clearly seen that LWI and the cloud transmittance Tcloud followed opposite trends and hence, such parameters characterize the cloud cover features in good agreement. The LWI makes up for a deficiency of Tcloud data concerning the period from late August to mid September 2008 when the Long-Ackerman method was not able to determine clear sky irradiance because of very short days.
Variation of the total ozone and surface UV-B irradiance
Figure 3a shows that I(306) tends to increase when the ozone column decreases and vice versa, following such a trend during the whole period considered. From late August to the end of September 2008 the total ozone column dropped from c. 300 DU to nearly 130 DU, whereas the same period of 2009 exhibited a less marked decrease within a more limited range with lower bounds, from c. 250–120 DU. Correspondingly, within the same time, I(306) varied by c. 3 x 10⁻⁴ W m-2 nm-1 in 2008, while in 2009 such an amplitude was c. 4 x 10⁻⁴ W m-2 nm-1. Figure 3a indicates that, during the period of 2009 studied here, the ozone amount at Concordia was subject to comparatively larger fluctuations giving rise to corresponding features of UV-B irradiance. A sharp minimum of 119 DU registered by SAOZ on 27 September 2009 corresponded to a sharp maximum of I(306). Similarly, at the beginning of November 2009 the ozone column showed an ample minimum that corresponded to a large maximum of I(306). The mean level of 306 nm irradiance measured at zo = 85° for 2008 was evaluated to be c. 2.9 x 10⁻⁴ W m-2 nm-1, whereas for the same period of 2009 such a quantity was c. 3.5 x 10⁻⁴ W m-2 nm-1 or 21% higher. Such a discrepancy agrees with the conclusion made by Bernhard et al. (Reference Bernhard, Booth and Ehramjian2004) who reported considerably high year-to-year variation of UV-B irradiance registered at SPO in the spring due to the influence of ozone depletion event.
The relationship between irradiance at 306 nm measured at zo = 65°, 75° and 85° and total ozone is illustrated in the left panels of Fig. 4, where the values of I(306) are plotted versus the corresponding daily mean ozone column Q, provided by SAOZ, except for the period from 3–16 November 2008 for which the ground-based observations of Q were not available and satellite results are used instead. Field measured I(306) values are fitted by power curves (Madronich Reference Madronich1993):

where C is a constant and the exponent, the radiation amplification factor (RAF), indicates the extent of dependence between UV irradiance and ozone column. For the datasets presented in Fig. 4, RAF was found to be 1.76, 1.94, and 1.58 for zo = 65°, 75° and 85°, respectively. Booth & Madronich (Reference Booth and Madronich1994) reported RAF = 2.2 for deoxyribonucleic acid (DNA) damage-weighted irradiance and RAF = 1.1 for erythemal-weighted irradiance both found as a result of measurements performed for SZAs lower than 80° at SPO between 1991 and 1992. It is worth noticing that irradiance at wavelength below 305 nm carries comparatively high weight in DNA damage evaluation (Setlow Reference Setlow1974) and that RAF is a wavelength-sensitive parameter usually increasing with decreasing wavelength (Blumthaler et al. Reference Blumthaler, Salzgeber and Ambach1995). Bearing in mind these factors, the above values of RAF determined for λ= 306 nm at Concordia can be considered as being in good agreement with the Booth & Madronich (Reference Booth and Madronich1994) findings, which are higher by 13–25% depending on SZA.
a. Left: irradiance I(306) measured by UV-RAD versus total ozone column determined by SAOZ and OMI instruments for zo = 65°. The best fit curve (solid) is presented together with the corresponding standard error of estimation given as two dashed curves. An analytical expression of the best fit and the regression coefficient r are also given. Right: model estimations of parameter I(306) performed for the same sequence of ozone column values as in the left panel and atmospheric transmittance given in Fig. 3d. Blue squares represent the assessed I(306) values using the atmospheric ozone profile indicated as 1 in Fig. 7a, whereas the yellow triangles up and pink triangles down concern profiles 2 and 3 in Fig. 7a. The fitting curve with standard error of estimate shown in the left panel are also given in the right panel. b. The same as in part a, but for zo = 75°. c. The same as in part a, but for zo = 85°. Right: Besides the curves corresponding to ozone profiles 1, 2 and 3, as in right part of a, the green circles refer to the irradiance, evaluated trough profile 4 in Fig. 7b, whereas the red diamonds correspond to profile 5 in Fig. 7b.

The left panels of Fig. 5 show analogous relationships between UV irradiance at 314 nm, which is less impacted by ozone, and the ozone column Q. At this wavelength, RAF presents values of 0.68, 0.88 and 0.68, in the same SZA sequence. Finally, Fig. 6 exhibits a similar dependence of erythema active UV irradiance IE (see Eq. (3)) on Q for the same set of SZAs, presenting values equal to 0.95, 0.97 and 0.71. Performing observations of UV-B irradiance by YES UV pyranometer and determining the ozone column by SAOZ at SANAE Antarctic coastal station (70°18′S, 20°25′W, 40 m a.s.l.) Prause et al. (Reference Prause, Scourfield, Bodeker and Diab1999) estimated RAF to be c. 0.76 for z = 60° and 0.81 for z = 75°. Corresponding RAF values determined from the observations at Concordia are c. 20% larger than such results. The difference is plausibly due to the different spectral composition of the irradiance parameters: our values are erythemal-weighted irradiances, whereas values reported by Prause et al. (Reference Prause, Scourfield, Bodeker and Diab1999) are integrated UV-B irradiances. At the same time, the RAF found for IE at Concordia turned out to be 13–16% smaller than that evaluated by Booth & Madronich (Reference Booth and Madronich1994) at SPO.
The same as Fig. 4 but concerning irradiance I(314) measured at the 314 nm wavelength.

a. Erythemal-weighted irradiance IE determined by UV-RAD measurements versus total ozone column provided by SAOZ and OMI instruments for zo = 65°. The best fit curve (solid) is presented together with the corresponding standard error of estimation given as two dashed curves. An analytical expression of the best fit and the regression coefficient r are also given. b. and c. The same as in a, but for zo = 75° and 85°, respectively.

Various authors reported a dependence of RAF on SZA. For different spectral bands and locations, it can vary between 20% and 70% when SZA goes from 30–70° (McElroy et al. Reference McElroy, Kerr, McArthur and Wardle1994, Blumthaler et al. Reference Blumthaler, Salzgeber and Ambach1995). The present results indicate a RAF increase ranging between 2% and 30% for different spectral components for SZA increasing from 65–75° at Concordia. Although the data at 85° shown in Figs 4–6 are comparatively highly scattered, the corresponding RAF values tend to decrease with respect to those determined at zo = 75°.
Model simulations of UV-B irradiance
In order to confirm the reliability of the above results, we modelled radiative transfer to simulate the relationship between irradiance at 306 nm and 314 nm on the one hand, and total ozone on the other. Such evaluations were performed using the Tropospheric Ultraviolet-Visible (TUV) radiative transfer model, version 4.6 (Madronich & Flocke Reference Madronich and Flocke1997), with the ozone column of Fig. 3a and the atmospheric transmittance of Fig. 3d as input parameters. Other inputs were: 1) surface pressure equal to 644.4 hPa and October mean temperature profile, both defined by Tomasi et al. (Reference Tomasi, Petkov, Stone, Benedetti, Vitale, Lupi, Mazzola, Lanconelli, Herber and von Hoyningen-Huene2010) based on a large set of radiosoundings launched at Concordia, 2) surface albedo assumed to be 0.9, and 3) aerosol optical depth at 550 nm taken to be equal to 0.019 with Ångström exponent α = 1.61 (Tomasi et al. Reference Tomasi, Vitale, Lupi, Di Carmine, Campanelli, Herber, Treffeisen, Stone, Andrews, Sharma, Radionov, von Hoyningen-Huene, Stebel, Hansen, Myhre, Wehrli, Aaltonen, Lihavainen, Virkkula, Hillamo, Ström, Toledano, Cachorro, Ortiz, De Frutos, Blindheim, Frioud, Gausa, Zielinski, Petelski and Yamanouchi2007). Various studies (Dahlback Reference Dahlback1996, Lapeta et al. Reference Lapeta, Engelsen, Litynska, Kois and Kylling2000, McKenzie et al. Reference McKenzie, Smale, Bodeker and Claude2003, Kazantzidis et al. Reference Kazantzidis, Bais, Balis, Kosmidis and Zerefos2005) showed that at SZAs larger than 70° the use of a realistic vertical ozone distribution is an important requirement for accurate model assessment of irradiance in the UV-B band. For that reason, several profiles obtained by Solomon et al. (Reference Solomon, Portmann, Sasaki, Hofmann and Thompson2005), analysing a 40 year dataset of ozone-sounding measurements performed at Antarctic coastal and plateau sites, were applied to the computations. Figure 7a shows profiles we used, representing averaged October data obtained at SPO and Syowa stations for different years. The profiles have been normalized by the maximum value of ozone concentration registered in the 1966–71 period (profile 3) in order to highlight the features of vertical ozone distribution variations. Results of our evaluations are presented in the right panels of Figs 4 & 5, where the curves corresponding to ozone profiles 1–3 in Fig. 7a are represented using the same symbols and colours.
a. The October average ozone profiles reported by Solomon et al. (Reference Solomon, Portmann, Sasaki, Hofmann and Thompson2005) for 1. South Pole 1991–2000, 2. Syowa 1980–1987, and 3. South Pole 1966–1971. Above 30 km the profiles have been extrapolated by US standard ozone profile (Anderson et al. Reference Anderson, Clough, Kneizys, Chetwynd and Shettle1986). b. Hypothetical vertical ozone distribution used to verify the relative contribution of the different layers of profile 1 from the left panel, on the model accuracy (see the text). All profiles presented in both panels have been normalized by the maximum value of profile 3.

The results indicate that at zo = 65° for both wavelengths and at zo = 75° for 314 nm the computed irradiance does not depend on ozone profile (Smith et al. Reference Smith, Wan and Baker1992, Lapeta et al. Reference Lapeta, Engelsen, Litynska, Kois and Kylling2000, Kazantzidis et al. Reference Kazantzidis, Bais, Balis, Kosmidis and Zerefos2005), and at the same time the evaluated irradiance is very close to the field measurements. However, at zo = 75° and 306 nm, the calculated irradiance shows a slight dependence on the shape of vertical ozone distribution, dependence that becomes much more marked at zo = 85°. Whereas for 314 nm at zo = 85° the calculated irradiance appears to depend only on ozone profile, for 306 nm, at the same SZA the model irradiance shows a dependence on the ozone column as well, exhibiting bigger discrepancies between curves corresponding to different profiles at low total ozone values than at higher ones. At λ= 306 nm at zo = 75° the computed irradiance is close to the measured one for Q higher than c. 230 DU, whereas for lower ozone column the model tends to an overestimation. At zo = 85° and ozone column higher than c. 180 DU in case of 314 nm and 160 DU for 306 nm, the use of profiles 2 and 3, respectively, of Fig. 7a leads to a better approximation of field measurements. For lower ozone column, profile 1, representing a typical vertical distribution for the ozone depletion event, brings the model closer to the field observations. Therefore, ozone profile probably changed significantly during the period from late August to the middle of November, with profile 1 of Fig. 7a plausibly taking place at Concordia in September and October, when ozone reached values <180 DU.
Figure 7a clearly shows that during ozone depletion the stratosphere ozone maximum is usually appreciably reduced, giving rise to two small maxima at c. 12 km and 25 km. The figure indicates that ozone profile 1 can be arbitrarily divided into two layers: 1) from the surface to c. 17 km, and 2) from 17 km to the top of the atmosphere. The relative contribution of each of them to the model estimation accuracy can be checked performing evaluations of surface irradiance using two hypothetical vertical ozone distributions corresponding to the above two layers, as shown in Fig. 7b. The results of calculations assuming these two profiles are given in the right panels of Figs 4c & 5c. A better agreement between observed and model irradiances is achieved when the profile corresponding to the upper maximum is considered, whereas the model overestimates appreciably when considering only the lower maximum. It could mean that the upper maximum of the ozone vertical distribution taking place at the time of measurements at Concordia during the 2008 and 2009 ozone depletion event, probably presented a higher value with respect to that introduced by profile 1 in Fig. 7a and at the same time the lower maximum plausibly was smaller.
The measured irradiances presented in the left panels of Figs 4 & 5 are scattered significantly more than the corresponding model values, although the atmospheric transmittance characteristics were taken from field measurements. This discrepancy could result from the multiple scattering and reflectance processes that, especially in case of lower solar elevations, cannot be realistically represented by one-dimensional models.
Erythema effective UV irradiance at Concordia
Erythema effective UV irradiance IE(t) at time t is determined as:
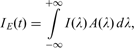
where I(λ) is the spectrum of surface global solar irradiance expressed in W m-2 nm-1 and A(λ) is the erythemal action spectrum (McKinlay & Diffey Reference McKinlay and Diffey1987). The ultraviolet index (UVI), introduced as an indicator of the solar UV potential to damage the human skin, can be estimated multiplying IE(t) by 40 (WHO 2002), whereas the corresponding erythemal dose DE absorbed by the skin for a period Δt is assessed as the integral of IE(t) over this period. Figure 8 represents an assessment of midday UVI and daily (Δt = 00–24 UTC) erythemal dose DE determined for the period from November 2007–November 2009 at Concordia, through measurements performed by UV-RAD. During the summer, UVI shows a mean value of c. 6, as shown in Fig. 8a. However, in the days with lowest ozone column in November and December, when sun elevation is greater, UVI reaches values up to 8, that is the same as the typical average values registered at Bologna, Italy (44°31′N, 11°20′E) from June–August. Similar high values of UVI in Antarctica are reported by Prause et al. (Reference Prause, Scourfield, Bodeker and Diab1999) who measured IE = 0.220 W m-2 (UVI = 8.8) at SANAE station in 1994. Concordia is located at latitude higher by c. 5° with respect to SANAE, but its altitude is also much higher, leading to the level of UVI being comparable to that of SANAE. Bernhard et al. (Reference Bernhard, Booth and Ehramjian2004) reported that UVI does not exceed c. 4 at SPO, which is about half the values registered at Concordia. This difference is mainly due to the comparatively large latitudinal distance between two stations, c. 15°. As a result the highest solar elevation at SPO is c. 24° (SZA = 66°) while the corresponding parameter at Concordia is c. 38° (SZA = 52°).
a. Ultraviolet index UVI assessed at noon for measurements performed by UV-RAD from November 2007–November 2009. b. Daily erythemal dose determined by UV-RAD (solid circles) for the same period together with the corresponding value evaluated by TUV model (white squares), considered to represent the dose under clear sky conditions.

Figure 8b shows that the maximum level of the erythemal dose DE at Concordia is between 5.5 and 6.5 kJ m-2 with some cases, as for UVI, presenting values of c. 7 kJ m-2, which is slightly higher than the similar values found at SPO, varying between 4 and 6 kJ m-2 (Bernhard et al. Reference Bernhard, Booth and Ehramjian2004). Similarity between the daily erythemal doses measured at SPO and Concordia, in spite of the appreciable differences between the corresponding irradiances IE, is related to the different solar geometry. Although the summer sun elevation at SPO is much lower than the corresponding elevation at Concordia, SZA at SPO is almost constant during the day (00–24 UTC) in December while at Concordia it shows a variability of c. 17°, changing between 52° and 69°. Variations of DE presented in Fig. 8b agree with those reported by Prause et al. (Reference Prause, Scourfield, Bodeker and Diab1999) as a result of observation performed at SANAE station.
Time patterns of both UVI and DE given in Fig. 8 present a stable level of these parameters that is mainly due to the slight cloud cover at this site. On the contrary, erythemal-weighted solar UV irradiance and corresponding doses measured at Vernadsky Station (65°02′S, 64°15′W) showed sharp day-to-day variations (Láska et al. Reference Láska, Prošek, Budík, Budíková and Milinevsky2009), probably caused by significant changes in cloud cover characteristics as in mid latitude zones. Model evaluations of the erythemal dose made assuming a zero cloud and aerosol optical depth can be considered to represent the corresponding clear sky values. These amounts, presented also in Fig. 8b, clearly show that the variations of erythemal irradiance are mainly due to the ozone changes and in practice were not impacted by clouds. Thus, the specific location and environment of Concordia leads to enhanced risk of sunburn, as analysis of the erythemal-weighted irradiance shows, which should be taken into account by the personnel and visitors of the station.
Variation of surface UV-A irradiance and cloud cover conditions
The UV-A solar irradiance is known to be virtually unaffected by total ozone column (Lubin & Frederick Reference Lubin and Frederick1991). In fact, the evaluations made by TUV model showed that irradiance at 364 nm should increase by c. 0.02% when total ozone decreases from 300–100 DU. Thus, the behaviour of the UV-A irradiance measured at the ground is usually considered to depend mainly on the atmospheric transmittance arising from different cloudiness conditions. To analyse such a dependence, it was decided to compare the I(364) variations with the corresponding variations of the atmospheric transparency above Concordia presented in Fig. 3d. Analysing the features of Tcloud and LWI time patterns it can be concluded that the second half of September 2008 was characterized by comparatively strong cloudiness, slightly decreasing until the beginning of October 2008. Later, clear sky conditions were predominant for most of October. Cloud coverage increased again in November 2008. During the spring of 2009, the parameter Tcloud showed comparatively higher values characterized by less marked variations. Cloudiness features determined through the analysis of ground-based irradiation measurements agree with observations performed by the Calipso satellite when it passed over the East Antarctic Plateau.
The mean value of 364 nm irradiance during spring 2008 was evaluated to be equal to 5.61 x 10⁻² W m-2 nm-1, whereas the corresponding value for 2009 was 6.12 x 10⁻² W m-2 nm-1, which is c. 9% higher than the 2008 value. Such difference can be accounted for by the comparatively higher atmospheric transmittance during the 2009 spring, as can be concluded from Fig. 3d.
A parameter, introduced by Lubin & Frederick (Reference Lubin and Frederick1991) and defined as a ratio R between measured and modelled irradiance at wavelengths less influenced by ozone, makes it possible to study the effect of clouds on surface UV irradiance, assuming that the radiative transfer model is able to represent realistically the irradiance features. Although the one-dimensional model is not appropriate for representing cloud scattering properties in case of partly cloudy sky, the authors considered that the parameter R is useful for characterizing both total and partial cloudiness. The necessary model evaluations, performed by TUV using the above inputs, gave a value of 6.14 x 10⁻² W m-2 nm-1 for surface irradiance at 364 nm that remains constant during the period considered since the SZA was fixed at 85°. Figure 9 presents the histogram of R for the irradiance measurements shown in Fig. 3c and the theoretical value obtained above. The distribution of ratio R demonstrates that clear sky conditions were predominant at Concordia during the period studied. The days characterized by R < 1 were found to be c. 67% of total. Part of the other 33%, corresponding to R > 1, can certainly be attributed to an enhancement of surface UV irradiance due to a particular cloud configuration. In fact, as shown by Fig. 3d, cloud transmittance at Concordia is usually above 0.95 and the cases in which the measured global irradiance is higher than that estimated for clear sky are not infrequent. Since TUV is a one-dimensional model, it is not able to reproduce multiple scattering and reflectance processes caused by a specific cloud configuration in case of fractional coverage and extremely high surface albedo. These particular situations can be realistically represented by three-dimensional models (Degünther & Meerkötter Reference Degünther and Meerkötter2000).
Distribution of the irradiance ratio R defined as the ratio between measured irradiance at 364 nm and the corresponding value from a radiative transfer model for all the measurements performed at SZA zo = 85°, presented in Fig. 3c.

The percentage of cases presenting R > 1 for Concordia is in good agreement with the results reported by Lubin & Frederick (Reference Lubin and Frederick1991) who found that more than 25% of the R values determined at Palmer Station (64°46′S, 64°04′W, 7.5 m a.s.l.) exceeded 1 in case of fractional cloud coverage. However, the shape of parameter R distribution presented by Lubin & Frederick (Reference Lubin and Frederick1991) is close to the Gaussian distribution while the features of that corresponding to Concordia, shown in Fig. 9, are very similar to distributions given by Bernhard et al. (Reference Bernhard, Booth and Ehramjian2004) for SPO.
Conclusions
The variations in UV irradiance observed at Antarctic station Concordia during the early springs of 2008 and 2009 were compared with the corresponding variations in total ozone column and cloudiness characteristics. The analysis of the results shows that the variability in UV-B irradiance strongly depended on the changes in ozone column and was impacted to a much lesser extent by clouds, as previous studies made in Antarctica reported. On the contrary, the UV-A band was mainly affected by cloudiness, presenting c.±25% variations as a result of variability in atmospheric transparency due to clouds. Radiation amplification factor determined for SZAs equal to 65°, 75° and 85° varied from 1.58–1.94 for 306 nm irradiance, whereas for 314 nm it ranged between 0.68 and 0.88. These RAF values indicate that the measured ozone variations of c. 2.5 times led to changes of UV-B irradiance at 306 nm by factors of c. 4.0, 5.0 and 4.5 for observations performed at 85°, 75° and 65° SZAs, respectively, whereas the corresponding changes in 314 nm irradiance were found to be by factors of c. 1.7, 2.2 and 1.8. It was found that the ozone variability caused c. 21% enhancement of 306 nm irradiance during the early spring of 2009 with respect to the same period of 2008, whereas the comparatively higher atmospheric transmittance in the spring of 2009 led to c. 9% higher level of UV-A irradiance at Concordia. Assessments indicate that the erythema active solar irradiance at Concordia in the summer can reach values as high as at mid latitude sites that should be taken into account by the station personnel and visitors.
The model simulations show a high sensitivity to vertical ozone distribution of surface solar UV-B irradiance observed at 85° SZA. Estimations, made by using different profiles found to represent realistically diverse patterns of spring ozone distribution, indirectly indicated that at Concordia in September and October this parameter presented features similar to the profile typical for an ozone depletion event. The analysis of the ratio between measured and modelled UV-A irradiances, introduced in previous research, showed that clear and partly covered skies were predominant during the springtime periods studied.
It is considered that this new station provides a great opportunity to improve our knowledge about ozone depletion dynamics and corresponding surface UV irradiance variations, offering an additional observation point, located close to the area where ozone content reaches minimum values during the spring.
Acknowledgements
This research was supported by the Progetto Nazionale di Ricerche in Antartide (PNRA) and developed as a part of the subproject 2004/2.04 Implementation of the BSRN station at Dome Concordia. Authors are grateful to reviewers for helpful comments and stimulating suggestions leading to significant improvement of the paper.



